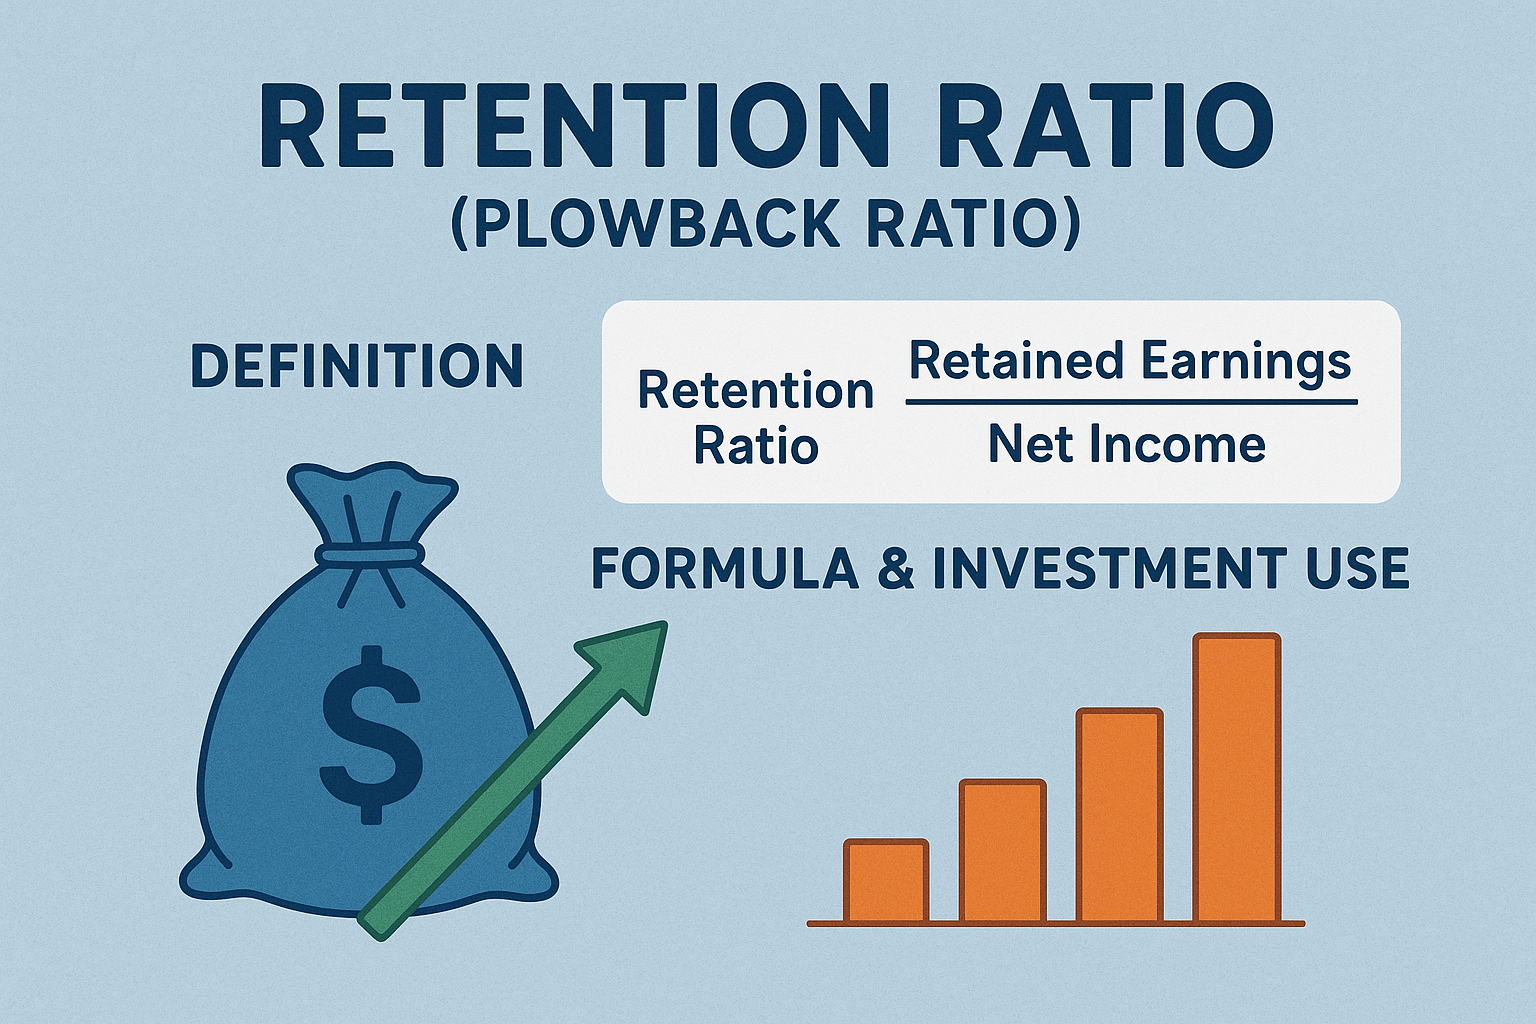
The retention ratio (also called the plowback ratio) shows what percentage of a company’s net income is retained for reinvestment instead of being paid out as dividends. Investors use this metric to understand whether management is fueling growth or prioritizing shareholder payouts.
This guide goes beyond the basics: you’ll learn the formula, interpretation, how it connects to valuation models like the sustainable growth rate, real-world examples, risks, and FAQs most competitors miss. Investopedia: Plowback Ratio
TL;DR (Quick Summary)
The retention ratio = (Net Income − Dividends) ÷ Net Income
It complements the dividend payout ratio (they sum to 1).
High retention = focus on reinvestment; low retention = focus on dividends.
Key use: forecasting growth in valuation models (SGR = ROE × Retention).
Must be paired with ROE/ROIC to judge if reinvestment is value-creating.
What Is the Retention Ratio?
The retention ratio tells you how much profit a company keeps to reinvest in operations, pay down debt, or build reserves.
- High retention ratio → management believes reinvestment yields growth.
- Low retention ratio → The company prefers rewarding shareholders through dividends.
Also called:
- Plowback ratio
- Earnings retention ratio
- Net income retention
This makes it the mirror image of the dividend payout ratio together, they describe a company’s capital allocation.
🔗 Related reading: Payout Ratio Explained.
How to Calculate Retention Ratio
Formula:
Retention Ratio = (Net Income – Dividends) / Net Income
or equivalently:
Retention Ratio = 1 – Dividend Payout Ratio
Retention Ratio = (Earnings per Share (EPS) – Dividends per Share (DPS)) / EPS
Worked Examples
| Example | Net Income | Dividends Paid | Retention Ratio |
|---|---|---|---|
| Growth Tech | $1,000,000 | $0 | 100% |
| Mature Consumer Firm | $500,000 | $150,000 | 70% |
| Utility | $200,000 | $140,000 | 30% |
Retention vs Payout
Below is a simple chart showing how earnings split between retention and dividends in three industries:
- Tech retains almost all earnings.
- Consumer staples balance between growth and payouts.
- Utilities prioritize dividends.

Retention vs Payout across Tech, Consumer Staples, and Utilities. Tech retains most earnings, Consumer Staples balance growth and payouts, while Utilities prioritize dividends. CFI: Retention Ratio Guide
Interpreting the Retention Ratio
High Retention Ratio
- Typical for tech, biotech, or growth companies.
- Suggests management sees strong reinvestment opportunities.
Low Retention Ratio
- Common in utilities, telecom, and REITs.
- Reflects focus on steady dividends for shareholders.
Lifecycle Context
A startup → high retention, zero dividends.
A mature firm → stable dividends, lower retention.
🔗 See also: Dividend Aristocrats: Long-Term Dividend Payers.
Retention Ratio in Practice: Apple vs Alphabet vs Duke Energy
A retention ratio is not just theory, it plays out very differently depending on a company’s industry and dividend policy. Let’s look at three contrasting examples:
- Apple (AAPL): Mature tech giant, pays dividends but still retains most earnings for reinvestment.
- Alphabet (GOOGL): Parent of Google, pays no dividend, effectively a 100% retention ratio.
- Duke Energy (DUK): A regulated utility, required to pay out large dividends, so it retains far less.
Estimated Retention Ratios (2019–2024)
| Year | Apple Retention % | Alphabet Retention % | Duke Energy Retention % |
|---|---|---|---|
| 2019 | 80% | 100% | 35% |
| 2020 | 82% | 100% | 30% |
| 2021 | 85% | 100% | 28% |
| 2022 | 84% | 100% | 25% |
| 2023 | 85% | 100% | 26% |
| 2024 | 84% | 100% | 24% |
Data: SEC filings, Macrotrends, Duke Energy annual reports. Retention ratios for Alphabet reflect ~100% because no dividends were paid. Morningstar Company Data

Key Takeaways:
- Alphabet’s retention ratio is consistently near 100%—fueling constant reinvestment in AI, cloud, and advertising.
- Apple balances shareholder returns with reinvestment—its ~80–85% retention ratio supports R&D and buybacks.
- Duke Energy, like most utilities, pays out much more, retaining only ~25–35%. This reflects its stable, regulated business model where investors expect steady dividends.
Retention Ratio in Growth & Valuation Models
Sustainable Growth Rate (SGR)
The sustainable growth rate links retention to return on equity (ROE):
SGR = ROE × Retention Ratio
Example:
If ROE = 15% and retention = 60%, then SGR = 9%.
🔗 Learn more in our guide: Return on Equity (ROE).
Gordon Growth / Dividend Discount Model
In the Gordon Growth Model: P0 = D1 / (r−g)
Growth rate g is often approximated as:
g= Retention × Return on New Investments
Thus, the retention ratio directly affects valuation.
Internal vs Sustainable Growth
- Internal Growth Rate (IGR): Max growth using only retained earnings (no new debt/equity).
- Sustainable Growth Rate (SGR): Growth with stable capital structure.
Real-World Examples & Industry Comparisons
Using Morningstar and SEC 10-K data (2023):
| Company | Net Income | Dividends | Retention Ratio |
|---|---|---|---|
| Apple (AAPL) | $97B | $15B | 85% |
| Alphabet (GOOGL) | $60B | $0 | 100% |
| Johnson & Johnson (JNJ) | $18B | $11B | 39% |
| Duke Energy (DUK) | $4B | $3B | 25% |
Insights:
- Alphabet retains all earnings to fund R&D.
- JNJ balances dividends with reinvestment.
- Utilities like Duke return most profits to shareholders.
Limitations, Risks & Pitfalls
- Retention ≠ effective reinvestment: A company may waste retained earnings on bad acquisitions.
- Negative income: If net income is negative, retention ratio becomes meaningless.
- Industry differences: Comparing Apple to a utility makes little sense.
- One-off events: Special dividends distort ratios.
- Must pair with ROE/ROIC: High retention is good only if reinvestment yields > cost of capital.
How Investors Use Retention Ratio
- Growth stock analysis → High retention firms may reinvest heavily.
- Dividend stock screening → Low retention, high payout firms are dividend favorites.
- Valuation modeling → SGR projections rely on accurate retention estimates.
- Trend analysis → A declining ratio may signal higher payouts ahead.
🔗 Explore more: Dividend Kings: Elite Dividend Payers.
Key Takeaways
- Retention ratio = portion of profits kept for reinvestment.
- Formula: (NetIncome–Dividends)/NetIncome(Net Income – Dividends) / Net Income(NetIncome–Dividends)/NetIncome.
- Connects directly to growth models (SGR, Gordon Growth).
- Industry context matters: tech vs utilities differ greatly.
- Must be paired with ROE/ROIC to judge if reinvestment is value-creating.
Only in rare cases (negative dividends, accounting anomalies).
The metric breaks down; use multi-year averages or focus on cash flow.
No, if reinvested capital earns below cost of equity, value is destroyed.
It’s the flip side of the payout ratio. Higher retention = lower dividends.
Tech and growth → high retention. Utilities, REITs → low retention.
Yes, retention and payout ratios help model future dividend growth.
They are synonyms, both measure retained earnings as a share of net income.
About the Author – Max Fonji
I’m the founder of TheRichGuyMath.com, where I simplify investing and finance for beginners and professionals alike. With decades of financial markets experience, I focus on clear explanations backed by data and authoritative sources.
Disclaimer: This article is for educational purposes only. It does not constitute financial, investment, or tax advice. Always consult a licensed professional before making investment decisions.


