Picture this: Sarah just launched her online bakery, and after three months of hard work, her accountant hands her a document titled “Profit and Loss Statement.” She stares at the rows of numbers, feeling completely lost. Revenue, gross profit, operating expenses, net income; it all looks like alphabet soup with dollar signs. Sound familiar?
If you’ve ever felt intimidated by financial statements, you’re not alone. The Profit and Loss Statement (also called a P&L or income statement) is one of the most important financial documents for any business or investor, yet many people struggle to understand what it’s actually telling them. Whether you’re a small business owner, an aspiring investor, or someone who wants to make smarter financial decisions, learning to read a P&L statement is like gaining a superpower that lets you see exactly how money flows through a business.
In this guide, we’ll break down everything you need to know about reading a Profit and Loss Statement, no accounting degree required. By the end, you’ll be able to look at any P&L and quickly understand whether a business is thriving, struggling, or somewhere in between. Investopedia – Profit and Loss (P&L) Statement Explained
Key Takeaways
- A Profit and Loss Statement shows whether a business made or lost money over a specific period by tracking revenue, expenses, and profit.
- The three main sections are Revenue (money coming in), Expenses (money going out), and Net Income (what’s left over)
- Key metrics like gross profit margin and operating profit reveal a company’s efficiency and financial health better than revenue alone.
- Reading P&L statements helps investors identify profitable companies, and business owners spot areas to cut costs or increase revenue.
- Understanding the difference between gross profit and net profit is critical for making smart financial decisions.
What Is a Profit and Loss Statement?
A Profit and Loss Statement is a financial report that summarizes a company’s revenues, costs, and expenses during a specific time period, usually a month, quarter, or year. Think of it as a financial report card that shows exactly how much money a business earned and spent, ultimately revealing whether it made a profit or suffered a loss.
Unlike a balance sheet (which shows what a company owns and owes at a single point in time), the P&L statement covers a period of time and tells a story about the company’s financial performance. It answers the fundamental question: “Did we make money or lose money?”
Why the Profit and Loss Statement Matters
For business owners, the P&L statement is essential for:
- Tracking profitability month-over-month or year-over-year
- Identifying which expenses are eating into profits
- Making informed decisions about pricing, staffing, and expansion
- Preparing tax returns and securing business loans
For investors, understanding how to read a P&L helps you:
- Evaluate whether a company is worth investing in
- Compare financial performance across different companies
- Identify trends that might signal future growth or decline
- Make smarter decisions about which stocks to buy
Even if you’re just learning about why you should invest, mastering the P&L statement gives you a crucial edge in understanding business fundamentals.
The Three Main Components of a Profit and Loss Statement
Every Profit and Loss Statement follows the same basic structure, organized into three major sections. Let’s break them down one by one.
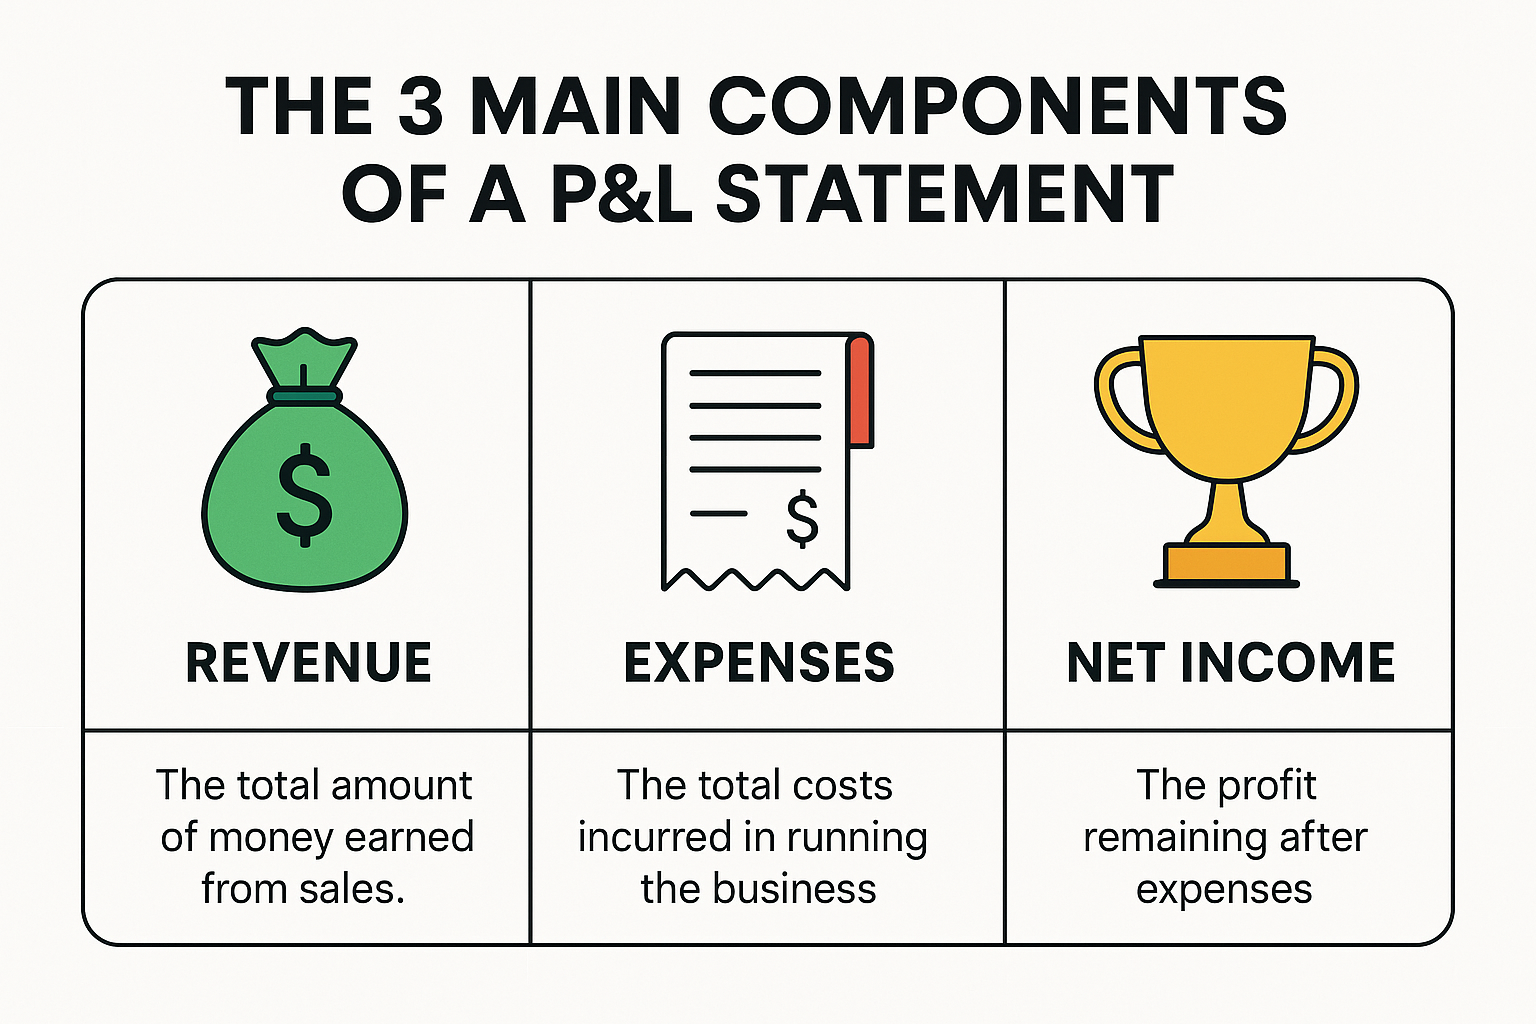
1. Revenue (The Money Coming In)
Revenue, also called sales or income, represents all the money a business brings in from selling its products or services. This is always the first line on a P&L statement and the starting point for all other calculations.
There are different types of revenue:
- Gross Revenue: Total sales before any deductions
- Net Revenue: Sales after deducting returns, discounts, and allowances
Example: If Sarah’s bakery sold $15,000 worth of cakes and cookies in January, but customers returned $500 worth of products, her gross revenue would be $15,000, and her net revenue would be $14,500.
2. Cost of Goods Sold (COGS)
Cost of Goods Sold represents the direct costs of producing the goods or services that were sold. For a bakery, this would include flour, sugar, eggs, and other ingredients. For a software company, it might include server costs and customer support.
COGS does not include indirect expenses like rent, marketing, or executive salaries; those come later.
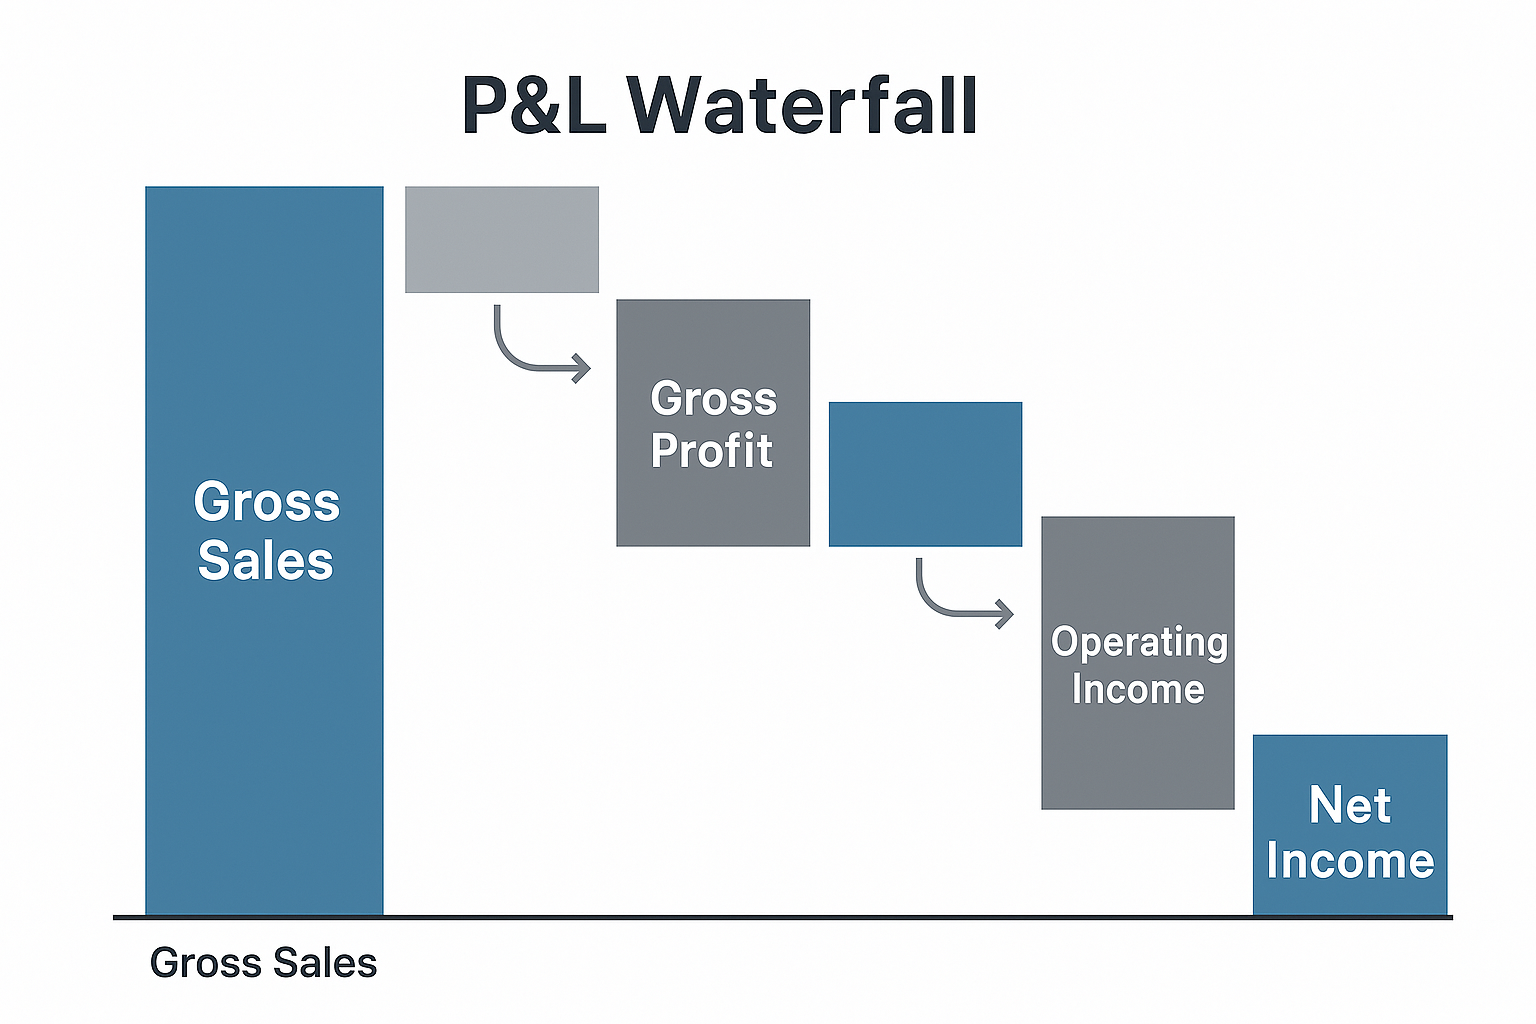
Gross Profit = Revenue – COGS
This calculation shows how much money the business makes from its core operations before accounting for overhead expenses.
Example: If Sarah spent $6,000 on ingredients and packaging in January, her gross profit would be $14,500 (revenue) – $6,000 (COGS) = $8,500.
3. Operating Expenses (Running the Business)
Operating expenses are all the costs required to run the business that aren’t directly tied to producing products. These typically include:
- Selling expenses: Marketing, advertising, sales commissions
- General and Administrative (G&A): Rent, utilities, salaries, insurance, office supplies
- Depreciation and amortization: The gradual reduction in the value of assets over time
Operating Income (also called EBIT, Earnings Before Interest and Taxes) = Gross Profit – Operating Expenses
This number shows how profitable the core business operations are, separate from financing costs and taxes.
Example: If Sarah’s monthly operating expenses total $5,000 (rent, utilities, wages, marketing), her operating income would be $8,500 – $5,000 = $3,500.
Understanding the Bottom Line: Net Income
After accounting for operating expenses, a P&L statement includes a few more items before reaching the final number:
Other Income and Expenses
This section includes:
- Interest income: Money earned from investments or savings
- Interest expense: Money paid on loans or credit
- One-time gains or losses: Selling equipment, lawsuit settlements, etc.
Taxes
Businesses must pay taxes on their profits. The P&L shows income tax expense separately.
Net Income (The Bottom Line)
Net Income = Operating Income + Other Income – Interest – Taxes
This is the famous “bottom line”, the final profit or loss after everything has been accounted for. It’s what the business actually gets to keep (or loses).
Example: If Sarah earned $200 in interest, paid $150 in loan interest, and owed $800 in taxes, her net income would be: $3,500 + $200 – $150 – $800 = $2,750
That’s her actual profit for the month, money she can reinvest in the business, save, or take home as owner’s compensation.
Real-World Profit and Loss Statement Example
Let’s look at a complete P&L statement for Sarah’s Bakery for January 2025:
| Sarah’s Bakery – Profit and Loss Statement | January 2025 |
|---|---|
| Revenue | |
| Gross Sales | $15,000 |
| Less: Returns and Discounts | ($500) |
| Net Revenue | $14,500 |
| Cost of Goods Sold | |
| Ingredients | $4,500 |
| Packaging | $1,500 |
| Total COGS | $6,000 |
| Gross Profit | $8,500 |
| Gross Profit Margin: 58.6% | |
| Operating Expenses | |
| Rent | $1,800 |
| Utilities | $300 |
| Wages | $2,200 |
| Marketing | $400 |
| Insurance | $200 |
| Supplies | $100 |
| Total Operating Expenses | $5,000 |
| Operating Income | $3,500 |
| Operating Margin: 24.1% | |
| Other Income and Expenses | |
| Interest Income | $200 |
| Interest Expense | ($150) |
| Total Other Income | $50 |
| Income Before Taxes | $3,550 |
| Income Tax Expense | ($800) |
| Net Income | $2,750 |
| Net Profit Margin: 19.0% |
This statement tells us that Sarah’s bakery is healthy: she’s making money, her gross profit margin is strong (meaning her pricing is good relative to costs), and she’s managing expenses well enough to achieve a 19% net profit margin. SEC – Financial Statements and Reports
Key Metrics to Calculate from a P&L Statement
Simply reading the numbers isn’t enough; you need to calculate key ratios to truly understand financial performance.
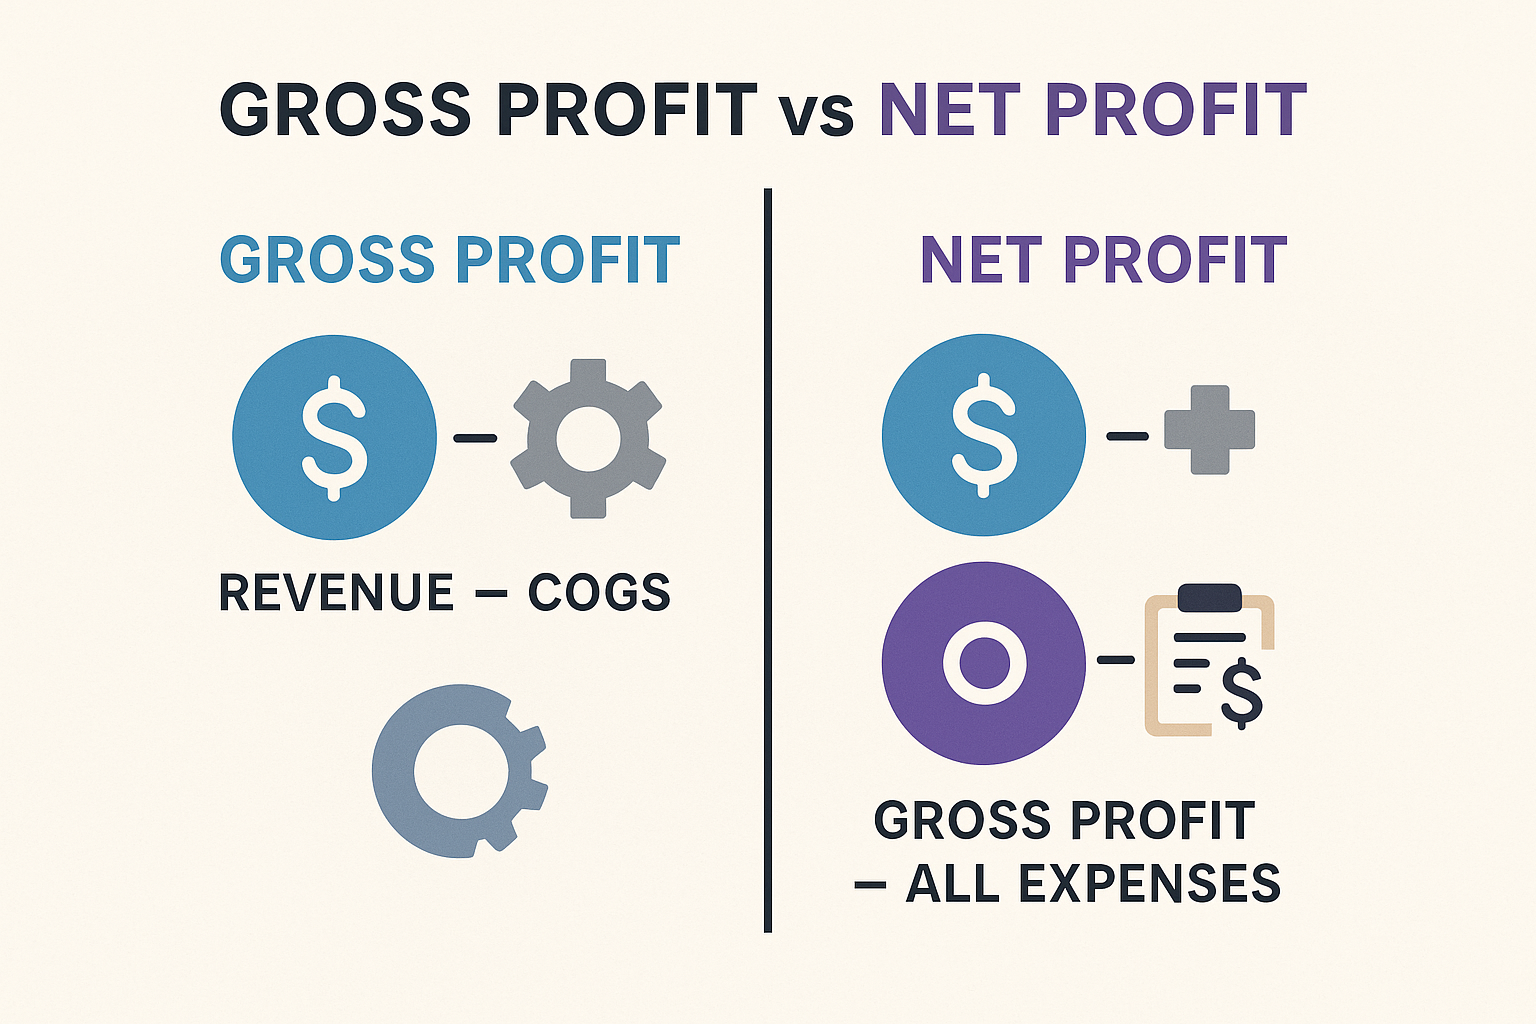
Gross Profit Margin
Gross Profit Margin = (Gross Profit ÷ Revenue) × 100
This shows what percentage of revenue remains after paying for direct production costs. Higher is better; it means the company has pricing power and efficient production.
Sarah’s Gross Profit Margin: ($8,500 ÷ $14,500) × 100 = 58.6%
Operating Profit Margin
Operating Profit Margin = (Operating Income ÷ Revenue) × 100
This reveals how efficiently the company runs its core operations. It excludes financing and tax effects, giving a clearer picture of operational performance.
Sarah’s Operating Profit Margin: ($3,500 ÷ $14,500) × 100 = 24.1%
Net Profit Margin
Net Profit Margin = (Net Income ÷ Revenue) × 100
This is the ultimate measure of profitability: how much of each dollar in revenue actually becomes profit.
Sarah’s Net Profit Margin: ($2,750 ÷ $14,500) × 100 = 19.0%
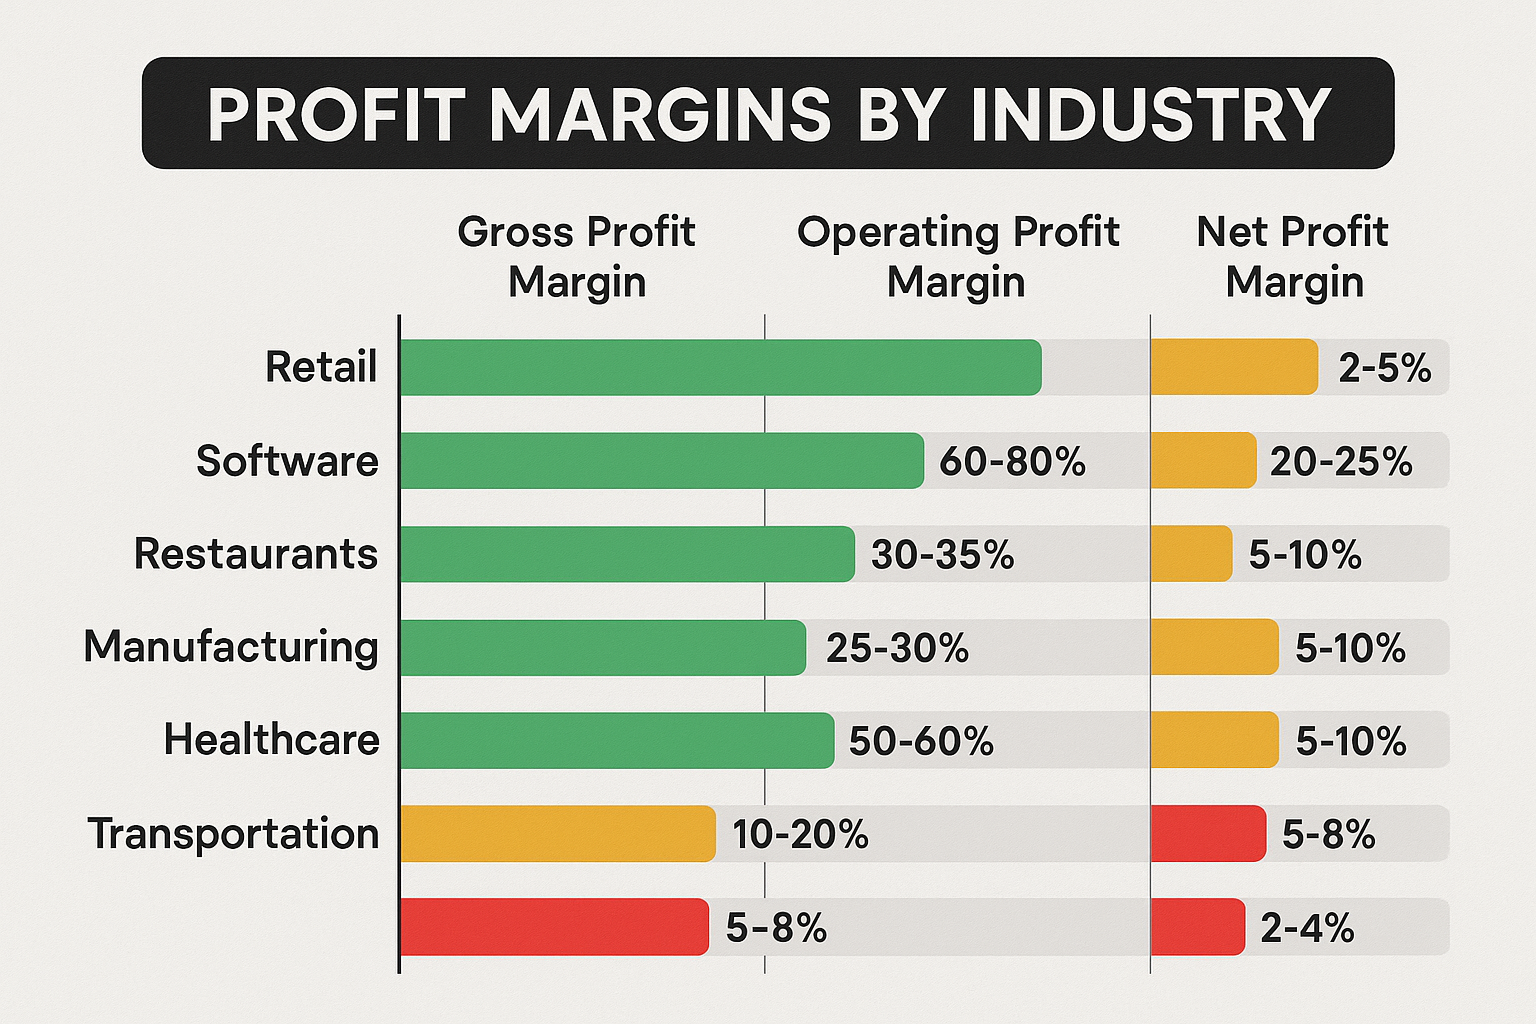
For context, net profit margins vary widely by industry:
- Retail: 2-5%
- Restaurants: 3-5%
- Software: 15-25%
- Banking: 20-30%
Sarah’s 19% margin is excellent for a small bakery!
How to Analyze a Profit and Loss Statement Like a Pro
Now that you understand the components, here’s how to actually analyze a P&L statement:
1: Look at Trends Over Time
Don’t just look at one period; compare multiple P&L statements side by side. Ask yourself:
- Is revenue growing or shrinking?
- Are expenses increasing faster than revenue?
- Is profit margin improving or declining?
Red flag: Revenue is growing, but net income is shrinking, suggesting expenses are out of control.
2: Calculate and Compare Margins
Calculate the three key margins (gross, operating, and net) and compare them to:
- Previous periods for the same company
- Industry averages
- Direct competitors
This reveals whether the company is becoming more or less efficient over time.
3: Identify Expense Patterns
Look for expenses that seem unusually high or are growing rapidly:
- Is one category consuming a disproportionate share of revenue?
- Are there opportunities to reduce costs without hurting quality?
- Are there seasonal patterns that explain fluctuations?
4: Check the Revenue Quality
Not all revenue is created equal. Ask:
- Is revenue growing because of higher prices or higher sales volume?
- Is the company offering deep discounts to boost sales?
- Are there one-time sales that won’t repeat?
5: Watch for Red Flags
Be alert for warning signs:
- Declining gross margins: Suggests pricing pressure or rising production costs
- Rising operating expenses: Could indicate inefficiency or unsustainable spending
- Inconsistent earnings: Wild swings in profit suggest instability
- Negative net income: The company is losing money
Understanding these patterns helps investors avoid losing money in the stock market by identifying troubled companies early.
Common P&L Statement Mistakes to Avoid
Even experienced business owners and investors make these errors when reading P&L statements:
Confusing Revenue with Profit
Revenue is the total money coming in; profit is what’s left after expenses. A company can have huge revenue but still lose money if expenses are too high.
Ignoring Non-Operating Items
Interest, taxes, and one-time events can significantly impact net income. Don’t overlook these when evaluating profitability.
Not Comparing to Previous Periods
A single P&L statement provides limited insight. Always compare to previous months, quarters, or years to identify trends.
Forgetting Industry Context
A 5% net profit margin might be excellent for a grocery store but terrible for a software company. Always consider industry norms.
Overlooking Cash Flow
The P&L shows profitability, but it doesn’t show cash flow. A profitable company can still run out of cash if customers pay slowly or if inventory ties up too much money.
How Investors Use P&L Statements
For investors exploring the stock market, the Profit and Loss Statement is invaluable for:
Evaluating Investment Opportunities
Before buying stock, savvy investors examine several quarters or years of P&L statements to:
- Confirm consistent profitability
- Identify growth trends
- Assess management’s ability to control costs
- Compare performance to competitors
This analysis is especially important for those interested in dividend investing, since consistent profits are essential for sustainable dividend payments.
Understanding Business Cycles
P&L statements reveal how companies perform during different market emotions and cycles. Some businesses thrive during economic expansions but struggle during recessions, while others remain stable regardless of economic conditions.
Finding High-Quality Dividend Stocks
Investors seeking high dividend stocks examine P&L statements to ensure:
- Net income consistently exceeds dividend payments
- Profit margins are stable or improving
- The company isn’t borrowing money to pay dividends
Spotting Value Opportunities
Sometimes great companies experience temporary setbacks that depress stock prices. By analyzing P&L trends, investors can distinguish between:
- Temporary problems: One-time expenses or short-term revenue dips
- Fundamental issues: Declining margins, shrinking market share, or obsolete products
This knowledge helps investors make smart moves when others are panicking.
P&L Statements for Different Business Types
The basic P&L structure remains consistent, but different businesses have unique considerations:
Service Businesses
Service companies (consultants, agencies, law firms) typically have:
- Low COGS: Mostly labor costs
- High gross margins: Often 60-80%
- Labor-intensive expenses: Salaries are the biggest operating expense
Retail Businesses
Retailers show:
- High COGS: Inventory purchases dominate
- Lower gross margins: Typically 30-50%
- Significant operating expenses: Rent, staff, utilities for physical locations
Manufacturing Companies
Manufacturers feature:
- Complex COGS: Raw materials, labor, factory overhead
- Moderate gross margins: Usually 40-60%
- Depreciation expenses: Equipment and machinery lose value over time
Software/SaaS Companies
Tech companies often have:
- Very low COGS: Mostly server and support costs
- Very high gross margins: Often 70-90%
- High R&D and marketing: Invested in growth and product development
Understanding these differences helps you set realistic expectations when analyzing P&L statements across industries. Corporate Finance Institute (CFI) – Income Statement Guide
Creating Your Own P&L Statement
If you’re a business owner or side hustler, creating a simple P&L statement is easier than you think:
1: Choose Your Time Period
Decide whether you’re tracking monthly, quarterly, or annually.
2: List All Revenue Sources
Add up all the money received from sales, services, or other income sources.
3: Calculate COGS
Total all direct costs associated with producing your products or delivering services.
4: List Operating Expenses
Document all business expenses: rent, utilities, marketing, insurance, supplies, etc.
5: Account for Other Items
Include interest income/expense, taxes, and any unusual one-time items.
6: Calculate Your Bottom Line
Subtract expenses from revenue to find your net income.
Many accounting software programs (QuickBooks, FreshBooks, Xero) automatically generate P&L statements if you consistently categorize your transactions. Even a simple spreadsheet works for small businesses or those exploring smart ways to make passive income.
Advanced P&L Analysis Techniques
Once you’ve mastered the basics, these advanced techniques provide deeper insights:
Vertical Analysis (Common-Size Analysis)
Express each line item as a percentage of revenue. This makes it easy to:
- Compare companies of different sizes
- Spot expense categories that are disproportionately large
- Track how expense ratios change over time
Example: If marketing is 15% of revenue this year but was only 10% last year, that’s worth investigating.
Horizontal Analysis (Trend Analysis)
Compare each line item to previous periods and calculate percentage changes. This highlights:
- Which categories are growing fastest
- Where costs are spiraling out of control
- Whether revenue growth is accelerating or slowing
Break-Even Analysis
Use P&L data to calculate the revenue level needed to break even (zero profit). This helps businesses understand:
- Minimum sales targets
- How much cushion exists above break-even
- The impact of price changes or cost reductions
Break-Even Revenue = Fixed Costs ÷ Gross Profit Margin
Segment Analysis
Large companies often break down P&L statements by:
- Product lines
- Geographic regions
- Business divisions
This reveals which parts of the business are profitable and which are struggling.
The Relationship Between P&L and Other Financial Statements
The Profit and Loss Statement doesn’t exist in isolation; it works together with other financial documents:
P&L vs Balance Sheet
- P&L: Shows profitability over a period (like a movie)
- Balance Sheet: Shows financial position at a point in time (like a photograph)
Together, they provide a complete financial picture. The net income from the P&L flows into the equity section of the balance sheet.
P&L vs Cash Flow Statement
- P&L: Shows profit using accrual accounting (revenue when earned, expenses when incurred)
- Cash Flow Statement: Shows actual cash moving in and out
A profitable company (per the P&L) might have cash flow problems if customers pay slowly or if inventory requires large cash investments.
Using All Three Together
Sophisticated investors and business owners analyze all three statements together to:
- Verify that profit translates to actual cash
- Ensure the company isn’t growing too fast and running out of cash
- Confirm that assets and liabilities align with profitability
This comprehensive approach is essential for anyone serious about understanding why the stock market goes up over time and profitable companies create value.
Real-Life Story: How Understanding P&L Saved a Business
Let me share a quick story about my friend Marcus, who owns a small coffee shop. For his first year in business, Marcus was thrilled; his revenue was growing every month, and customers loved his café. But when tax season arrived, his accountant delivered shocking news: despite healthy revenue, the business had barely broken even.
Confused, Marcus sat down with his P&L statements for the entire year. That’s when he discovered the problem: his COGS was an alarming 65% of revenue (industry standard for coffee shops is 25-35%). He was paying too much for coffee beans and pastries from suppliers.
Armed with this knowledge, Marcus:
- Negotiated better rates with existing suppliers
- Found alternative vendors for some products
- Adjusted his menu to feature higher-margin items
- Slightly increased prices on specialty drinks
Within six months, he’d reduced COGS to 38% and increased his net profit margin from 2% to 18%. Understanding his P&L statement literally saved his business.
This story illustrates why financial literacy matters, whether you’re running a business or making smart investment decisions.
Tools and Resources for P&L Analysis
Here are helpful resources for creating and analyzing Profit and Loss Statements:
Accounting Software
- QuickBooks: Industry standard for small businesses
- FreshBooks: User-friendly for freelancers and service providers
- Xero: Cloud-based with excellent reporting features
- Wave: Free option for very small businesses
Spreadsheet Templates
- Excel and Google Sheets offer free P&L templates
- Customize to match your specific business needs
- Great for learning before investing in software
Financial Analysis Tools
- Yahoo Finance: Free P&L data for public companies
- SEC EDGAR: Official filings for all public companies
- Morningstar: Detailed financial analysis and ratios
Educational Resources
- Investopedia: Comprehensive financial term definitions
- SEC Investor Education: Free courses on reading financial statements
- Small Business Administration (SBA): Guides for business owners
P&L Statement Calculator
Calculate your business’s profitability and key financial metrics
There’s no difference; they’re two names for the same document. “Profit and Loss Statement” and “Income Statement” both refer to the financial report that shows revenue, expenses, and net income over a specific period.
Business owners should review P&L statements monthly to catch problems early and make timely adjustments. Investors typically review quarterly and annual statements, though checking monthly can provide earlier insights into trends.
Absolutely! This happens when expenses exceed revenue. A company might generate millions in sales but still lose money if costs (production, operations, interest, taxes) are too high.
It varies dramatically by industry:
Grocery stores: 1-3%
Restaurants: 3-5%
Retail: 5-10%
Professional services: 10-20%
Software companies: 15-30%
Compare to industry benchmarks rather than using a universal standard
Not necessarily. Small business owners can create basic P&L statements using accounting software or spreadsheets. However, an accountant ensures accuracy, helps with tax optimization, and provides valuable financial advice—especially as your business grows.
While net income (the bottom line) gets the most attention, gross profit margin is arguably more important because it reveals the fundamental profitability of your core business before overhead costs. A strong gross margin provides a cushion for operating expenses and unexpected challenges.
Disclaimer
The information provided in this article is for educational purposes only and should not be considered financial, investment, or business advice. While we strive for accuracy, financial regulations and best practices change over time. Always consult with a qualified accountant, financial advisor, or tax professional before making significant business or investment decisions. Past performance does not guarantee future results, and all investments carry risk.
Conclusion: Your Next Steps to P&L Mastery
Congratulations! You’ve just learned how to read and analyze a Profit and Loss Statement, a skill that puts you ahead of most people when it comes to financial literacy. Whether you’re evaluating your own business, considering an investment, or simply want to understand how companies make money, the P&L statement is your window into financial performance.
Here’s what you should do next:
If you’re a business owner:
- ✅ Pull your last three months of P&L statements
- ✅ Calculate your gross, operating, and net profit margins
- ✅ Compare your margins to industry benchmarks
- ✅ Identify your three largest expense categories
- ✅ Create a plan to improve at least one margin by 2-5%
If you’re an investor:
- ✅ Choose a company you’re interested in
- ✅ Download their last four quarterly P&L statements (from their investor relations website or SEC.gov)
- ✅ Calculate key margins and look for trends
- ✅ Compare to their top two competitors
- ✅ Decide whether the financial trends support an investment
If you’re learning for personal growth:
- ✅ Practice reading P&L statements from different industries
- ✅ Use the interactive calculator above to experiment with different scenarios
- ✅ Follow a few public companies and review their quarterly earnings
- ✅ Consider taking a basic accounting or finance course
Remember, reading a P&L statement is like learning any new language; it feels awkward at first, but with practice, it becomes second nature. The more statements you analyze, the faster you’ll spot patterns, identify red flags, and recognize opportunities.
The journey to financial literacy starts with understanding the fundamentals, and the Profit and Loss Statement is one of the most fundamental documents in business and investing. Master this, and you’re well on your way to making smarter, more confident financial decisions.
Ready to put your new knowledge to work? Start analyzing P&L statements today, your future self (and your bank account) will thank you!
About the Author
Max Fonji is a financial educator and content strategist at TheRichGuyMath.com, where he helps beginners navigate the complex world of investing, business finance, and wealth building. With over a decade of experience in financial analysis and a passion for making complex topics accessible, Max has helped thousands of readers take control of their financial futures. When he’s not writing about finance, you can find him analyzing market trends, reading annual reports, or teaching workshops on financial literacy.
