Picture this: You’re running a lemonade stand. You spend $10 on lemons, sugar, and cups. You sell all your lemonade for $30. You just made $20, right? Well, yes, but that $20 tells a much bigger story about how healthy your business really is. That’s where gross profit margin comes in, and it’s one of the most powerful numbers any business owner or investor needs to understand.
Whether you’re evaluating a potential stock investment, running your own business, or just trying to understand how companies make money, gross profit margin is your window into a company’s financial health. It reveals whether a business is pricing its products smartly, controlling its costs effectively, and building a sustainable competitive advantage.
In this comprehensive guide, we’ll break down everything you need to know about gross profit margin, from the basic formula to industry benchmarks and real-world examples that’ll make this concept stick. According to Investopedia’s guide to gross profit margin, it measures how efficiently a company produces goods relative to its revenue.
Key Takeaways
- Gross profit margin measures how much money a company keeps from sales after paying for the direct costs of making its products or services
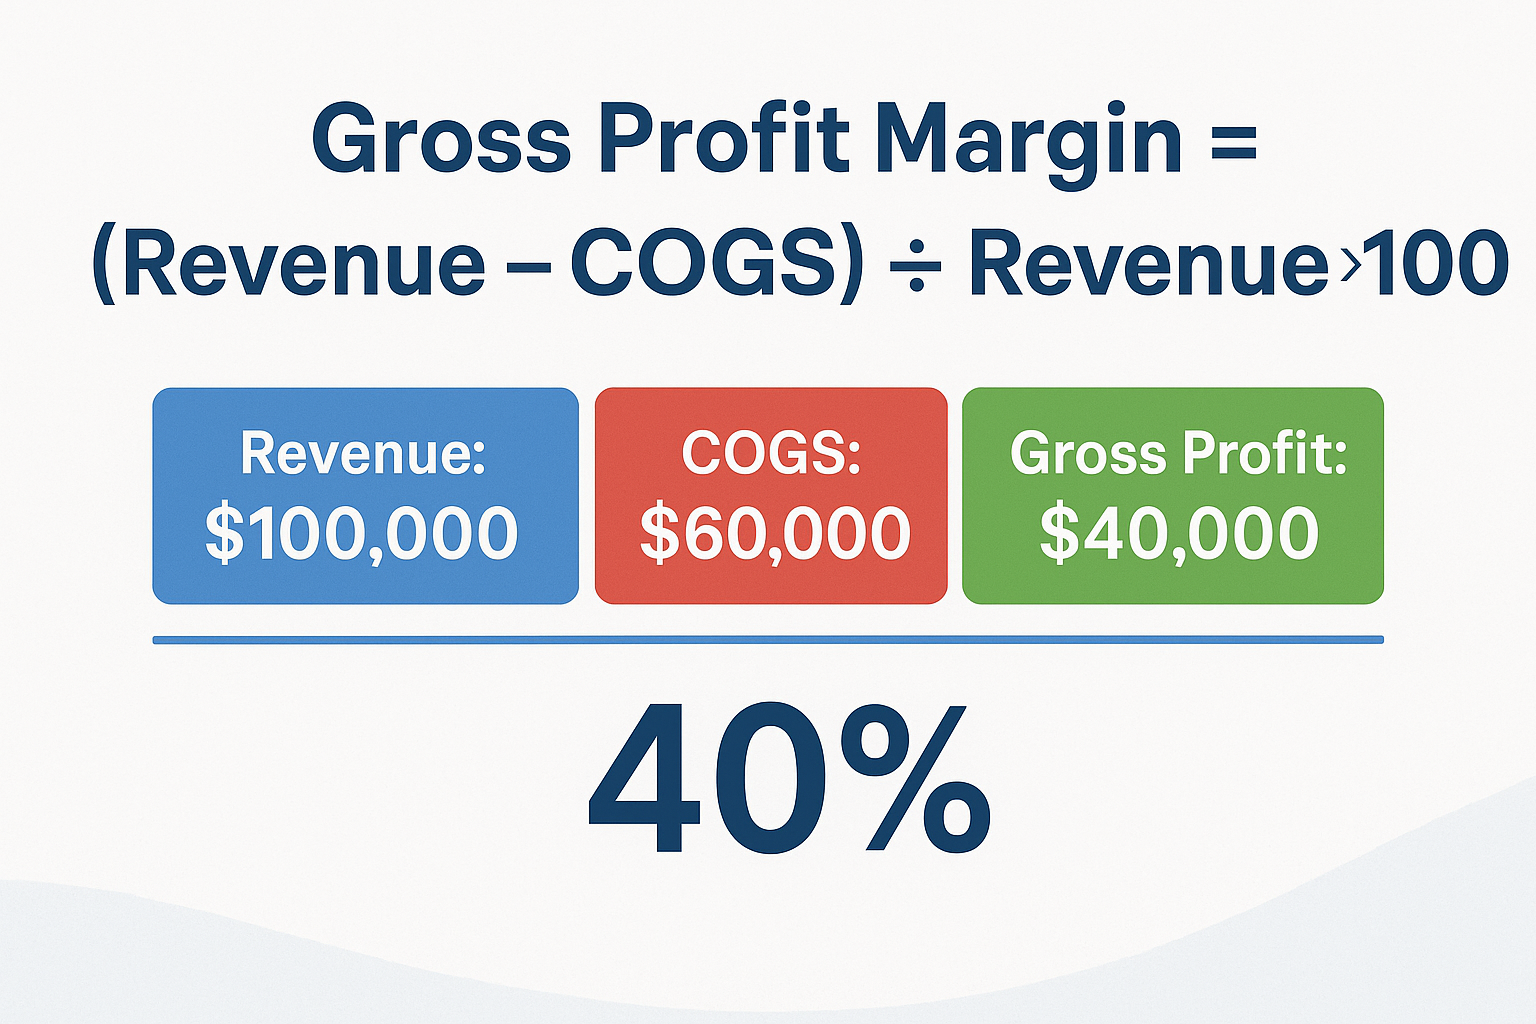
- The formula is simple: (Revenue – Cost of Goods Sold) ÷ Revenue × 100
- A higher gross profit margin typically indicates better pricing power, operational efficiency, and competitive positioning
- Industry benchmarks vary widely; software companies often exceed 80%, while grocery stores may operate at 20-30%
- Understanding gross profit margin is essential for making smart investment decisions and evaluating business health
What Is Gross Profit Margin?
Gross profit margin is a financial metric that shows what percentage of revenue a company keeps after paying for the direct costs of producing its goods or services. Think of it as the “first layer” of profitability, before accounting for operating expenses, taxes, interest, and other costs.
In everyday terms, gross profit margin answers this question: “For every dollar of sales, how many cents does the company keep to cover everything else?”
Let’s go back to that lemonade stand. If you sold $30 worth of lemonade and spent $10 on ingredients and cups, your gross profit is $20. Your gross profit margin is 66.7% ($20 ÷ $30 × 100). This means for every dollar you earned, you kept about 67 cents after paying for your direct costs.
Why “Gross” Matters
The word “gross” means you’re only looking at direct production costs, not rent, marketing, salaries for managers, or any other overhead expenses. That’s what makes this metric so valuable: it isolates how efficiently a company produces and prices its core products.
The Gross Profit Margin Formula (Step-by-Step)
Let’s break down the formula into bite-sized pieces:
Basic Formula
Gross Profit Margin = (Gross Profit ÷ Revenue) × 100Or, expanded:
Gross Profit Margin = ((Revenue - Cost of Goods Sold) ÷ Revenue) × 100Understanding Each Component
1. Revenue (Sales)
This is the total money coming in from selling products or services. Also called “top line” or “gross revenue.”
2. Cost of Goods Sold (COGS)
These are the direct costs of producing what you sell:
- Raw materials
- Manufacturing labor
- Packaging
- Shipping costs are directly tied to production
- Factory overhead
3. Gross Profit
Simply: Revenue minus COGS
Real-World Example: Apple Inc.
Let’s use actual numbers from a major company. In 2024, Apple reported:
- Revenue: $383.3 billion
- Cost of Goods Sold: $214.1 billion
- Gross Profit: $169.2 billion
Calculation:
Gross Profit Margin = ($169.2B ÷ $383.3B) × 100 = 44.1%This means Apple keeps about 44 cents of every dollar in sales after paying for manufacturing, components, and direct production costs. That’s a healthy margin that gives Apple plenty of room to invest in research, marketing, retail stores, and still generate substantial profit.
The Corporate Finance Institute (CFI) breaks down how to calculate gross profit margin with real-world examples and financial insights.
Why Gross Profit Margin Matters
Understanding gross profit margin isn’t just for accountants; it’s critical for anyone who wants to understand how businesses and the stock market work.
1. Pricing Power Indicator
Companies with high gross profit margins can charge premium prices. Think luxury brands, innovative tech products, or patented pharmaceuticals. They’ve created enough value or differentiation that customers will pay more.
2. Operational Efficiency Gauge
A rising gross profit margin often signals improving efficiency, better supplier negotiations, streamlined production, or economies of scale kicking in.
3. Competitive Moat Assessment
Consistently high margins suggest a company has built competitive advantages that protect it from price wars. When evaluating potential dividend stocks, strong margins often indicate sustainable payouts.
4. Early Warning System
Declining margins can signal trouble: increased competition, rising material costs, or pricing pressure. Catching this early helps investors avoid losses, a key lesson in why people lose money in the stock market.
5. Business Model Clarity
Different business models naturally have different margins. Understanding this helps you compare apples to apples (or tech companies to tech companies).
Industry Benchmarks: What’s “Good” Varies Wildly
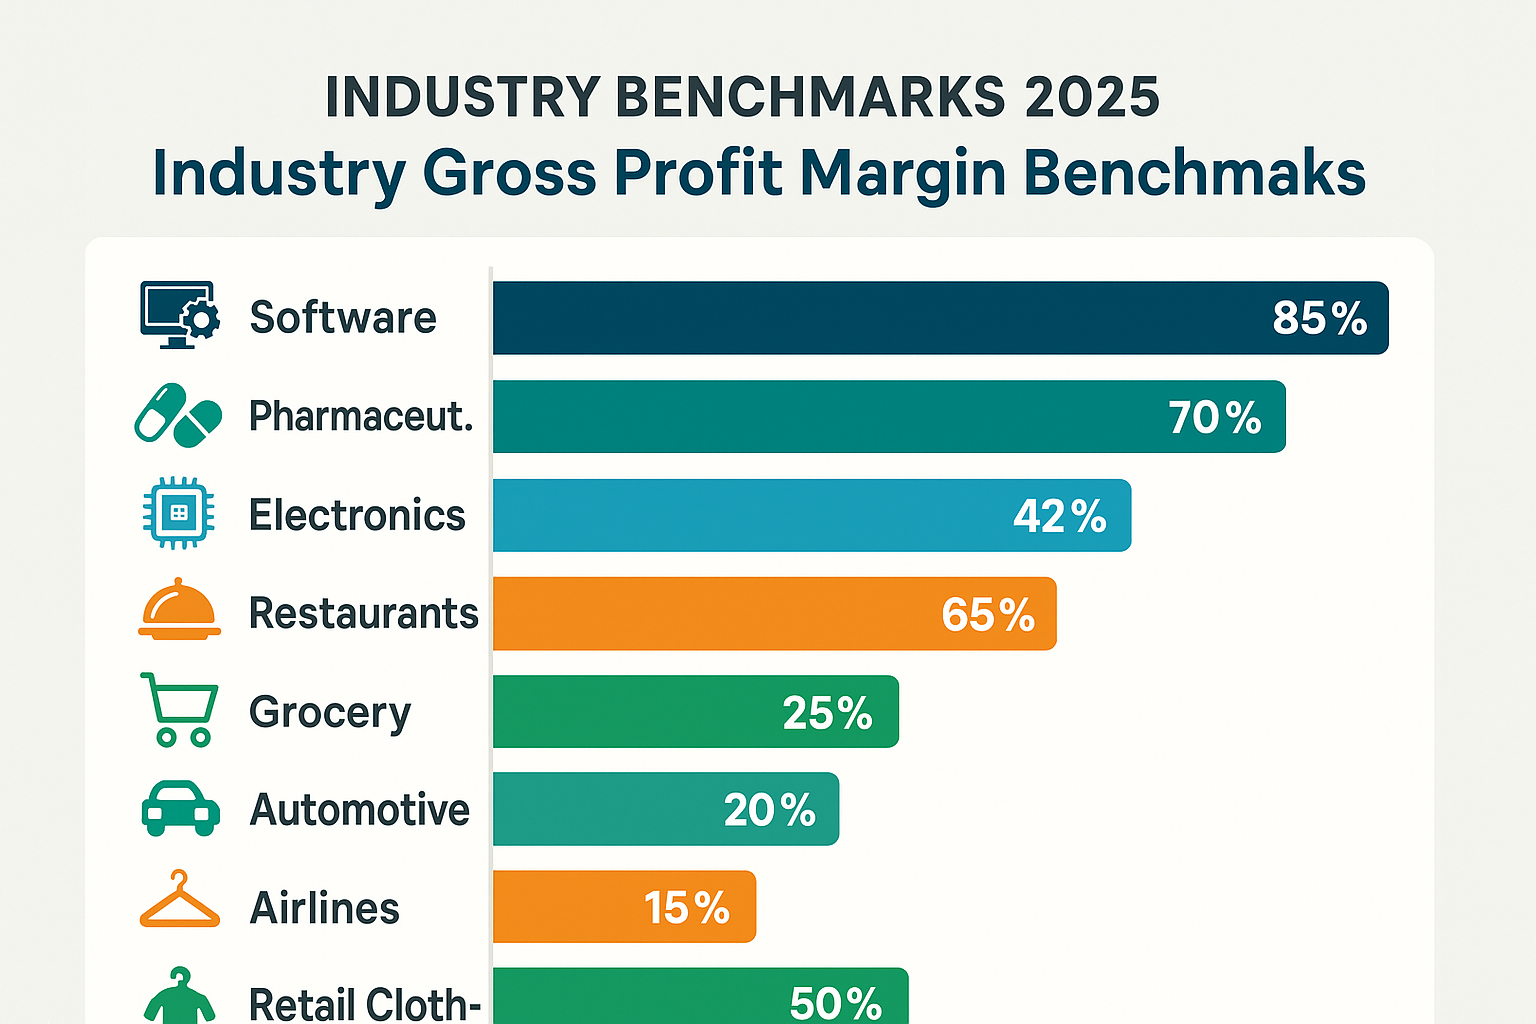
Here’s where things get interesting: a 20% gross profit margin might be excellent in one industry and terrible in another.
Gross Profit Margin by Industry (2025 Benchmarks)
| Industry | Typical Gross Profit Margin | Key Factors |
|---|---|---|
| Software (SaaS) | 75-90% | Low marginal costs, digital delivery |
| Pharmaceuticals | 60-80% | Patent protection, high R&D costs elsewhere |
| Electronics Manufacturing | 35-50% | Component costs, assembly labor |
| Restaurants | 60-70% | Food costs ~30%, but high operating expenses |
| Grocery Stores | 20-30% | High volume, low margins, intense competition |
| Automotive | 15-25% | Expensive materials, manufacturing complexity |
| Airlines | 10-20% | Fuel costs, maintenance, price competition |
| Construction | 15-25% | Fuel costs, maintenance, and price competition |
| Retail Clothing | 40-60% | Markup varies by brand positioning |
| Consulting Services | 40-60% | Labor costs, expertise premium |
You can view official company filings on the SEC’s EDGAR database to compare gross profit margins across industries
The Software Advantage
Notice how software companies dominate? Once you’ve built the software, delivering it to one customer or one million costs nearly the same. This creates incredible gross profit margins and is why tech companies often make attractive long-term investments.
The Grocery Store Challenge
Grocery stores operate on razor-thin margins because they’re selling commodities in a highly competitive market. They make money through volume, inventory turnover, and operational efficiency, not high margins per item.
How to Calculate Gross Profit Margin
Let’s walk through a practical example with a fictional company called “BrightGadgets Inc.”
BrightGadgets Financial Data (Q1 2025):
- Total Sales Revenue: $500,000
- Cost of raw materials: $150,000
- Manufacturing labor: $80,000
- Packaging and shipping: $20,000
Step 1: Calculate COGS
COGS = $150,000 + $80,000 + $20,000 = $250,000Step 2: Calculate Gross Profit
Gross Profit = $500,000 - $250,000 = $250,000Step 3: Calculate Gross Profit Margin
Gross Profit Margin = ($250,000 ÷ $500,000) × 100 = 50%Interpretation: BrightGadgets keeps 50 cents of every sales dollar after covering direct production costs. This is solid for an electronics manufacturer and suggests good pricing power and efficient production.
💰 Gross Profit Margin Calculator
Gross Profit Margin vs Other Profit Margins
It’s easy to confuse gross profit margin with other profitability metrics. Let’s clear that up:
The Profit Margin Family Tree
1. Gross Profit Margin (What we’re discussing)
- Formula: (Revenue – COGS) ÷ Revenue × 100
- What it shows: Production efficiency and pricing power
- Excludes: Operating expenses, taxes, interest
2. Operating Profit Margin
- Formula: Operating Income ÷ Revenue × 100
- What it shows: Profitability after operating expenses (salaries, rent, marketing)
- Excludes: Interest and taxes
3. Net Profit Margin
- Formula: Net Income ÷ Revenue × 100
- What it shows: Bottom-line profitability after ALL expenses
- The “final” profit number
Why Look at All Three?
Each margin tells a different part of the story:
- Gross margin reveals production efficiency
- Operating margin shows operational management
- Net margin displays overall profitability
A company might have great gross margins but terrible net margins due to excessive overhead, a red flag for investors looking for smart investment opportunities.
How to Improve Gross Profit Margin
Whether you’re running a business or evaluating one as an investor, here are the levers that move gross profit margin:
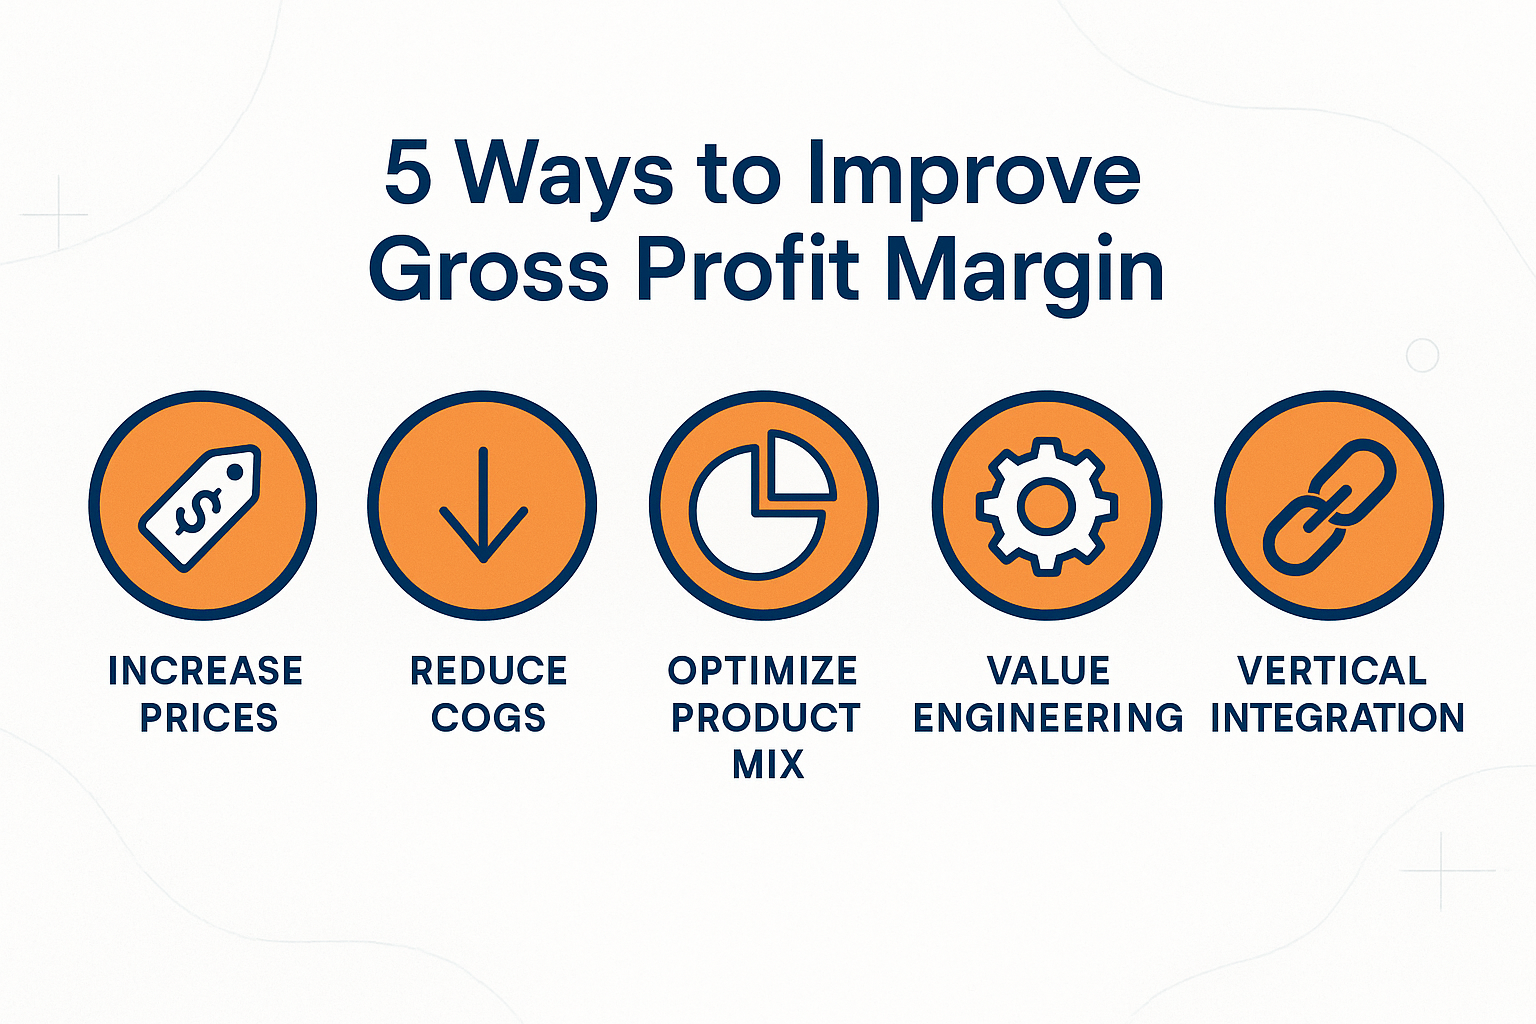
1: Increase Prices
The approach: Raise prices without proportionally increasing costs.
When it works:
- Strong brand loyalty
- Unique value proposition
- Limited competition
- Inelastic demand (customers need your product regardless of price)
Real example: Apple consistently maintains premium pricing because customers value design, ecosystem integration, and brand prestige.
2: Reduce COGS
The approach: Lower production costs while maintaining quality and revenue.
Tactics:
- Negotiate better supplier contracts
- Improve manufacturing efficiency
- Reduce waste and defects
- Automate production processes
- Achieve economies of scale
Real example: Tesla’s “Gigafactories” achieve massive economies of scale, dramatically reducing per-unit production costs as volume increases.
3: Product Mix Optimization
The approach: Shift sales toward higher-margin products or services.
How it works:
- Promote premium offerings
- Bundle high-margin items with popular products
- Phase out low-margin products
- Upsell and cross-sell strategically
Real example: Amazon promotes its high-margin AWS cloud services and Prime memberships while using lower-margin retail to drive traffic.
4: Value Engineering
The approach: Redesign products to reduce costs without sacrificing customer value.
Examples:
- Simplify product design
- Use alternative materials
- Reduce packaging costs
- Streamline features to essentials
5: Vertical Integration
The approach: Control more of the supply chain to capture margins that would otherwise go to suppliers.
Real example: Netflix transitioned from licensing content to producing original content, improving margins by eliminating licensing fees to studios.
Reading Gross Profit Margin in Financial Statements
When you’re researching companies for stock market investments, you’ll find gross profit margin information in two key places:
The Income Statement
Look for these line items (typically at the top):
- Revenue or Net Sales
- Cost of Goods Sold or Cost of Revenue
- Gross Profit (sometimes calculated for you)
The margin is typically calculated as: Gross Profit ÷ Revenue × 100
Company Investor Relations
Most public companies report gross profit margin in:
- Quarterly earnings reports
- Annual reports (10-K filings)
- Investor presentations
- Earnings call transcripts
Pro tip: Look at gross margin trends over multiple quarters and years. A single quarter tells you less than the trajectory.
Warning Signs: When Gross Margins Tell You to Worry
Declining gross profit margins can signal serious problems. Here’s what to watch for:
1: Consistent Decline
If gross margins are trending down quarter after quarter, investigate:
- Increased competition is forcing price cuts
- Rising raw material costs
- Loss of pricing power
- Operational inefficiencies
2: Below Industry Average
A company with margins significantly below its competitors may be:
- Operating inefficiently
- Unable to differentiate its products
- Facing structural disadvantages
- Engaging in unsustainable price competition
3: Volatile Margins
Wild swings in gross margin suggest:
- Unstable business model
- Commodity-based pricing
- Poor cost controls
- Seasonal issues are not being managed well
4: Margin Compression Despite Revenue Growth
Growing sales but shrinking margins often means:
- Winning business through discounting (unsustainable)
- Costs rising faster than prices
- Product mix shifting to lower-margin items
These warning signs are crucial when evaluating why some investors lose money; they often ignore deteriorating fundamentals like margin compression.
Real-World Case Study: The Tale of Two Retailers
Let me share a story that illustrates why gross profit margin matters so much.
Company A: Premium Athletic Wear
In 2020, this company reported:
- Revenue: $4.4 billion
- COGS: $2.0 billion
- Gross Profit Margin: 54.5%
Company B: Discount Athletic Wear
Same year, similar industry:
- Revenue: $4.6 billion
- COGS: $3.5 billion
- Gross Profit Margin: 23.9%
What Happened Next?
When the pandemic hit and costs surged (shipping, materials, labor), Company A had a 54.5% cushion to absorb shocks. They could:
- Maintain quality
- Invest in e-commerce
- Weather temporary store closures
- Keep employees
Company B, with only a 23.9% margin, had no room to maneuver. They:
- Cut quality to maintain prices
- Laid off staff
- Delayed store improvements
- Struggled with inventory issues
By 2023, Company A’s stock had doubled. Company B filed for bankruptcy protection.
The lesson? Gross profit margin isn’t just a number; it’s a company’s financial shock absorber and competitive moat.
Gross Profit Margin for Investors: What to Look For
If you’re building a portfolio or learning about passive income through dividend investing, here’s how to use gross profit margin:
Investment Screening Criteria
Look for:
- Margins at or above the industry average
- Stable or improving margins over 3-5 years
- Margins that held up during economic downturns
- Companies with pricing power (can raise prices without losing customers)
Avoid:
- Consistently declining margins
- Margins well below industry peers
- Companies in “race to the bottom” price wars
- Businesses with no clear path to margin improvement
Sector Considerations
Remember to compare within sectors:
- Don’t compare a software company (80% margins) to a grocery chain (25% margins)
- Do compare Costco to Walmart, or Microsoft to Salesforce
The Quality Indicator
High gross profit margins often correlate with:
- Strong brands
- Proprietary technology
- Network effects
- High switching costs
- Regulatory advantages
These are exactly the characteristics that help explain why the stock market goes up over time: quality companies compound value.
Common Mistakes When Analyzing Gross Profit Margin
Even experienced analysts make these errors:
1: Ignoring Industry Context
The error: Thinking 30% is always “bad”
The reality: 30% is excellent for a grocery store, terrible for software
2: Focusing Only on the Number
The error: Looking at the margin in isolation
The reality: Trends, comparisons, and context matter more than absolute numbers
3: Forgetting About Business Models
The error: Comparing asset-light businesses to capital-intensive ones
The reality: Different models naturally have different margin structures
4: Overlooking Accounting Differences
The error: Assuming all companies calculate COGS identically
The reality: Accounting methods can vary, especially internationally
5: Chasing High Margins Blindly
The error: Only investing in high-margin businesses
The reality: Sometimes low-margin, high-volume businesses create tremendous value (think Amazon retail)
Beyond the Basics: Advanced Gross Margin Analysis
Once you’re comfortable with the fundamentals, consider these advanced perspectives:
Gross Margin Dollars vs Percentage
Sometimes, absolute gross profit matters more than percentage. A company with:
- 20% margin on $10 billion sales = $2 billion gross profit
- 60% margin on $500 million sales = $300 million gross profit
The first company has more dollars to invest in growth, even with lower margins.
Contribution Margin
This takes gross margin further by analyzing profitability at the product or customer level. Which products/customers contribute most to covering fixed costs?
Gross Margin Return on Investment (GMROI)
For retailers: Gross Margin ÷ Average Inventory Cost
This shows how efficiently inventory generates gross profit, crucial for understanding working capital efficiency.
It depends entirely on the industry. Software companies should exceed 70%, while grocery stores operate successfully at 20-25%. Compare companies within the same sector.
Yes, if COGS exceeds revenue. This is unsustainable and indicates serious pricing or cost problems.
For investors, quarterly earnings are released. For business owners, monthly or even weekly for key product lines.
Generally, yes, but not always. Some businesses succeed with low margins and high volume. Context matters.
Markup is profit as a percentage of cost. Margin is profit as a percentage of the selling price. A 50% markup equals about a 33% margin
Taking Action: Your Next Steps
Understanding gross profit margin is just the beginning. Here’s how to put this knowledge to work:
For Investors
- Screen your portfolio: Calculate gross margins for your holdings
- Compare to competitors: Are your company industry leaders or laggards?
- Track trends: Set up alerts for quarterly earnings and monitor margin changes
- Diversify wisely: Include companies with different margin profiles for balance
- Consider learning more about why you should invest in building long-term wealth
For Business Owners
- Calculate monthly: Track gross margin by product, service, or customer segment
- Set benchmarks: Research industry standards and set improvement targets
- Identify levers: Which strategy (pricing, costs, mix) offers the best opportunity?
- Test and measure: Make small changes and track the impact on margins
- Review regularly: Make gross margin a standing agenda item in business reviews
For Career Professionals
- Understand your employer: Know your company’s margins and how your role affects them
- Speak the language: Using financial metrics makes you more valuable
- Identify opportunities: Suggest improvements that could boost margins
- Build expertise: Financial literacy accelerates career advancement
Conclusion
Gross profit margin is one of the most revealing numbers in all of business and investing. It cuts through the noise and tells you whether a company can make money on its core products before accounting for anything else.
From that lemonade stand to Apple’s billion-dollar empire, the principle remains the same: you need to keep enough from each sale to cover your other costs and still make a profit.
The companies with consistently high gross profit margins and the wisdom to maintain them tend to be the ones that create lasting value for shareholders. They have pricing power, operational efficiency, and competitive advantages that protect them when times get tough.
Whether you’re evaluating stocks for your portfolio, running your own business, or simply trying to understand how companies really make money, gross profit margin gives you a clear, quantifiable window into business health.
Remember: it’s not just about the number itself, but the trend, the industry context, and the story behind the margin. A rising gross profit margin suggests a company is gaining strength. A falling one often signals trouble ahead, sometimes before it shows up anywhere else.
Start looking at gross profit margins in the companies you interact with every day. You’ll begin to see patterns, understand competitive dynamics, and make smarter decisions with your money.
The best investors don’t just look at prices; they understand the fundamentals that drive long-term value. And gross profit margin is one of the most fundamental metrics of all.
Understanding financial concepts like gross profit margin is essential for navigating the cycle of market emotions and making rational, informed decisions rather than emotional ones.
Disclaimer
This article is for educational and informational purposes only and should not be construed as financial, investment, tax, or legal advice. The information provided is based on general market knowledge and publicly available data as of 2025. Financial metrics, industry benchmarks, and company examples are subject to change. Always conduct your own research or consult with a qualified financial advisor before making investment decisions. Past performance does not guarantee future results. The author and publisher are not responsible for any financial decisions made based on the content of this article.
About the Author
Max Fonji is a financial educator and content strategist with over a decade of experience simplifying complex financial concepts for everyday investors. With a background in corporate finance and a passion for financial literacy, Max has helped thousands of readers understand the fundamentals of investing, business analysis, and wealth building. When not writing about finance, Max enjoys analyzing market trends, reading annual reports for fun (yes, really), and teaching personal finance workshops. Connect with Max and explore more beginner-friendly financial guides at TheRichGuyMath.com.

