Picture this: You’re sitting at your favorite coffee shop in 2025, scrolling through your investment account on your phone. Your portfolio shows a healthy 8% return for the year, and you’re feeling pretty good about yourself. You treat yourself to an extra pastry to celebrate. But here’s the kicker, that same pastry now costs $4.50 instead of the $3.50 it cost last year. Your coffee went from $4 to $5. Gas is up. Groceries are up. Everything’s more expensive.
Suddenly, that 8% return doesn’t feel quite as impressive, does it?
Welcome to the world of nominal vs real return, one of the most misunderstood concepts in investing, yet one of the most critical for building actual wealth. Understanding this difference isn’t just financial trivia; it’s the key to knowing whether you’re actually getting richer or just watching numbers go up while your purchasing power stays flat (or worse, declines). Investopedia
Key Takeaways
Essential Points to Remember:
- Nominal return is the percentage gain you see in your account; it doesn’t account for inflation
- Real return is what you actually earn after adjusting for inflation. This is your true wealth growth
- A 7% nominal return with 3% inflation equals only a 4% real return
- Ignoring real returns can lead to poor investment decisions and retirement planning mistakes
- Understanding this distinction helps you choose investments that actually preserve and grow purchasing power
What Is Nominal Return?
Let’s start with the simpler concept: nominal return.
Nominal return is the raw percentage change in your investment’s value over a specific period. It’s the number you see when you log into your brokerage account or check your mutual fund statement. Simple, straightforward, and completely surface-level.
How Nominal Return Works
If you invest $10,000 in a stock and it grows to $10,700 in one year, your nominal return is 7%. The math is elementary:
Nominal Return = [(Ending Value – Beginning Value) / Beginning Value] × 100
($10,700 – $10,000) / $10,000 × 100 = 7%
This is the figure that financial news channels love to trumpet, that fund managers advertise in bold letters, and that makes investors feel accomplished. But here’s the uncomfortable truth: nominal returns tell you almost nothing about whether you’re actually building wealth.
Why Nominal Returns Are Misleading
Imagine it’s 1980, and you earn a 12% return on your investments. Sounds fantastic, right? Now imagine it’s 2025, and you earn that same 12% return. In 1980, with inflation running at 13.5%, your real purchasing power actually decreased despite that double-digit gain. In 2025, with inflation around 2-3%, that same 12% return represents genuine wealth creation.
Same number, completely different outcomes.
This is why savvy investors, the ones who actually build lasting wealth, focus on something deeper: real return.
What Is Real Return?
Real return is where the rubber meets the road. It’s your investment return after accounting for inflation, the true measure of whether your wealth is growing, stagnant, or shrinking.
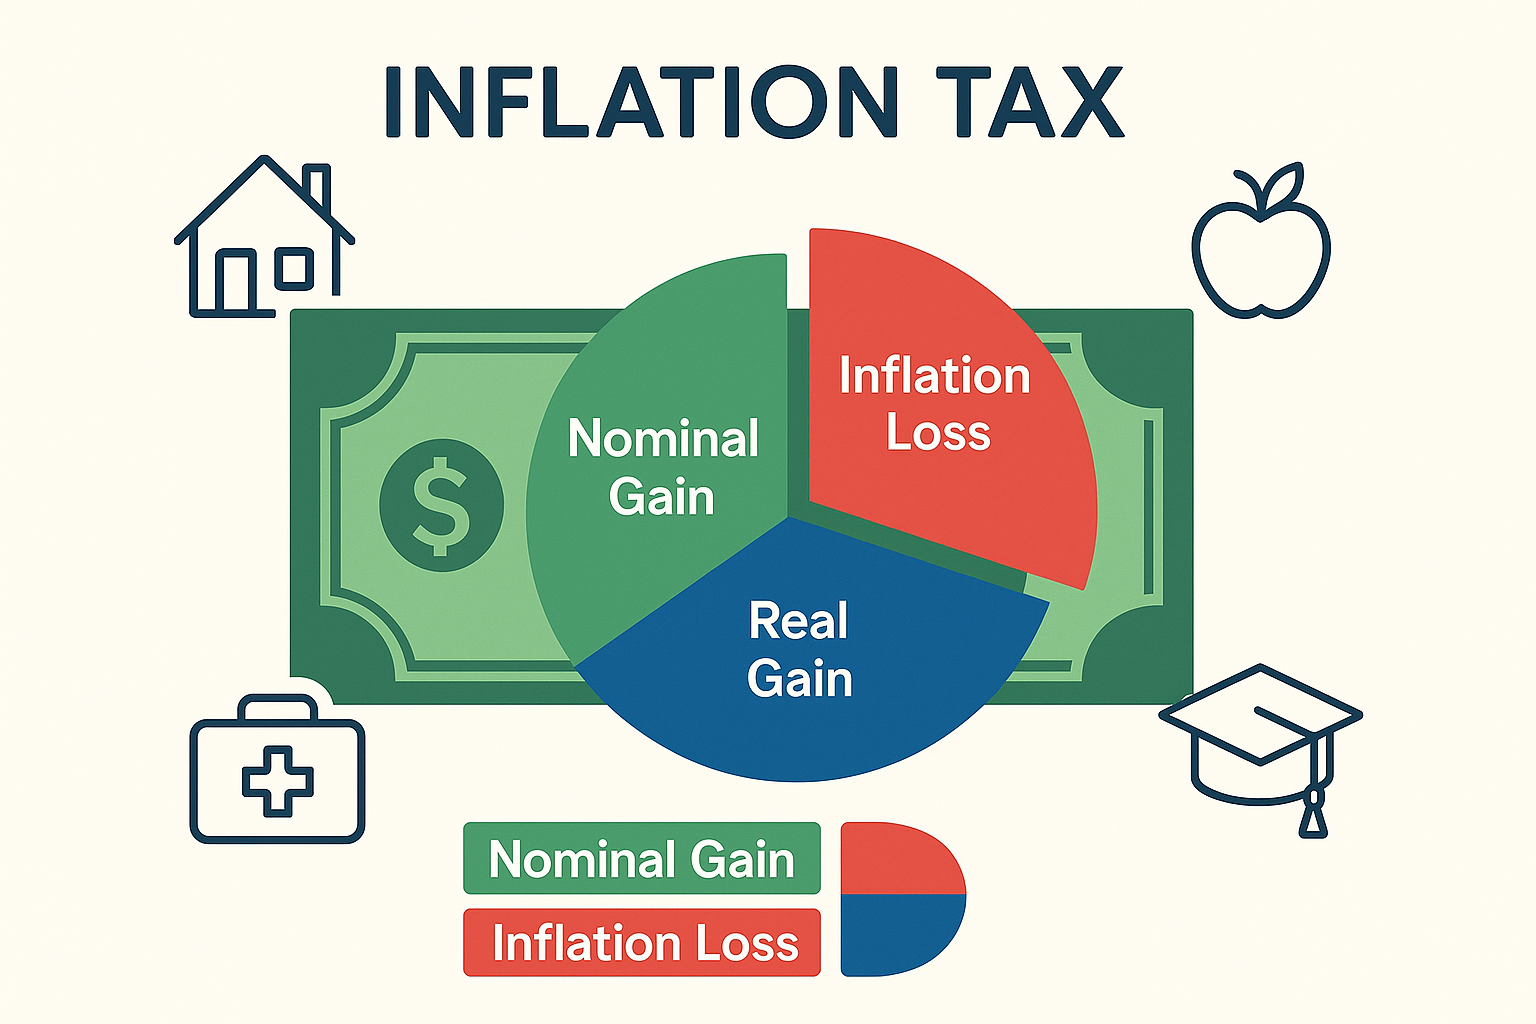
Think of inflation as an invisible tax on your money. Every year, the purchasing power of each dollar you own decreases as prices rise. Real return tells you how much your investment has grown after paying this “inflation tax.” investor.gov
The Real Return Formula
The precise formula for calculating real return is:
Real Return = [(1 + Nominal Return) / (1 + Inflation Rate)] – 1
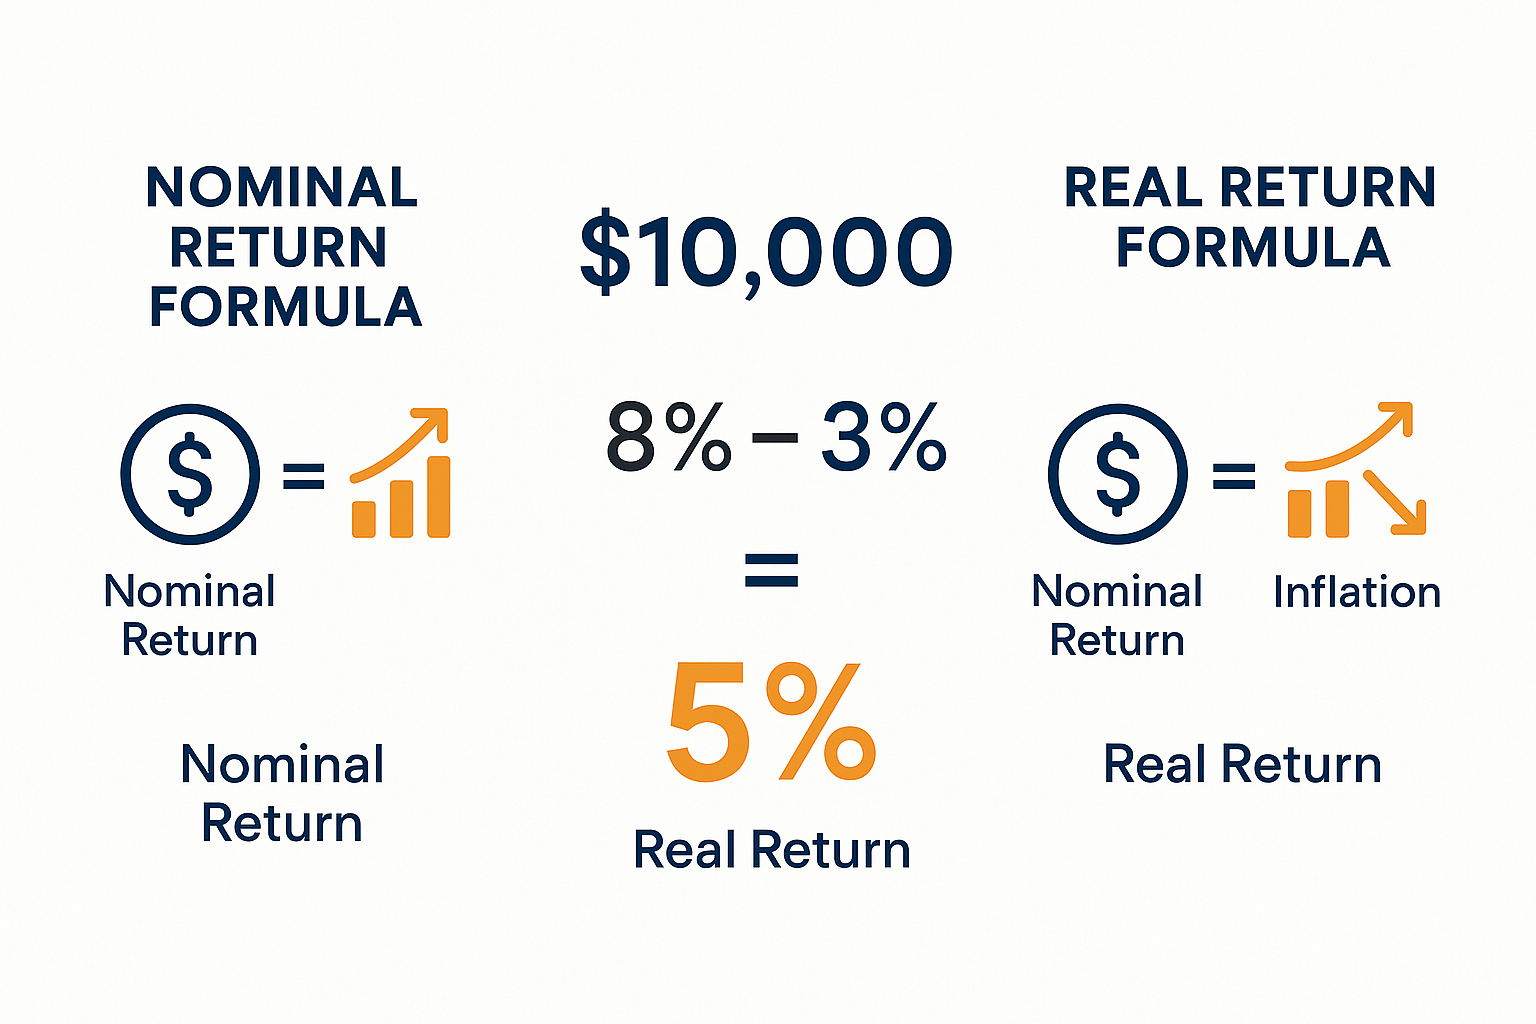
For example, if your investment earned 8% (nominal) and inflation was 3%:
Real Return = [(1.08) / (1.03)] – 1 = 0.0485 or 4.85%
For quick estimates, many investors use the simplified version:
Real Return ≈ Nominal Return – Inflation Rate
Using our example: 8% – 3% = 5% (close enough for planning purposes)
Why Real Return Matters More Than You Think
Here’s a story that drives this home:
In 2021, Sarah invested $50,000 in a bond fund that promised, and delivered, a 4% return. She was thrilled to earn $2,000. Meanwhile, her friend Marcus put the same amount into a diversified stock portfolio that returned 9%.
Sarah felt smart choosing the “safe” option. But that year, inflation hit 7%.
Sarah’s real return: 4% – 7% = -3% (she actually lost purchasing power)
Marcus’s real return: 9% – 7% = 2% (modest, but at least he grew his wealth)
Sarah’s $50,000 could now buy what would have cost $48,500 the year before. Marcus’s $50,000 could buy what would have cost $51,000. Same starting point, vastly different outcomes, all because of understanding real vs nominal returns.
Nominal vs Real Return: A Side-by-Side Comparison
Let’s break down the key differences in a way that’s crystal clear:
| Aspect | Nominal Return | Real Return |
|---|---|---|
| Definition | Raw percentage gain/loss | Return adjusted for inflation |
| What it shows | Account balance changes | Actual purchasing power changes |
| Includes inflation? | No | Yes |
| Better for planning? | Short-term tracking | Long-term wealth building |
| Example (8% return, 3% inflation) | 8% | ~5% |
| Can it be negative when the nominal is positive? | No | Yes (if inflation exceeds nominal return) |
Why This Distinction Destroys (or Builds) Wealth
Understanding nominal vs real return isn’t academic; it has profound practical implications for every financial decision you make.
Retirement Planning Disasters
The most common mistake? Planning retirement based on nominal returns.
Let’s say you’re 35 years old with $100,000 saved, and you assume an 8% annual return (a reasonable historical average for stocks). You plan to retire at 65 with this nest egg.
Using nominal returns: $100,000 growing at 8% for 30 years = $1,006,266
Sounds like a millionaire retirement, right? Not so fast.
Using real returns (assuming 3% inflation): $100,000 growing at 5% real return for 30 years = $432,194
That’s less than half! And here’s the kicker: that $432,194 represents purchasing power in today’s dollars. Your actual account might show over a million, but it’ll only buy what $432,194 buys today.
Many retirees discover this harsh reality too late, wondering why their “million-dollar portfolio” doesn’t provide the lifestyle they expected. Understanding how to make your kid a millionaire requires this same real-return thinking.
Investment Selection Mistakes
Bonds vs. stocks is a perfect example.
In 2025, if a government bond yields 4.5% and inflation is running at 3.5%, your real return is roughly 1%. Meanwhile, stocks might offer 7% nominal returns (4% real return after inflation).
Many conservative investors flock to bonds because they “feel safer,” but they’re unknowingly choosing investments that barely keep pace with inflation. Over decades, this seemingly small difference compounds into hundreds of thousands of dollars in lost wealth.
This is why understanding the stock market and its long-term real returns is crucial for wealth building.
The Cash Trap
Here’s the most painful example: keeping money in a savings account.
In 2025, many high-yield savings accounts offer around 4-4.5% interest. Sounds decent, right? But with inflation at 2.5-3%, your real return is only 1.5-2%.
For money you need in the short term, that’s fine. But for long-term savings? You’re barely treading water. A decade of “safe” savings account returns might preserve your nominal dollars while your purchasing power slowly evaporates.
How Inflation Eats Your Returns
Inflation is like termites in your financial foundation, invisible, constant, and destructive over time.
The Compounding Effect of Inflation
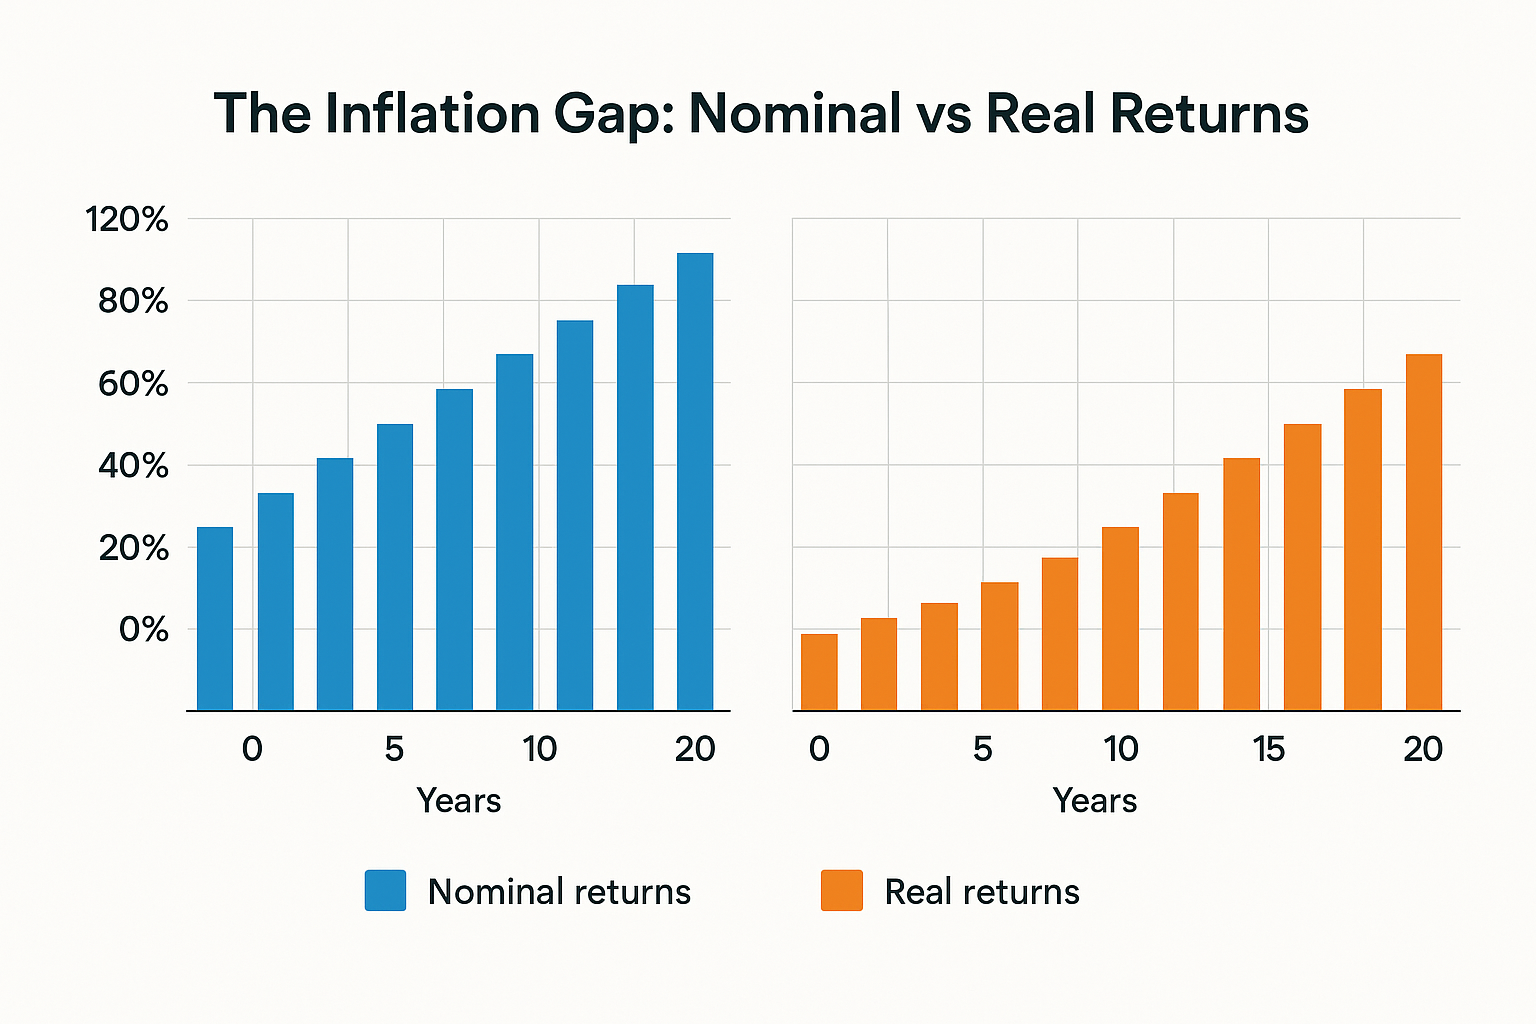
Here’s what many investors miss: inflation compounds just like returns do.
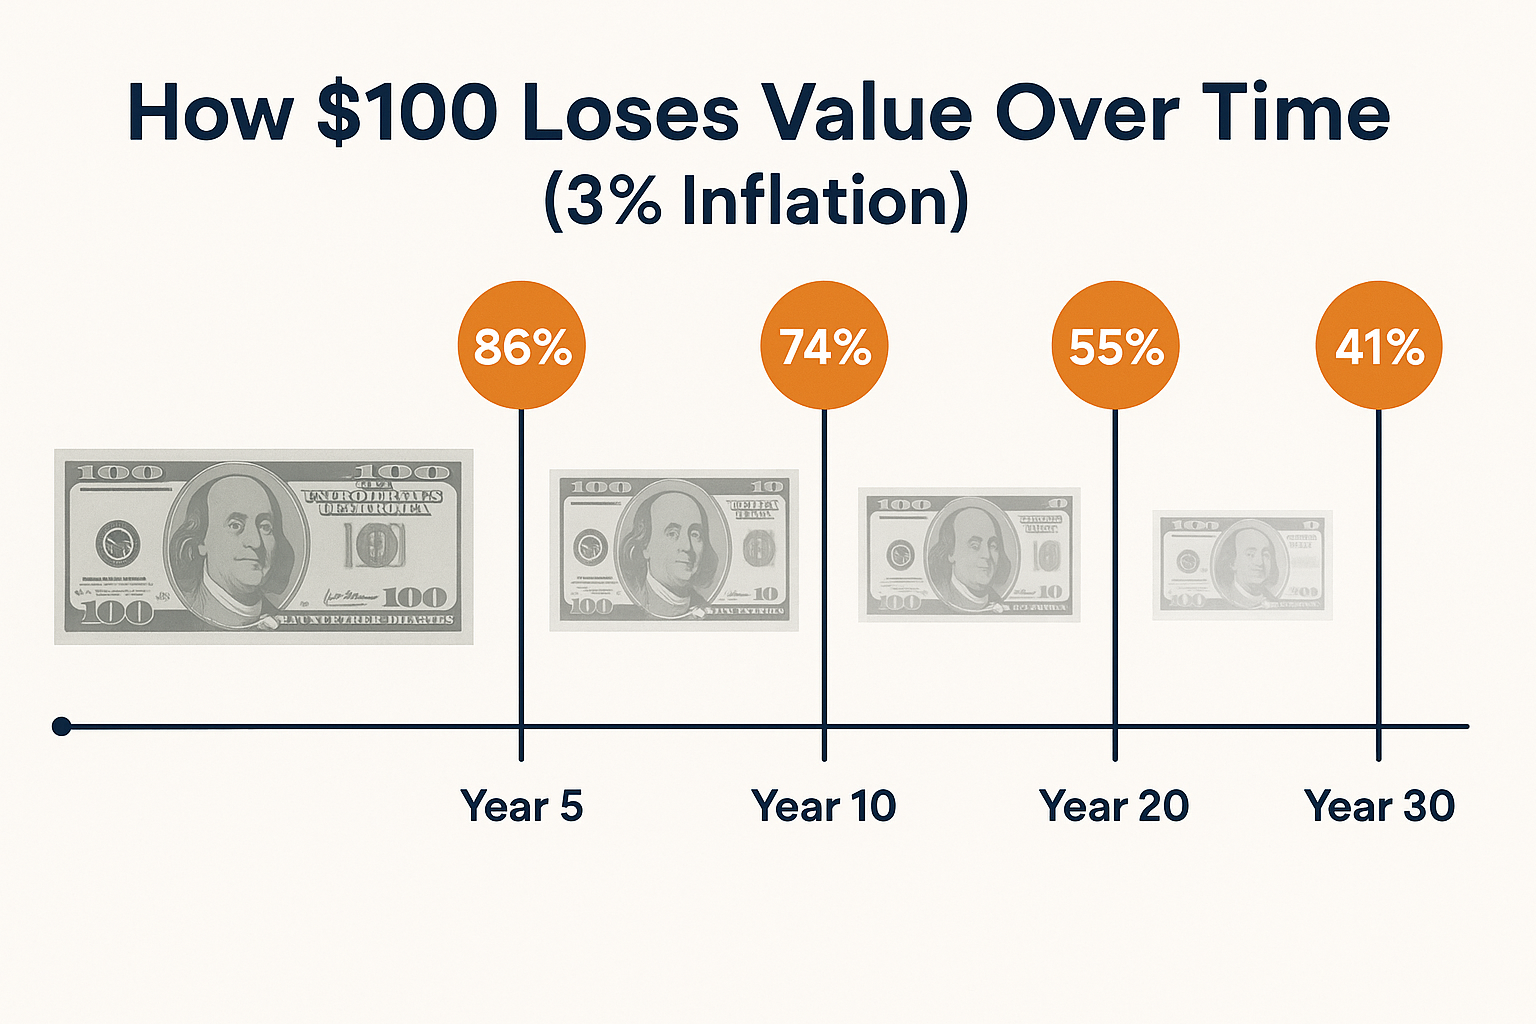
At 3% annual inflation:
- Year 1: $100 loses $3 in purchasing power (now worth $97)
- Year 5: $100 is worth only $85.87
- Year 10: $100 is worth only $74.41
- Year 20: $100 is worth only $55.37
- Year 30: $100 is worth only $41.20
Your money loses more than half its value over 30 years at just 3% inflation. This is why your grandparents’ stories about buying a house for $20,000 seem absurd today.
Different Inflation Rates, Different Realities
Not all inflation is created equal. Here’s how different inflation rates impact a $100,000 investment earning 7% nominal returns over 20 years:
Nominal vs Real Return
| Inflation Rate | Nominal Value After 20 Years | Real Value (Today’s Dollars) | Real Annual Return |
|---|---|---|---|
| 1% | $386,968 | $315,242 | ~6% |
| 2% | $386,968 | $261,171 | ~5% |
| 3% | $386,968 | $214,548 | ~4% |
| 4% | $386,968 | $176,110 | ~3% |
| 5% | $386,968 | $144,173 | ~2% |
Notice how your nominal value stays the same, but your real wealth varies dramatically? A 5% inflation environment versus a 1% environment means the difference between $315,000 and $144,000 in real purchasing power, more than 50% less!
This is why the Federal Reserve’s inflation management matters so much to your portfolio.
Personal Inflation Rates
Here’s something most financial advisors won’t tell you: your personal inflation rate might differ significantly from the official CPI.
The Consumer Price Index (CPI) measures a basket of goods that might not match your spending. If you’re:
- Paying for college: Education inflation runs 5-6% annually
- Dealing with healthcare: Medical inflation averages 4-5%
- Living in a hot real estate market: Housing costs might inflate 7-10% annually
Your personal inflation rate could be 1-2% higher than the national average, meaning you need even better real returns to maintain your lifestyle.
Real-World Examples: Nominal vs Real Return in Action
Let’s walk through some scenarios that show how this plays out in actual investing situations.
Example 1: The Bond Investor (2020-2025)
Jennifer invested $200,000 in a diversified bond portfolio in 2020. Her five-year results:
- 2020: 5.2% nominal return, 1.2% inflation = 4.0% real return
- 2021: 4.8% nominal return, 7.0% inflation = -2.2% real return
- 2022: 3.9% nominal return, 6.5% inflation = -2.6% real return
- 2023: 4.5% nominal return, 3.4% inflation = 1.1% real return
- 2024: 4.7% nominal return, 2.9% inflation = 1.8% real return
Jennifer’s account grew from $200,000 to $247,563, a 23.8% total nominal gain. She felt successful.
But in real terms (adjusted for cumulative inflation of about 22%), her purchasing power only increased to about $203,000 in 2020 dollars. Five years of investing for essentially zero real growth.
Example 2: The Stock Market Investor
David took a different approach with his $200,000, investing in a diversified stock portfolio:
- 2020: 18.4% nominal return, 1.2% inflation = 17.2% real return
- 2021: 28.7% nominal return, 7.0% inflation = 21.7% real return
- 2022: -18.1% nominal return, 6.5% inflation = -24.6% real return
- 2023: 26.3% nominal return, 3.4% inflation = 22.9% real return
- 2024: 11.2% nominal return, 2.9% inflation = 8.3% real return
David’s account grew to $352,847, a 76.4% total nominal gain. More importantly, his real purchasing power increased to about $289,000 in 2020 dollars.
David experienced more volatility (notice that brutal 2022), but his real wealth increased by 44.5% compared to Jennifer’s 1.5%. This is the power of focusing on real returns and understanding why the stock market goes up over time.
Example 3: The Cash Holder
Meanwhile, their friend Robert kept $200,000 in a “safe” savings account averaging 2% interest over the same period.
His account grew to $220,816, a 10.4% nominal gain. But after 22% cumulative inflation, his purchasing power dropped to about $181,000 in 2020 dollars, a 9.5% real loss.
Robert thought he was being conservative. In reality, he guaranteed wealth destruction.
How to Calculate Your Own Real Returns
Ready to see how your investments are really performing? Here’s your step-by-step guide.
Step 1: Gather Your Data
You’ll need:
- Your investment’s beginning value
- Your investment’s ending value
- The time period
- The inflation rate for that period
Step 2: Calculate Nominal Return
Nominal Return = [(Ending Value – Beginning Value) / Beginning Value] × 100
Example: $50,000 grew to $57,500 in one year
Nominal Return = [($57,500 – $50,000) / $50,000] × 100 = 15%
Step 3: Find the Inflation Rate
For U.S. investors, visit the Bureau of Labor Statistics (BLS) website for official CPI data. For 2024-2025, inflation has been running around 2.5-3.5%.
Step 4: Calculate Real Return
Real Return = [(1 + Nominal Return) / (1 + Inflation Rate)] – 1
Using our example with 3% inflation:
Real Return = [(1.15) / (1.03)] – 1 = 0.1165 or 11.65%
Quick approximation: 15% – 3% = 12% (close enough!)
Step 5: Evaluate
Ask yourself:
- Is my real return positive? (If not, you’re losing purchasing power)
- Does my return meet my financial goals?
- Am I taking an appropriate risk for this real return?
This is especially important when evaluating passive income strategies or dividend investing approaches.
Strategies to Maximize Real Returns
Now that you understand the problem, let’s talk solutions. How do you ensure your investments deliver solid real returns?
1. Invest in Assets That Outpace Inflation
Historically, certain asset classes have consistently beaten inflation:
Stocks: Long-term real returns of 6-7% annually (10% nominal minus 3-4% inflation)
Real Estate: Real returns of 3-4% annually, plus inflation protection built into rents
TIPS (Treasury Inflation-Protected Securities): Designed specifically to provide inflation-adjusted returns
Commodities: Can hedge against inflation, though volatile
Cash and traditional bonds? They typically underperform inflation over long periods.
2. Focus on Total Return, Not Just Income
Many retirees chase high dividend stocks paying 6-8% yields, thinking they’re getting great returns. But if that stock’s price stagnates or declines, the total return might be only 3-4%, barely ahead of inflation.
Better approach: Focus on total return (dividends + price appreciation) rather than yield alone.
3. Rebalance Regularly
Market movements can throw off your allocation, potentially reducing your real returns. Annual rebalancing keeps you on track.
4. Minimize Fees and Taxes
A 1% annual fee might not sound like much, but it comes straight off your real return. Over 30 years, that 1% fee can cost you 25-30% of your total wealth.
Similarly, tax-inefficient investing can shave 1-2% off your returns annually. Use tax-advantaged accounts (401(k)s, IRAs, HSAs) strategically.
5. Don’t Panic During Volatility
The cycle of market emotions causes many investors to sell during downturns, locking in losses. This is one of the main reasons why people lose money in the stock market.
Remember: temporary nominal losses matter less than long-term real returns. Stay focused on your real return goals.
6. Increase Equity Exposure When Young
If you’re decades from retirement, you can weather short-term volatility in exchange for higher long-term real returns. A portfolio heavily weighted toward stocks makes sense when you have time to ride out market cycles.
As you age, gradually shift toward a balance that still provides inflation-beating returns while reducing volatility.
Common Mistakes to Avoid
Even savvy investors make these errors when thinking about nominal vs real returns:
Mistake #1: Planning Retirement with Nominal Returns
We covered this earlier, but it bears repeating: Always plan in real terms. If your retirement calculator doesn’t account for inflation, you’re setting yourself up for disappointment.
Mistake #2: Comparing Investments Across Different Time Periods
“My grandfather earned 15% on CDs in 1981!” Yes, but inflation was 10.3% that year. His real return was less than 5%.
Always adjust for the inflation environment when comparing historical returns.
Mistake #3: Ignoring Sequence of Returns Risk
Two investors can have identical average nominal returns but vastly different outcomes based on when they experience gains and losses, especially in retirement when withdrawing money.
Real return analysis helps, but you also need to consider sequence risk in your planning.
Mistake #4: Treating All Inflation Equally
Official inflation figures might not match your personal experience. If you’re planning for college expenses or healthcare in retirement, build in higher personal inflation assumptions.
Mistake #5: Overreacting to Short-Term Real Return Fluctuations
One year of negative real returns doesn’t mean your strategy is broken. What matters is your average real return over decades.
Making smart financial moves means staying focused on long-term real returns, not panicking over short-term nominal fluctuations.
Tools and Resources for Tracking Real Returns
Want to stay on top of your real returns? Here are the best resources:
Official Inflation Data
- Bureau of Labor Statistics (BLS): Official U.S. inflation data and CPI reports
- Federal Reserve Economic Data (FRED): Historical inflation data and economic indicators
- TreasuryDirect: Current TIPS yields (which reflect market inflation expectations)
Portfolio Tracking
- Personal Capital: Free tool that tracks your portfolio performance (though you’ll need to calculate real returns manually)
- Morningstar: Provides inflation-adjusted return data for mutual funds
- Your brokerage platform: Most major brokerages now offer return calculators
Calculators
- Inflation Calculator: The BLS provides a simple tool to see how purchasing power has changed
- Real Return Calculator: Many financial websites offer free calculators (or use the interactive tool in this article!)
The Bottom Line: Real Returns Are What Count
Here’s the truth that separates wealthy investors from everyone else: nominal returns are for show; real returns are for wealth.
You can have a portfolio that looks impressive on paper, with big nominal gains year after year, while your actual purchasing power barely budges. Or worse, shrinks.
The investors who build lasting wealth, the ones who retire comfortably, who achieve financial independence, who create generational wealth, are the ones who think in terms of real returns from day one.
They don’t get excited about 8% gains in a 7% inflation environment. They don’t keep all their money in “safe” accounts earning 2% while inflation runs at 3%. They don’t plan their retirement based on nominal projections that ignore the erosion of purchasing power.
Instead, they:
✅ Choose investments with strong long-term real return potential
✅ Plan their financial goals using inflation-adjusted projections
✅ Regularly calculate their portfolio’s real performance
✅ Stay invested through market volatility to capture long-term real gains
✅ Minimize fees and taxes that eat into real returns
✅ Adjust their strategy as inflation environments change
The difference between nominal and real returns isn’t just a technical distinction; it’s the difference between financial success and failure, between a comfortable retirement and running out of money, between building wealth and merely treading water.
Taking Action: Your Next Steps
Ready to start focusing on real returns? Here’s your action plan:
This Week:
- Calculate the real return of your current portfolio over the past year
- Review your retirement projections; are they based on nominal or real returns?
- Check what percentage of your portfolio is in inflation-beating assets
This Month:
- Rebalance your portfolio if needed to improve long-term real return potential
- Set up a system to track your real returns quarterly or annually
- Review your investment fees; are they eating too much of your real return?
This Year:
- Develop a comprehensive investment strategy focused on real returns
- Consider working with a fee-only financial advisor who thinks in real return terms
- Educate family members about this critical distinction
Remember: the goal isn’t to get the highest nominal return possible. The goal is to maximize your real, inflation-adjusted returns while taking appropriate risk for your situation.
Every investment decision you make should pass this simple test: “Will this help my purchasing power grow over time?”
If the answer is yes, you’re on the path to real wealth. If the answer is no, it’s time to reconsider your strategy.
The markets will continue to fluctuate. Inflation will continue to erode purchasing power. But armed with an understanding of nominal vs real returns, you’ll be equipped to make decisions that actually build wealth, not just impressive-looking account balances.
Your future self will thank you for making this distinction today.
📊 Real Return Calculator
Disclaimer
This article is for educational and informational purposes only and should not be construed as financial advice. Investment decisions should be made based on your individual financial situation, goals, and risk tolerance. Past performance does not guarantee future results. Inflation rates and investment returns vary over time. Consider consulting with a qualified financial advisor before making investment decisions. The author and publisher are not responsible for any financial decisions made based on the information in this article.
About the Author
Max Fonji is a financial educator and wealth-building strategist with over three decades of experience helping everyday investors understand complex financial concepts. As the founder of TheRichGuyMath.com, Max is passionate about breaking down intimidating investment topics into clear, actionable guidance that empowers readers to build lasting wealth. His work has helped thousands of investors make smarter financial decisions and achieve their long-term goals.


