Picture this: Two investment funds both deliver a 15% return in 2025. Sounds like a tie, right? But what if one achieved that return by investing in stable blue-chip stocks, while the other rode a rollercoaster of volatile cryptocurrency trades? The risk each fund took mattered just as much as the reward it earned. This is where risk-adjusted return becomes your secret weapon for making smarter investment decisions.
Understanding risk-adjusted return is like learning to read the nutrition label on your investments; it reveals what’s really inside beyond the flashy headline numbers. Whether you’re building your first portfolio or trying to understand why the stock market behaves the way it does, mastering this concept will transform you from a gambler into a strategic investor.
Key Takeaways
- Risk-adjusted return measures how much return you earned per unit of risk taken, not just total returns.
- The Sharpe Ratio is the most popular metric, comparing excess returns to volatility.y
- Higher risk doesn’t always mean higher returns; smart investing is about optimizing the relationship between both..
- Different metrics reveal different aspects of risk, from market sensitivity (Beta) to downside protection (Sortino Ratio)
- Using risk-adjusted metrics helps you compare apples to apples across different investment types and strategies.
What Is Risk-Adjusted Return?
Risk-adjusted return is a financial concept that measures how much return an investment generates relative to the amount of risk it takes to achieve that return. Think of it as the “bang for your buck” of the investing world—but instead of measuring value for money, you’re measuring risk reward.
When you invest, you’re essentially making a trade-off: accepting some level of uncertainty (risk) in exchange for the potential to grow your money (return). A naive investor might chase the highest returns without considering the sleepless nights and stomach-churning volatility required to achieve them.
Why Raw Returns Don’t Tell the Whole Story
Let’s say your neighbor brags about making 30% on a hot stock tip last year. Impressive, right? But what if that stock swung wildly between +50% and -40% throughout the year, causing them constant anxiety? Meanwhile, you earned a steady 12% through dividend investing with minimal volatility.
Who really had the better year? Raw returns say your neighbor won. Risk-adjusted returns might tell a different story.
This distinction becomes crucial when you’re:
- Comparing different investment options
- Evaluating fund manager performance
- Building a balanced portfolio
- Making decisions about passive income strategies
- Understanding why people lose money in the stock market
The Core Concept: Risk vs Reward
Every investment decision involves a fundamental trade-off between risk and reward. Risk represents the uncertainty or variability of returns, essentially, how much your investment’s value might fluctuate. Reward is the return you receive for accepting that uncertainty.
Here’s the key insight: Not all risks are rewarded equally.
Investment professionals use risk-adjusted metrics to answer critical questions:
- Am I being adequately compensated for the risk I’m taking?
- Which investment delivers better returns for the same level of risk?
- Is this fund manager genuinely skilled, or just lucky with risky bets?
The Efficient Frontier Principle
Modern portfolio theory introduces the concept of the “efficient frontier”, the sweet spot where you get the maximum return for a given level of risk, or the minimum risk for a desired return. Risk-adjusted metrics help you identify whether your investments are on this efficient frontier or falling short.
Key Risk-Adjusted Return Metrics
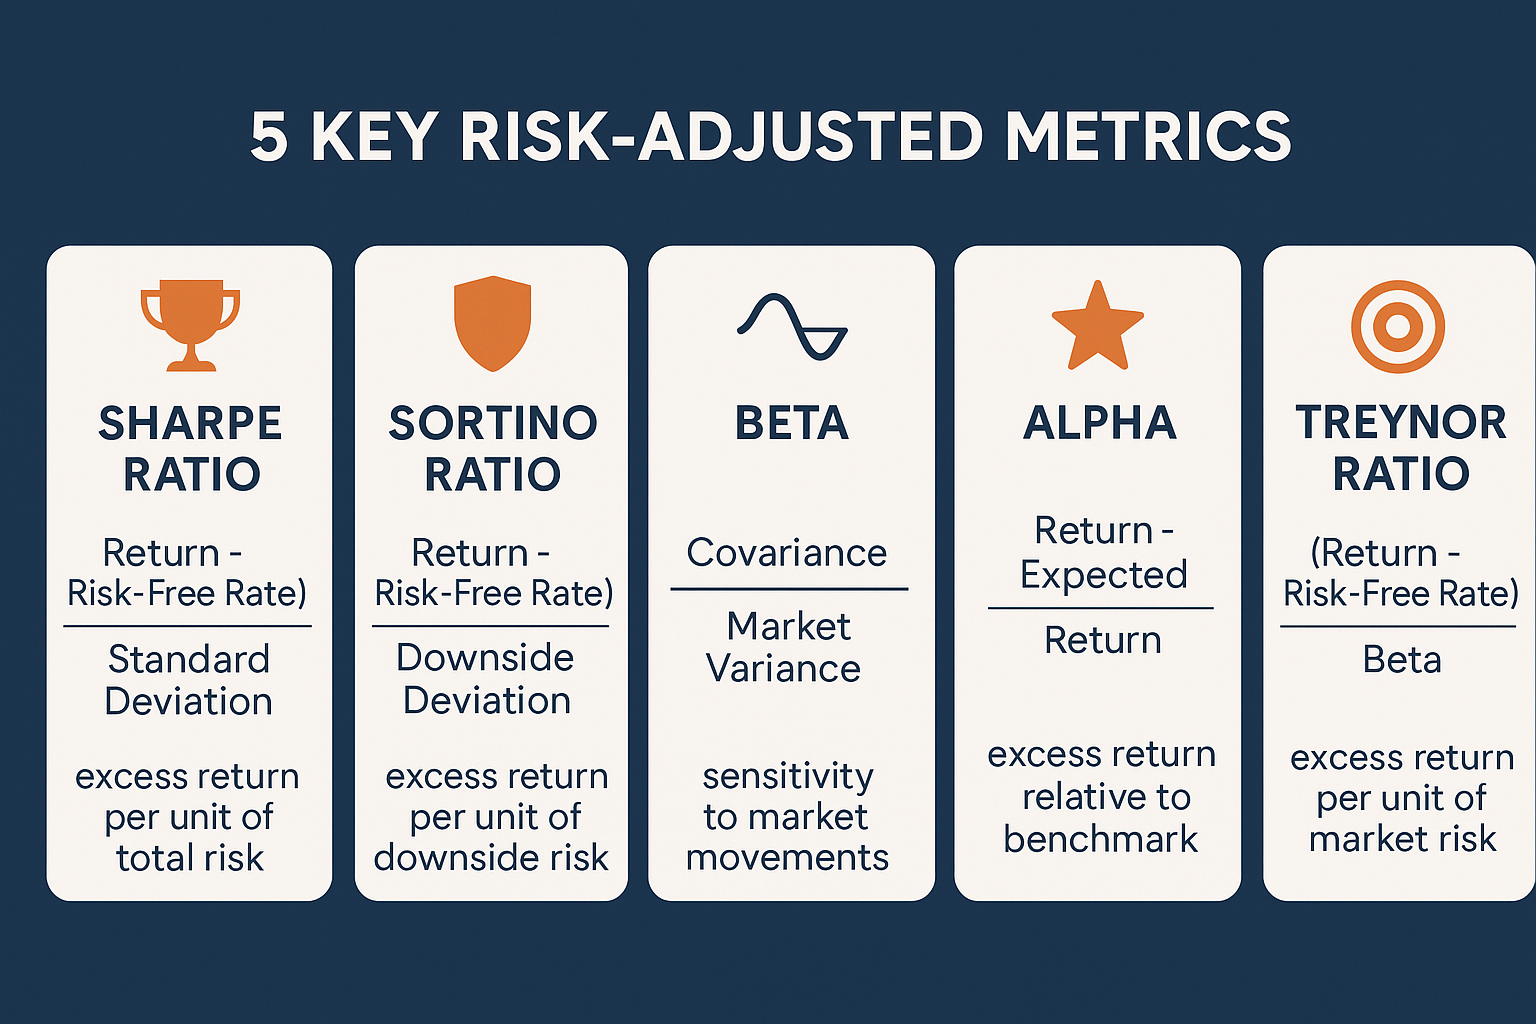
Let’s explore the most important tools in your risk-adjusted analysis toolkit. Each metric offers a unique lens for evaluating investment performance.
1. Sharpe Ratio: The Gold Standard
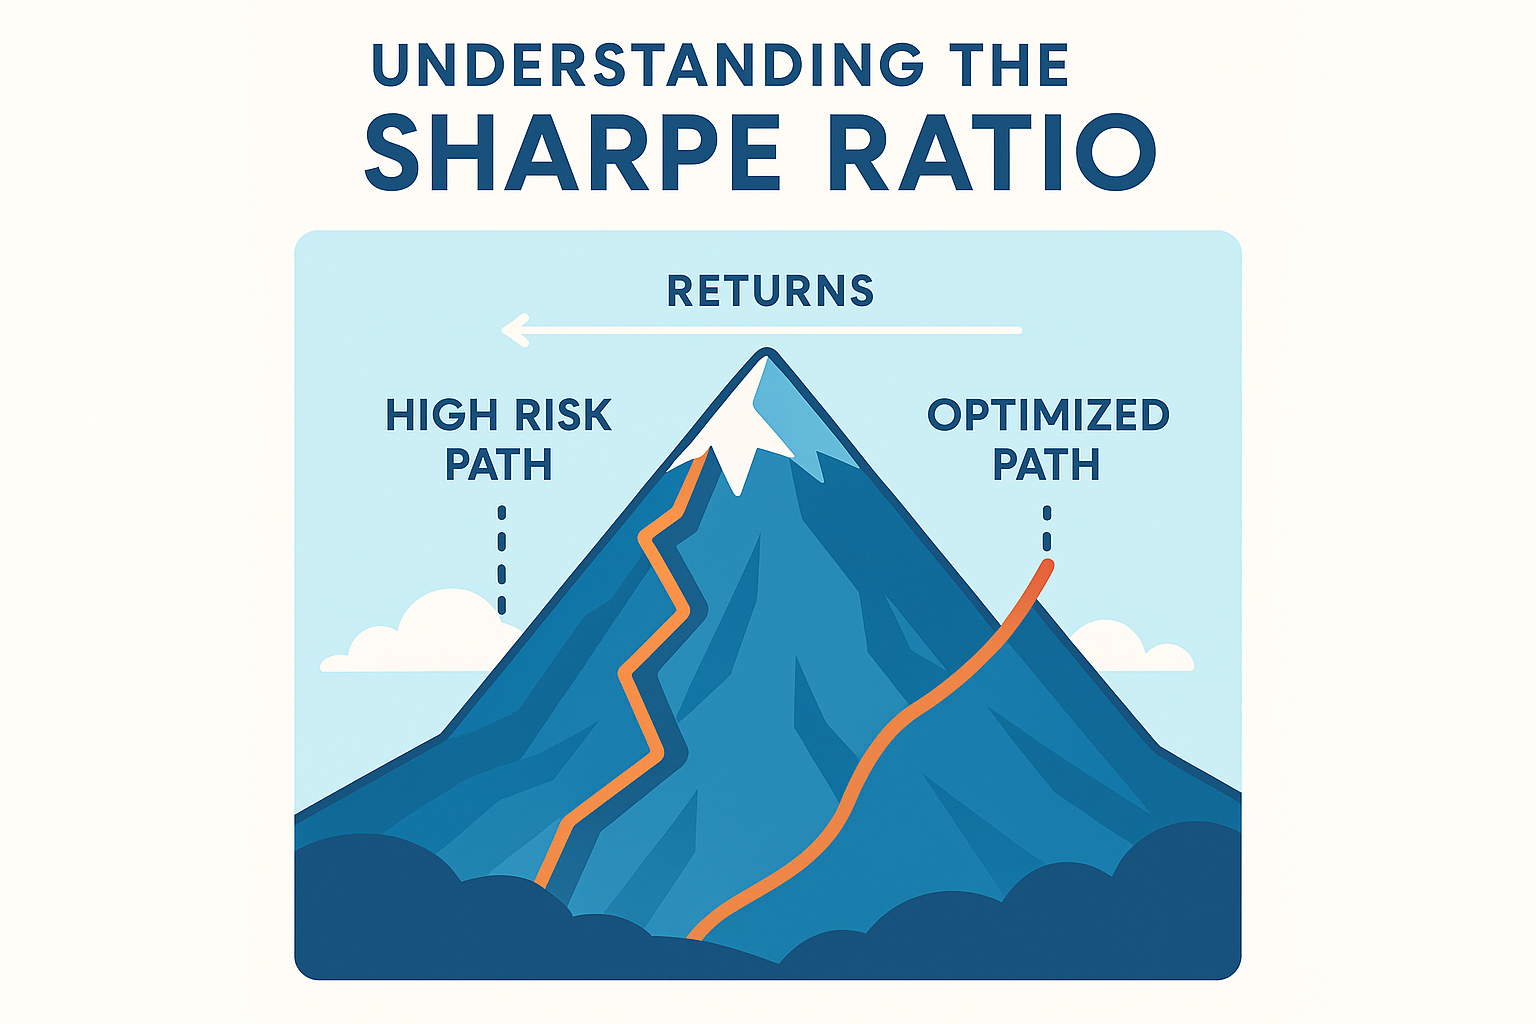
The Sharpe Ratio is arguably the most widely used risk-adjusted performance metric. Developed by Nobel laureate William Sharpe in 1966, it measures excess return per unit of total risk.
Formula:
Sharpe Ratio = (Portfolio Return - Risk-Free Rate) / Standard Deviation of PortfolioWhat it means:
- The numerator (Portfolio Return – Risk-Free Rate) represents the “excess return”—what you earned above a safe investment like Treasury bills
- The denominator (Standard Deviation) measures total volatility
- A higher Sharpe Ratio is better, indicating more return per unit of risk
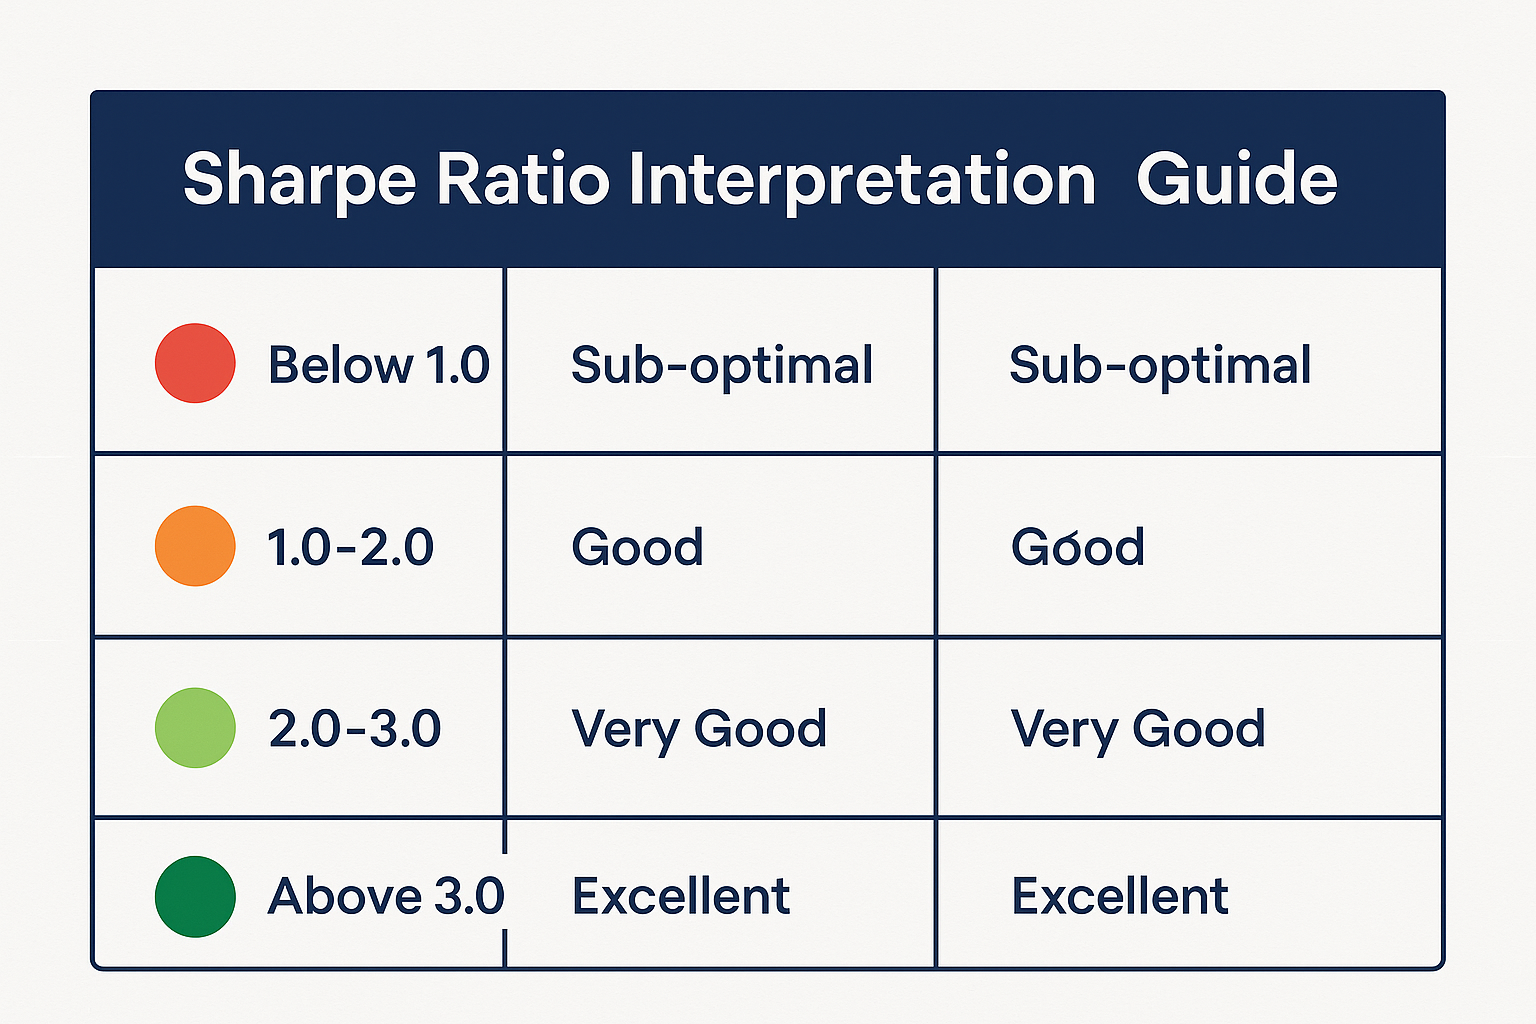
Interpretation Guide:
| Sharpe Ratio | Investment Quality |
|---|---|
| Less than 1.0 | Sub-optimal (not much reward for the risk) |
| 1.0 to 2.0 | Good (acceptable risk-reward balance) |
| 2.0 to 3.0 | Very good (strong risk-adjusted performance) |
| Above 3.0 | Excellent (exceptional risk-adjusted returns) |
Real-world example: If Fund A returns 12% with a standard deviation of 15%, and Fund B returns 10% with a standard deviation of 8% (assuming a 2% risk-free rate), Fund A has a Sharpe Ratio of 0.67 while Fund B has 1.0—making Fund B the better risk-adjusted choice despite lower absolute returns.
2. Sortino Ratio: Focusing on Downside Risk
The Sortino Ratio is a variation of the Sharpe Ratio that only penalizes “bad” volatility, specifically, downside deviation below a minimum acceptable return.
Formula:
Sortino Ratio = (Portfolio Return - Target Return) / Downside DeviationWhy it matters: The Sharpe Ratio treats all volatility equally, but investors typically don’t mind upside volatility (gains). The Sortino Ratio acknowledges this by focusing only on downside risk, the volatility that actually hurts.
When to use it: The Sortino Ratio is particularly useful when evaluating investments that have asymmetric return distributions or when you’re specifically concerned about downside protection.
3. Beta: Market Sensitivity
Beta measures an investment’s volatility relative to the overall market (typically represented by the S&P 500).
Formula:
Beta = Covariance(Investment Returns, Market Returns) / Variance(Market Returns)Interpretation:
- Beta = 1.0: The investment moves in line with the market
- Beta > 1.0: More volatile than the market (amplifies market movements)
- Beta < 1.0: Less volatile than the market (dampens market movements)
- Beta < 0: Moves opposite to the market (rare, but useful for hedging)
Example: A stock with a Beta of 1.5 would theoretically rise 15% when the market rises 10%, and fall 15% when the market drops 10%. This makes it a higher-risk, higher-potential-reward investment.
Understanding Beta helps you gauge how your portfolio might behave during different market emotion cycles.
4. Alpha: Outperformance Measure
Alpha represents the excess return of an investment relative to a benchmark index, after adjusting for risk (typically measured by Beta).
Formula:
Alpha = Actual Return - [Risk-Free Rate + Beta × (Market Return - Risk-Free Rate)]What it reveals:
- Positive Alpha: The investment outperformed expectations given its risk level (good!)
- Zero Alpha: The investment performed exactly as expected for its risk
- Negative Alpha: The investment underperformed relative to its risk (not good)
The holy grail: Professional fund managers are constantly seeking to generate positive alpha, returns that can’t be explained by market movements alone. It’s the measure of true skill versus luck.
5. Treynor Ratio: Return per Unit of Systematic Risk
The Treynor Ratio is similar to the Sharpe Ratio but uses Beta (systematic risk) instead of total volatility.
Formula:
Treynor Ratio = (Portfolio Return - Risk-Free Rate) / BetaWhen to use it: This metric is most useful when evaluating well-diversified portfolios where unsystematic (company-specific) risk has been eliminated, leaving only market risk.
How to Calculate Risk-Adjusted Return: Step-by-Step
Let’s walk through a practical example calculating the Sharpe Ratio, the most commonly used metric.
Example Scenario
Imagine you’re comparing two investments for 2025:
Investment A (Growth Stock Fund):
- Annual return: 18%
- Standard deviation: 22%
Investment B (Balanced Fund):
- Annual return: 11%
- Standard deviation: 10%
Risk-free rate: 4% (current 10-year Treasury yield)
Step-by-Step Calculation
For Investment A:
- Calculate excess return: 18% – 4% = 14%
- Divide by standard deviation: 14% / 22% = 0.64
For Investment B:
- Calculate excess return: 11% – 4% = 7%
- Divide by standard deviation: 7% / 10% = 0.70
The Verdict
Despite Investment A’s higher absolute return (18% vs. 11%), Investment B has the better risk-adjusted return (0.70 vs. 0.64 Sharpe Ratio). You’re getting more “bang for your buck” in terms of return per unit of risk with Investment B.
This doesn’t necessarily mean Investment B is the right choice for everyone—your personal risk tolerance, time horizon, and goals matter too. But it does mean that Investment A isn’t compensating you adequately for the extra risk you’re taking.
Practical Applications for Investors
Understanding risk-adjusted returns isn’t just academic; it has real-world applications that can improve your investment outcomes.
Portfolio Construction
When building a portfolio, risk-adjusted metrics help you:
- Select complementary assets that optimize the risk-reward profile
- Avoid redundant risks by identifying investments with similar risk profiles
- Balance aggressive and conservative holdings appropriately
- Maximize returns for your personal risk tolerance
For example, if you’re interested in high dividend stocks, comparing their Sharpe Ratios can help you identify which ones deliver the best risk-adjusted income.
Fund Manager Evaluation
When choosing mutual funds or ETFs, risk-adjusted metrics reveal whether managers are:
- Genuinely skilled at generating returns (positive alpha)
- Simply taking excessive risks to boost headline numbers
- Providing value beyond what you could achieve with a simple index fund
A fund with mediocre returns but excellent risk-adjusted performance might be a better choice than one with flashy returns achieved through excessive volatility.
Performance Monitoring
Regularly calculating risk-adjusted returns for your portfolio helps you:
- Track whether your strategy is working over time
- Identify when adjustments are needed before major losses occur
- Compare your performance against relevant benchmarks
- Stay disciplined during market turbulence by focusing on long-term risk-adjusted goals
Retirement Planning
For those building wealth for the future (perhaps even thinking about how to make your kid a millionaire), risk-adjusted returns become increasingly important as you approach retirement age. The goal shifts from maximizing returns to optimizing the risk-reward balance. You can’t afford a major drawdown when you’re close to needing the money.
Common Mistakes to Avoid
Even experienced investors sometimes misuse or misinterpret risk-adjusted metrics. Here are the pitfalls to watch out for:
1. Focusing Solely on Returns
The trap: Chasing the highest returns without considering risk is like driving with your eyes on the speedometer instead of the road.
The fix: Always evaluate returns in the context of the risk taken. A 15% return with minimal volatility often beats a 20% return achieved through wild swings.
2. Ignoring Time Horizons
The trap: Risk-adjusted metrics can vary significantly over different time periods. A fund might look great over one year but mediocre over five years.
The fix: Evaluate risk-adjusted performance over multiple time horizons that match your investment goals. For long-term wealth building, focus on 5-10 year track records.
3. Using the Wrong Benchmark
The trap: Comparing your international stock fund to the S&P 500 will give misleading Alpha and Beta calculations.
The fix: Always use appropriate benchmarks. International funds should be compared to international indices, bond funds to bond indices, etc.
4. Overlooking Distribution Assumptions
The trap: The Sharpe Ratio assumes returns are normally distributed, but many investments have “fat tails”—meaning extreme events happen more often than the math suggests.
The fix: Complement Sharpe Ratio analysis with other metrics like Sortino Ratio or maximum drawdown, especially for volatile or alternative investments.
5. Forgetting About Costs
The trap: Calculating risk-adjusted returns before fees can make expensive actively managed funds look deceptively attractive.
The fix: Always use net-of-fee returns when calculating risk-adjusted metrics for real-world decision making.
Risk-Adjusted Returns in Different Market Conditions
Risk-adjusted performance metrics behave differently depending on market conditions, which is important to understand for proper interpretation.
Bull Markets
During strong bull markets, risk-adjusted metrics might actually favor more conservative investments. Why? Because volatility is often low across the board, taking extra risk doesn’t necessarily generate proportionally higher returns.
Lesson: Don’t be fooled by high absolute returns during bull runs. Check whether you’re being adequately compensated for risk—you might find that boring, stable investments are delivering better risk-adjusted performance.
Bear Markets
In bear markets, downside-focused metrics like the Sortino Ratio become particularly revealing. Investments with good downside protection will shine in these conditions, even if their absolute returns are negative.
Lesson: Defensive investments often demonstrate their value through risk-adjusted metrics during downturns. This is when you see which managers truly add value through risk management.
Volatile Markets
During periods of high volatility, standard deviation increases, which typically reduces Sharpe Ratios across the board. However, investments with good risk management will see smaller declines in their risk-adjusted metrics.
Lesson: Volatile markets test the true quality of risk management. The investments that maintain relatively stable risk-adjusted returns during turbulence are often worth holding onto.
Understanding these patterns helps you avoid making emotional decisions during market emotion cycles and stay focused on long-term risk-adjusted goals.
Advanced Considerations
As you become more sophisticated with risk-adjusted analysis, consider these advanced concepts:
Maximum Drawdown
Maximum drawdown measures the largest peak-to-trough decline in portfolio value. While not a ratio like Sharpe or Sortino, it provides crucial context about the worst-case scenario you might face.
Why it matters: An investment might have a great Sharpe Ratio but experience a catastrophic 50% drawdown at some point. Knowing this helps you assess whether you could psychologically handle that investment.
Calmar Ratio
The Calmar Ratio compares annualized return to maximum drawdown:
Calmar Ratio = Annualized Return / Maximum DrawdownHigher is better; it shows how much return you’re getting relative to the worst loss you might experience.
Information Ratio
The Information Ratio measures a portfolio manager’s ability to generate excess returns relative to a benchmark, adjusted for the volatility of those excess returns:
Information Ratio = (Portfolio Return - Benchmark Return) / Tracking ErrorThis is particularly useful for evaluating active fund managers against their stated benchmarks.
Conditional Value at Risk (CVaR)
Also called “Expected Shortfall,” CVaR estimates the average loss you might experience in the worst-case scenarios (typically the worst 5% of outcomes).
Why it’s useful: It goes beyond simple volatility to focus on tail risk—the catastrophic losses that can destroy portfolios.
Building Your Risk-Adjusted Investment Strategy
Now that you understand the concepts and metrics, how do you actually apply this knowledge? Here’s a practical framework:
Step 1: Define Your Risk Tolerance
Before diving into calculations, honestly assess:
- How much volatility can you stomach emotionally?
- What’s your investment time horizon?
- What are your financial goals and constraints?
- How would a 20%, 30%, or 50% drawdown affect your life and plans?
Step 2: Set Your Benchmark
Choose appropriate benchmarks for comparison:
- For stock-heavy portfolios: S&P 500 or total stock market index
- For balanced portfolios: 60/40 stock/bond blend
- For specific strategies: Relevant sector or style indices
Step 3: Calculate and Compare
Regularly (quarterly or annually) calculate:
- Sharpe Ratio for overall risk-adjusted performance
- Sortino Ratio for downside risk assessment
- Maximum drawdown to understand worst-case scenarios
- Alpha to evaluate whether you’re beating benchmarks after risk adjustment
Step 4: Make Informed Adjustments
Use your analysis to:
- Eliminate poor performers: Investments with consistently low risk-adjusted returns
- Rebalance allocations: Shift toward better risk-adjusted opportunities
- Adjust risk exposure: Increase or decrease overall portfolio risk based on goals
- Stay disciplined: Avoid chasing hot performers without considering risk
Step 5: Monitor and Iterate
Risk-adjusted investing isn’t a one-time exercise. Markets change, your circumstances evolve, and new opportunities emerge. Make this analysis part of your regular smart money moves routine.
Real-World Success Story
Consider the story of Sarah, a 35-year-old professional who started investing in 2020. Initially, she chased the hottest tech stocks and cryptocurrencies, achieving impressive 40% returns in her first year. She felt like a genius.
Then 2022 happened. Her portfolio crashed 55% while the broader market fell only 18%. The stress was unbearable. She couldn’t sleep, constantly checked prices, and nearly sold everything at the bottom.
The turning point: Sarah discovered risk-adjusted returns. She calculated that her Sharpe Ratio for 2020-2022 combined was actually negative, while a simple index fund had a positive ratio despite lower peak returns.
She restructured her portfolio using risk-adjusted metrics as her guide:
- Replaced speculative positions with quality dividend stocks
- Added bonds to reduce overall volatility
- Focused on investments with Sharpe Ratios above 0.8
- Set a maximum acceptable drawdown of 25%
The result: Over the next three years, her absolute returns were lower (averaging 11% annually vs. the 15% she dreamed of), but her Sharpe Ratio improved to 1.2. More importantly, she slept soundly, stayed invested through volatility, and actually enjoyed the investing process.
Sarah’s story illustrates a crucial truth: sustainable wealth building comes from optimizing risk-adjusted returns, not chasing maximum returns.
Tools and Resources
Several tools can help you calculate and monitor risk-adjusted returns:
Free Resources
- Portfolio Visualizer – Excellent free tool for calculating Sharpe Ratios, drawdowns, and other metrics
- Morningstar – Provides risk-adjusted ratings for mutual funds and ETFs
- Yahoo Finance – Offers Beta data for individual stocks
- Your brokerage platform – Most platforms now include basic risk metrics
Spreadsheet Templates
Creating your own Excel or Google Sheets calculator is educational and customizable. Include columns for:
- Monthly returns
- Standard deviation calculations
- Risk-free rate inputs
- Automated Sharpe and Sortino Ratio calculations
Professional Platforms
For serious investors, platforms like Bloomberg Terminal, FactSet, or Morningstar Direct provide comprehensive risk analytics—though they come with substantial price tags.
📊 Risk-Adjusted Return Calculator
Your Risk-Adjusted Metrics
Frequently Asked Questions
Generally, a Sharpe Ratio above 1.0 is considered acceptable, above 2.0 is very good, and above 3.0 is excellent. However, this varies by asset class—bond funds typically have lower Sharpe Ratios than stock funds.
Yes! If an investment’s return is below the risk-free rate, its Sharpe Ratio will be negative, indicating you’d have been better off in safe Treasury bills.
For most individual investors, quarterly or annual calculations are sufficient. More frequent calculations can be noisy and lead to overtrading.
Yes, but with modifications. These assets often have less frequent pricing data, so you may need to use appraisal-based values and adjust for liquidity risk.
Not necessarily. Risk-adjusted metrics are one tool among many. Your personal goals, time horizon, and risk tolerance also matter. A young investor with decades until retirement might rationally accept lower risk-adjusted returns for higher growth potential.
Conclusion: Your Path to Smarter Investing
Risk-adjusted return is more than just a mathematical formula—it’s a fundamental shift in how you think about investing. Instead of chasing the highest returns and hoping for the best, you’re now equipped to evaluate whether those returns are worth the risks you’re taking.
The key insights to remember:
✅ Returns without context are meaningless. A 20% return achieved through reckless risk-taking is inferior to a 12% return with minimal volatility.
✅ Multiple metrics provide multiple perspectives. Use the Sharpe Ratio for overall assessment, Sortino for downside focus, Alpha for manager skill, and Beta for market sensitivity.
✅ Risk-adjusted thinking builds sustainable wealth. The investors who succeed long-term aren’t the ones who take the biggest risks; they’re the ones who optimize the relationship between risk and reward.
✅ Your personal situation matters. A good risk-adjusted return for a 25-year-old might be different from that for a 60-year-old retiree. Customize your analysis to your circumstances.
Your Action Plan
Here’s what to do next:
- Calculate your current portfolio’s Sharpe Ratio using historical returns and the calculator above
- Compare against relevant benchmarks to see if you’re getting adequate compensation for risk
- Identify underperforming investments with poor risk-adjusted returns and consider replacements
- Set risk-adjusted goals instead of just return targets (e.g., “achieve a Sharpe Ratio of 1.0 or better”)
- Review quarterly to ensure you’re staying on track
Remember, investing isn’t about being the most aggressive or the most conservative—it’s about being the most intelligent with how you balance risk and reward. By mastering risk-adjusted returns, you’re joining the ranks of sophisticated investors who make decisions based on data, not emotion.
Whether you’re just starting your investment journey or refining an existing strategy, these concepts will serve you well for decades to come. The markets will always fluctuate, trends will come and go, but the fundamental principle remains: the best investments are those that deliver optimal returns for the risks you’re willing to take.
Now go forth and invest smarter, not just harder!
Disclaimer
This article is for educational and informational purposes only and should not be construed as financial advice. Risk-adjusted return calculations are based on historical data and mathematical models that may not predict future performance. All investments carry risk, including the potential loss of principal. Past performance does not guarantee future results. Before making any investment decisions, please consult with a qualified financial advisor who can assess your individual circumstances, risk tolerance, and financial goals. The metrics and calculations discussed in this article are tools for analysis but should not be the sole basis for investment decisions.
About the Author
Max Fonji is a financial educator and investment strategist with over 15 years of experience helping everyday investors build wealth through evidence-based strategies. After working in portfolio management at a major investment firm, Max founded TheRichGuyMath.com to make sophisticated financial concepts accessible to beginners. He holds a degree in Finance and is passionate about teaching risk management, portfolio optimization, and long-term wealth building. When not analyzing markets, Max enjoys hiking, reading behavioral economics research, and teaching his own kids about money.
