Picture this: Two coffee shops sit side by side on the same street. Both generate $500,000 in annual sales. Yet one owner drives a Tesla while the other struggles to pay rent. What’s the difference? Profit efficiency, and that’s exactly what Return on Sales reveals.
In the world of business metrics and investing, understanding how much profit a company squeezes from every dollar of sales can mean the difference between picking a winner and backing a loser. Whether you’re analyzing stocks, running your own business, or simply trying to understand why the stock market behaves the way it does, Return on Sales is your financial magnifying glass.
TL;DR Summary
Return on Sales (ROS) measures how much operating profit a company generates per dollar of revenue—calculated as Operating Profit ÷ Net Sales × 100.
A higher ROS percentage indicates better operational efficiency and stronger pricing power, typically ranging from 5% to 20% depending on the industry.
ROS differs from profit margin by focusing specifically on operating profit, excluding interest and taxes, giving a clearer picture of core business performance.
Investors use ROS to compare companies within the same industry and identify businesses with sustainable competitive advantages.
Common mistakes include comparing ROS across different industries without context and ignoring trends over time in favor of single-period snapshots.
What Is Return on Sales? A Clear Definition
In simple terms, Return on Sales (ROS) means the percentage of revenue that becomes operating profit after covering the cost of running the business.
Return on Sales is a profitability ratio that measures how efficiently a company converts sales into operating profits. Think of it as a report card for management’s ability to control costs while generating revenue. Unlike net profit margin, which includes all expenses and income sources, ROS focuses specifically on operating performance, the core business activities.
For example, if a company has $1 million in sales and generates $150,000 in operating profit, its Return on Sales is 15%. This means that for every dollar customers spend, the company keeps 15 cents as operating profit before paying interest and taxes.
Why Return on Sales Matters to Investors
When you’re evaluating potential investments or learning about smart ways to make passive income, ROS serves several critical purposes:
Operational Health Check
ROS strips away the noise of financing decisions and tax strategies to reveal how well a company’s core business performs. A declining ROS often signals pricing pressure, rising costs, or a weakening competitive position.
Comparison Tool
Within the same industry, ROS allows apples-to-apples comparisons between competitors. A retailer with 8% ROS likely operates more efficiently than one with 3% ROS.
Early Warning System
Deteriorating ROS can predict trouble before it hits the bottom line. Many companies that eventually face serious financial difficulties show declining ROS quarters before the crisis becomes obvious.
Management Effectiveness
ROS reflects how well management controls operating expenses, negotiates with suppliers, and maintains pricing power, all crucial for long-term success.
The Return on Sales Formula Explained
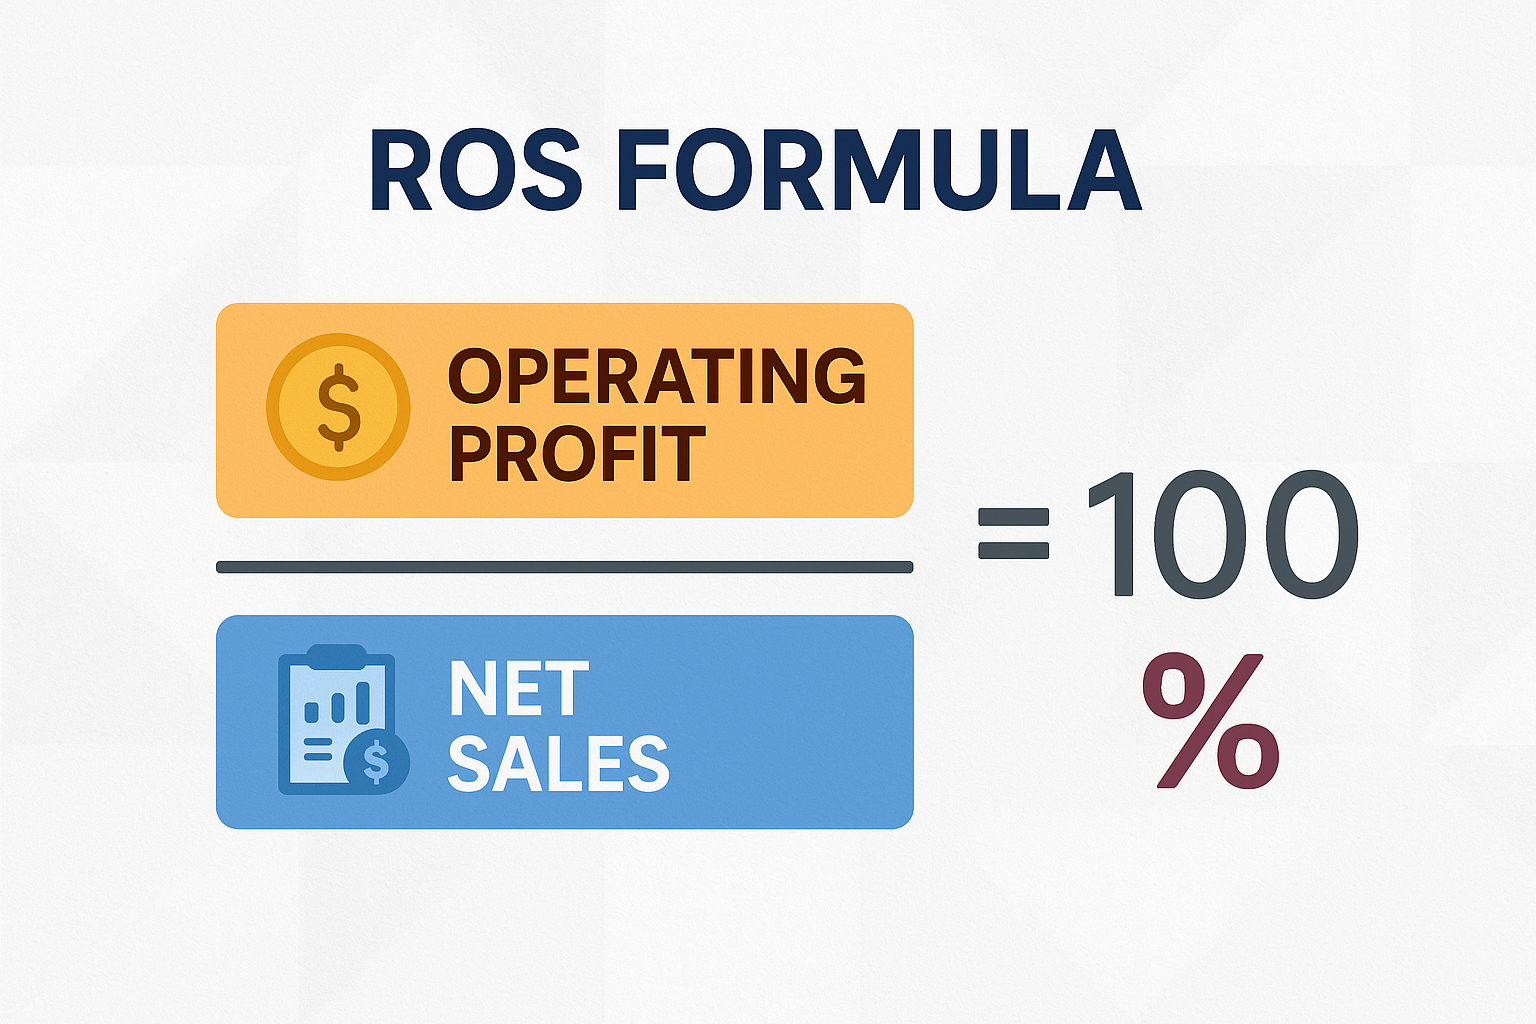
The formula for Return on Sales is refreshingly simple:
ROS = (Operating Profit ÷ Net Sales) × 100
Let’s break down each component:
Operating Profit (Operating Income)
Operating profit represents earnings from core business operations before interest and taxes. It’s calculated as:
Operating Profit = Gross Profit – Operating Expenses
Or alternatively:
Operating Profit = Revenue – Cost of Goods Sold – Operating Expenses
Operating expenses include items like:
- Salaries and wages
- Rent and utilities
- Marketing and advertising
- Research and development
- Administrative costs
- Depreciation and amortization
Net Sales (Revenue)
Net sales represent total revenue from goods or services sold, minus returns, allowances, and discounts. This is typically the top line on an income statement.
Why Multiply by 100?
Multiplying by 100 converts the decimal result into a percentage, making it easier to interpret and compare. A ROS of 0.12 becomes 12%, which clearly communicates that 12% of every sales dollar becomes operating profit.
Step-by-Step ROS Calculation Example
Let’s walk through a real-world example using a fictional company called “TechGadget Inc.”
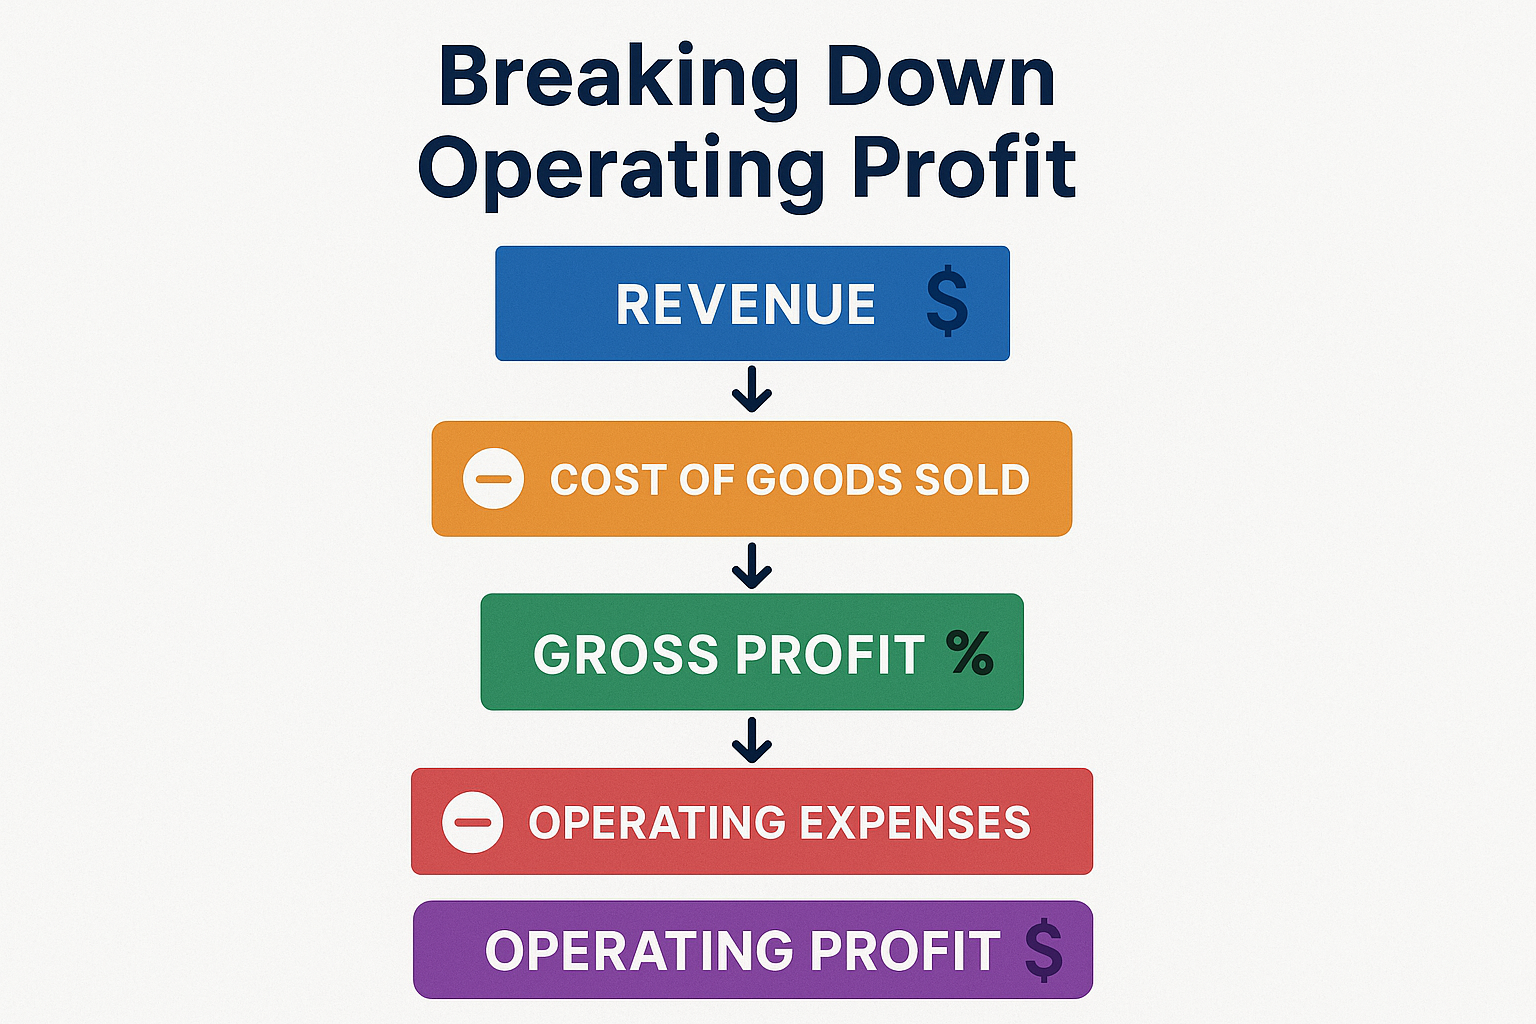
TechGadget Inc. – Annual Financial Data:
- Total Revenue: $5,000,000
- Cost of Goods Sold: $2,000,000
- Operating Expenses: $1,800,000
Step 1: Calculate Gross Profit
Gross Profit = Revenue – Cost of Goods Sold
Gross Profit = $5,000,000 – $2,000,000 = $3,000,000
Step 2: Calculate Operating Profit
Operating Profit = Gross Profit – Operating Expenses
Operating Profit = $3,000,000 – $1,800,000 = $1,200,000
Step 3: Apply the ROS Formula
ROS = (Operating Profit ÷ Net Sales) × 100
ROS = ($1,200,000 ÷ $5,000,000) × 100
ROS = 24%
This means TechGadget Inc. converts 24% of its revenue into operating profit—a strong performance, particularly if it’s in a competitive industry.
Interactive ROS Calculator
📊 Return on Sales Calculator
Calculate your ROS and understand your operational efficiency
Your Return on Sales
Real-World Example: Comparing Two Retailers
Let’s examine two actual retail companies to see how ROS provides valuable insights:
Company A: Premium Retailer
- Annual Revenue: $10,000,000
- Cost of Goods Sold: $4,000,000
- Operating Expenses: $4,500,000
- Operating Profit: $1,500,000
- ROS: 15%
Company B: Discount Retailer
- Annual Revenue: $10,000,000
- Cost of Goods Sold: $7,000,000
- Operating Expenses: $2,500,000
- Operating Profit: $500,000
- ROS: 5%
Despite identical revenue, Company A demonstrates superior operational efficiency with a 15% ROS compared to Company B’s 5%. Company A achieves this through:
- Higher margins on premium products
- Better pricing power due to brand strength
- More efficient operations despite higher operating expenses
However, this doesn’t automatically make Company A the better investment. Company B might have:
- Higher sales volume and faster inventory turnover
- Greater scalability with its low-cost model
- Stronger market position in the growing discount segment
This illustrates why ROS must be analyzed within a proper context, similar to how understanding the cycle of market emotions helps investors make better decisions.
ROS vs Other Profitability Metrics
Understanding how Return on Sales differs from related metrics helps investors build a complete picture of company performance.
| Metric | Formula | What It Measures | Key Difference |
|---|---|---|---|
| Return on Sales (ROS) | (Operating Profit ÷ Revenue) × 100 | Operating efficiency | Focuses on core operations only |
| Net Profit Margin | (Net Income ÷ Revenue) × 100 | Overall profitability | Includes all expenses, interest, and taxes |
| Gross Profit Margin | (Gross Profit ÷ Revenue) × 100 | Production efficiency | Only considers COGS, not operating expenses |
| Return on Assets (ROA) | (Net Income ÷ Total Assets) × 100 | Asset utilization | Measures profit relative to asset base |
| Return on Equity (ROE) | (Net Income ÷ Shareholders’ Equity) × 100 | Shareholder returns | Shows return on invested capital |
When to Use Each Metric
Use ROS when:
- Comparing operational efficiency between competitors
- Evaluating management’s cost control effectiveness
- Analyzing core business performance trends
- Assessing pricing power and competitive position
Use Net Profit Margin when:
- You need the complete profitability picture
- Tax efficiency matters to your analysis
- Comparing companies with different capital structures
- Evaluating overall business sustainability
Use Gross Profit Margin when:
- Analyzing production or procurement efficiency
- Comparing companies in manufacturing or retail
- Evaluating pricing strategies before operating costs
- Assessing vulnerability to commodity price changes
What Is a Good Return on Sales?
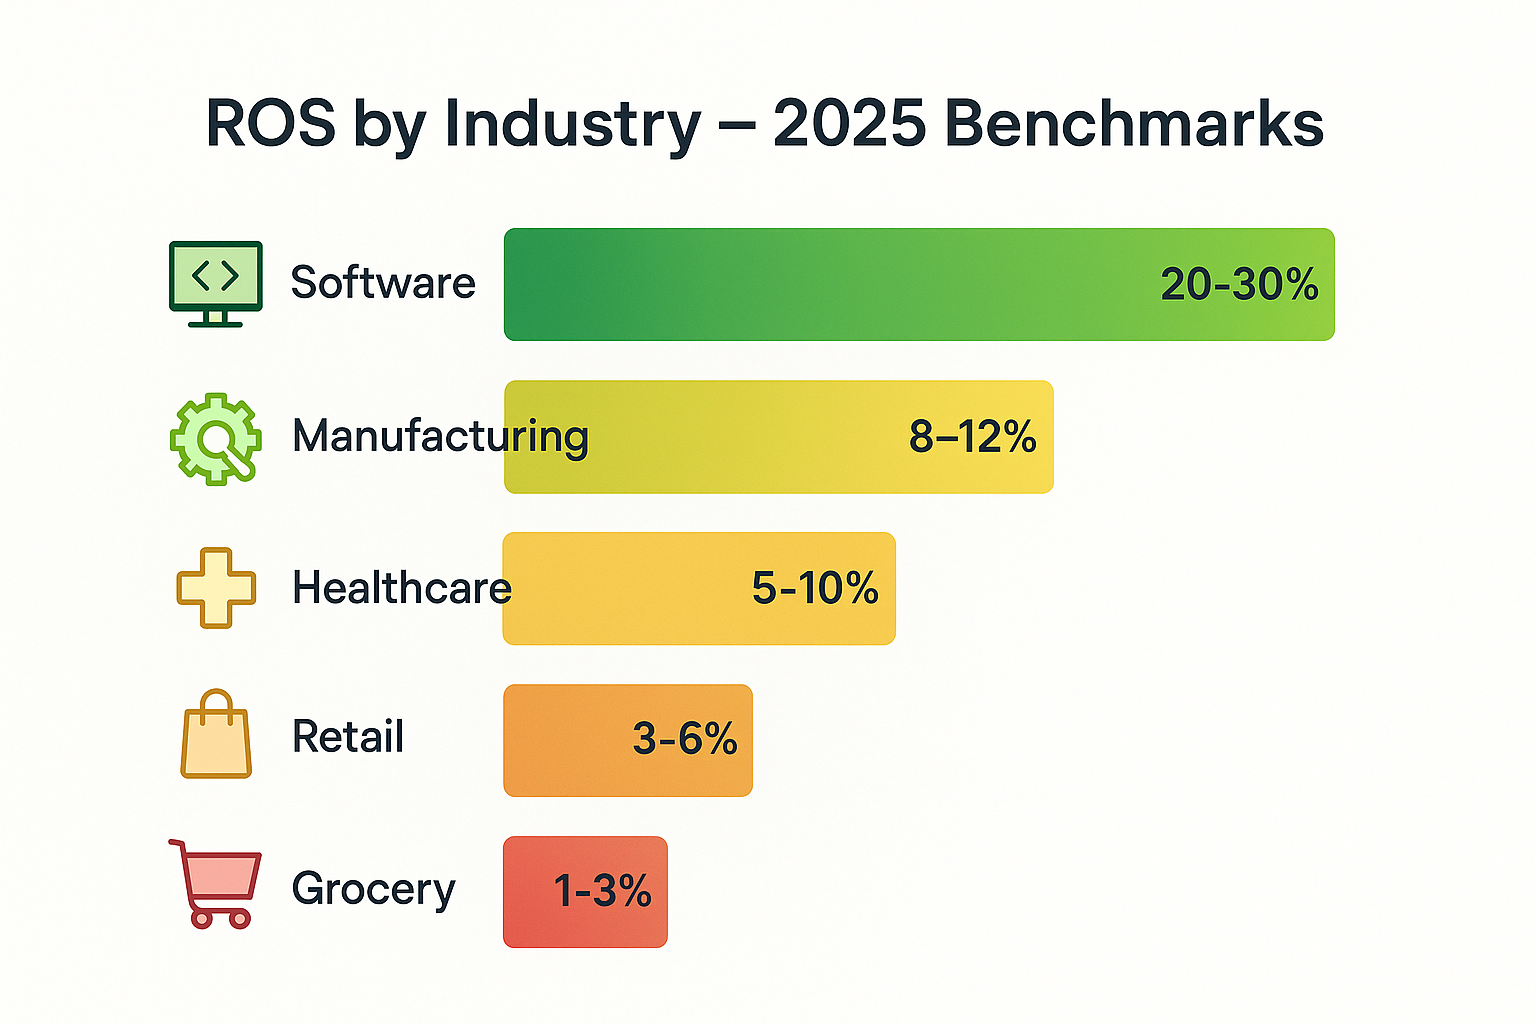
The million-dollar question: what ROS should you look for? The answer depends entirely on industry context.
Industry Benchmarks (2025 Averages)
High ROS Industries (15%+):
- Software and SaaS companies: 20-30%
- Pharmaceutical companies: 15-25%
- Financial services: 15-20%
- Professional services: 15-25%
Moderate ROS Industries (5-15%):
- Manufacturing: 8-12%
- Healthcare providers: 5-10%
- Telecommunications: 10-15%
- Technology hardware: 8-15%
Low ROS Industries (Below 5%):
- Grocery stores: 1-3%
- Airlines: 2-5%
- Restaurants: 3-6%
- Automotive retail: 2-4%
Why Such Dramatic Differences?
Capital Intensity
Industries requiring massive physical infrastructure (airlines, manufacturing) naturally have lower ROS due to higher operating costs.
Business Model
High-volume, low-margin businesses (grocery stores) intentionally operate with thin ROS but compensate through rapid inventory turnover.
Competitive Dynamics
Highly competitive industries face pricing pressure that compresses margins, while businesses with strong moats maintain higher ROS.
Scalability
Software companies enjoy high ROS because adding new customers requires minimal additional cost—pure digital leverage.
“Never compare a grocery store’s ROS to a software company’s ROS and conclude one is ‘better.’ You’re comparing apples to cloud computing platforms.” – Industry analyst wisdom
How to Interpret Return on Sales
Raw ROS numbers mean little without proper interpretation. Here’s how to extract meaningful insights:
1. Trend Analysis Over Time
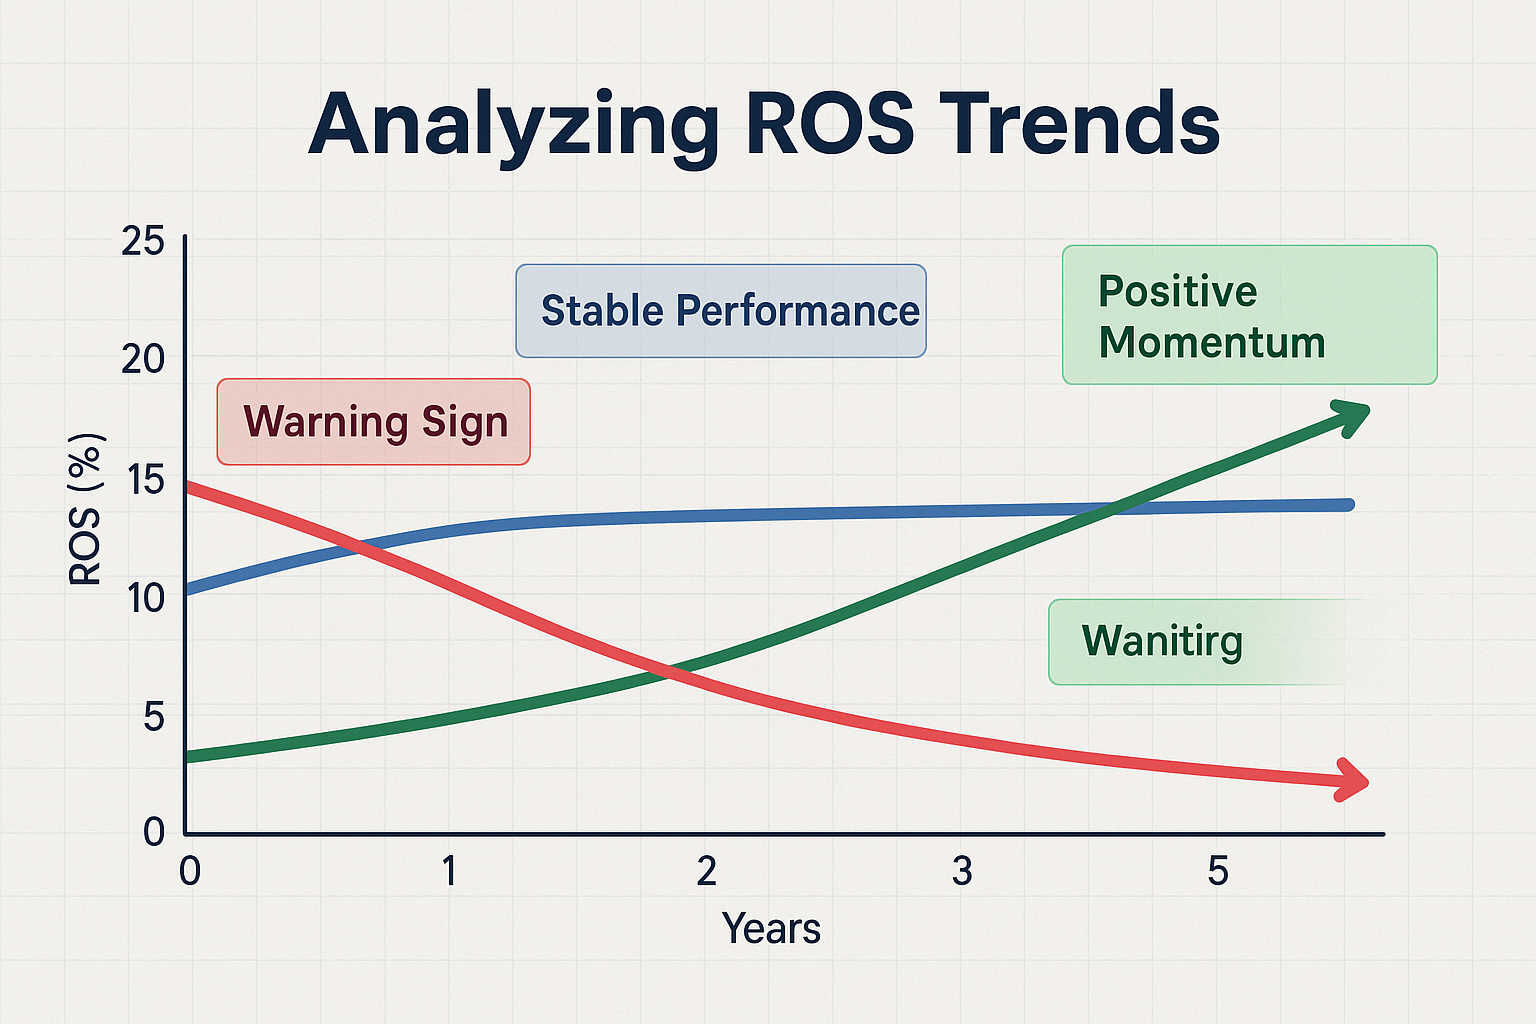
A single ROS snapshot tells you where a company stands today. Tracking ROS over multiple quarters or years reveals the trajectory, far more valuable for investment decisions.
Improving ROS Trend:
- Management successfully controls costs
- Strengthening pricing power
- Operational efficiency gains
- Potentially a good investment signal
Declining ROS Trend:
- Rising competitive pressure
- Losing pricing power
- Cost inflation outpacing revenue growth
- Warning sign requiring further investigation
Example:
Company XYZ’s ROS progression: Q1 2023: 8% → Q2 2023: 9% → Q3 2023: 10% → Q4 2023: 11% → Q1 2024: 12%
This consistent improvement suggests management is executing well and the business is strengthening, much more meaningful than knowing ROS is “12%” today.
2. Peer Comparison Within Industry
Compare companies operating in the same sector to identify leaders and laggards.
Three Restaurant Chains:
- Chain A: ROS = 8%
- Chain B: ROS = 5%
- Chain C: ROS = 3%
Chain A demonstrates superior operational efficiency. Investigate what they’re doing differently:
- Better supplier relationships?
- More efficient labor management?
- Premium pricing supported by brand strength?
- Superior location selection?
This analysis helps identify companies with sustainable competitive advantages—exactly what long-term investors seek when building passive income through dividend investing.
3. Economic Cycle Context
ROS behavior during economic cycles reveals business resilience:
Recession-Resistant ROS:
Companies maintaining stable ROS during downturns demonstrate pricing power and essential product positioning.
Cyclical ROS:
Companies whose ROS swings wildly with economic conditions face a higher risk but may offer greater upside during recoveries.
4. Scale Considerations
Larger companies often achieve higher ROS through:
- Economies of scale in purchasing
- Operational efficiency from standardization
- Greater bargaining power with suppliers
- Ability to invest in automation
However, smaller companies might show higher ROS through:
- Niche market positioning
- Premium pricing in specialized segments
- Lower overhead without bureaucracy
- More agile cost management
Advantages of Using Return on Sales
Simplicity and Clarity
ROS uses readily available financial statement data—no complex adjustments or specialized knowledge required. Anyone can calculate it from a company’s income statement.
Operational Focus
By excluding financing decisions (interest) and tax strategies, ROS isolates how well management runs the actual business. This makes it harder for companies to mask operational weakness.
Cross-Company Comparison
Within an industry, ROS enables direct comparisons regardless of company size, capital structure, or tax jurisdiction.
Early Warning Indicator
Deteriorating ROS often precedes more serious problems, giving investors time to reassess positions before major losses occur.
Management Accountability
ROS directly reflects decision management controls, pricing, cost structure, and operational efficiency. It’s harder to blame external factors.
Limitations and Common Mistakes
Industry Context Ignored
The Mistake:
Comparing ROS across different industries without context.
Why It Matters:
A grocery chain with 2% ROS might be performing excellently, while a software company with 10% ROS might be struggling. Industry economics fundamentally differ.
The Fix:
Always compare within industry peer groups and understand typical ranges for that sector.
Single-Period Analysis
The Mistake:
Making decisions based on one quarter’s ROS without examining trends.
Why It Matters:
One-time events, seasonal variations, or temporary cost spikes can distort any single period. You might mistake an anomaly for a trend.
The Fix:
Examine at least 3-5 years of ROS data to identify genuine patterns versus noise.
Ignoring Growth Context
The Mistake:
Favoring high ROS without considering growth rates.
Why It Matters:
A company with 20% ROS and 2% revenue growth might be less attractive than one with 12% ROS and 30% revenue growth. The latter is investing in expansion that temporarily compresses margins.
The Fix:
Balance ROS analysis with revenue growth, market share trends, and strategic investments.
Accounting Manipulation Blindness
The Mistake:
Accepting ROS at face value without questioning accounting choices.
Why It Matters:
Companies can temporarily boost ROS through:
- Aggressive revenue recognition
- Capitalizing expenses that should be expensed
- Cutting essential R&D or maintenance
- One-time asset sales
The Fix:
Read footnotes, compare cash flow to operating profit, and watch for unusual accounting changes. This is why understanding why people lose money in the stock market often comes down to not doing proper due diligence.
Capital Intensity Ignored
The Mistake:
Using ROS alone without considering capital requirements.
Why It Matters:
A business with 15% ROS requiring $100 million in equipment for every $10 million in revenue differs dramatically from one with 15% ROS requiring minimal capital.
The Fix:
Combine ROS with Return on Assets (ROA) and Return on Invested Capital (ROIC) for capital-intensive businesses.
How Investors Use ROS in Decision-Making
Stock Screening and Selection
Many investors incorporate ROS into multi-factor screening strategies:
Quality Screen Example:
- ROS > 10% (industry-adjusted)
- ROS has been improving over the past 3 years
- ROS consistently above industry median
- Combine with dividend yield > 2%
This approach helps identify high-quality companies that might become high dividend stocks with sustainable payouts.
Competitive Moat Assessment
Warren Buffett famously seeks companies with “economic moats”, sustainable competitive advantages. Consistently superior ROS versus peers often signals moat presence:
Strong Moat Indicators:
- ROS 5+ percentage points above industry average
- Stable or improving ROS over 10+ years
- ROS is maintained during industry downturns
- Pricing power demonstrated by stable ROS despite input cost increases
Turnaround Identification
Value investors hunting turnaround candidates examine ROS trends:
Turnaround Signal:
- ROS historically 12-15%, currently 6-8%
- New management team with operational expertise
- Clear plan to cut costs or improve pricing
- Industry conditions are stabilizing or improving
If the turnaround succeeds and ROS returns to historical levels, stock prices often follow—sometimes dramatically.
Risk Assessment
Declining ROS raises red flags about business health:
Warning Signs:
- ROS declining 3+ consecutive quarters
- ROS falling below the industry average after years of leadership
- Management is unable to explain the ROS deterioration clearly
- ROS decline accompanied by rising debt levels
These signals suggest it’s time to review your investment thesis carefully, similar to how understanding smart moves in investing requires constant vigilance.
Improving Return on Sales: Management Strategies
For business owners and managers (or investors evaluating management quality), several strategies can improve ROS:
Revenue Enhancement Strategies
1. Premium Pricing
Strengthen brand value to support higher prices without losing volume. Apple exemplifies this, charging premium prices while maintaining strong ROS.
2. Product Mix Optimization
Shift sales toward higher-margin products or services. Many retailers improve ROS by expanding private-label offerings.
3. Customer Segmentation
Focus on the most profitable customer segments and reduce resources devoted to low-margin accounts.
Cost Reduction Strategies
4. Supply Chain Efficiency
Negotiate better supplier terms, reduce inventory carrying costs, and optimize logistics. Walmart’s legendary supply chain prowess supports industry-leading ROS despite discount pricing.
5. Process Automation
Invest in technology to reduce labor costs and improve productivity. Initial investments may temporarily reduce ROS, but long-term benefits can be substantial.
6. Overhead Reduction
Eliminate redundant administrative functions, consolidate facilities, and streamline organizational structure.
Operational Excellence Strategies
7. Lean Manufacturing
Implement continuous improvement methodologies to eliminate waste and improve efficiency.
8. Employee Productivity
Invest in training, better tools, and incentive alignment to boost output per employee.
9. Strategic Outsourcing
Outsource non-core functions where specialists can deliver better economics than internal operations.
ROS in Different Business Contexts
Startups and High-Growth Companies
Early-stage companies often show negative or very low ROS intentionally:
- Investing heavily in customer acquisition
- Building infrastructure for future scale
- Prioritizing market share over profitability
- Developing product capabilities
What to Watch:
The path to positive ROS. Does management have a credible plan to achieve profitability? Are unit economics improving even if overall ROS remains negative?
Amazon famously operated with minimal or negative ROS for years while building its empire. Investors who understood the strategy and long-term potential were richly rewarded, a lesson in how making your kid a millionaire requires sometimes looking beyond immediate profitability.
Mature Companies
Established businesses should demonstrate:
- Stable or improving ROS over time
- ROS at or above industry average
- Predictable seasonal patterns in ROS
- Resilience during economic downturns
Declining ROS in mature companies is particularly concerning; it suggests losing competitive position, not investing in growth.
Turnaround Situations
Companies in distress often show:
- Sharply declining ROS below historical levels
- ROS below industry peers
- High variability quarter to quarter
Successful turnarounds typically show:
- ROS stabilization first (bleeding stops)
- Gradual improvement over 2-4 quarters
- Sustainable gains that hold for multiple periods
Case Study: Tech Company ROS Analysis
Let’s examine a realistic scenario showing ROS in action.
CloudTech Solutions – 5-Year ROS History:
| Year | Revenue | Operating Profit | ROS | Industry Avg ROS |
|---|---|---|---|---|
| 2020 | $50M | $8M | 16% | 18% |
| 2021 | $75M | $15M | 20% | 18% |
| 2022 | $110M | $24.2M | 22% | 19% |
| 2023 | $145M | $31.9M | 22% | 19% |
| 2024 | $180M | $39.6M | 22% | 20% |
Analysis:
Positive Signals:
- ROS improved from below industry average (16%) to above (22%)
- ROS stabilized at a healthy level while revenue grew 260%
- Maintained ROS during rapid scaling (often difficult)
- Consistent execution over multiple years
Questions to Investigate:
- Can they maintain 22% ROS as they mature?
- What’s driving superior ROS vs. peers?
- Are they sacrificing growth investments to maintain ROS?
- How does their ROS compare to industry leaders?
Investment Thesis:
CloudTech demonstrates strong operational execution by improving efficiency during the growth phase. The sustained ROS above industry average suggests competitive advantages in either pricing power or cost structure. This could be an attractive stock market investment for quality-focused portfolios.
FAQ
A good ROS percentage varies dramatically by industry. Software companies might target 20-30% ROS, while grocery stores operate successfully at 1-3% ROS. Within your industry, aim for ROS at or above the median of successful competitors. Generally, any ROS above 10% indicates healthy operational efficiency, but always compare to industry benchmarks.
Return on Sales (ROS) measures operating profit as a percentage of revenue, focusing specifically on operational efficiency before interest and taxes. Net profit margin measures net income (after all expenses, including interest and taxes) as a percentage of revenue, showing overall profitability. ROS isolates core business performance, while profit margin includes financing and tax effects.
Yes, ROS can be negative when operating expenses exceed gross profit, resulting in operating losses. This is common for startups investing heavily in growth or companies facing serious operational challenges. Negative ROS isn’t automatically bad for early-stage companies, but it’s concerning for established businesses and requires a clear path to profitability.
For investors, calculate ROS quarterly when companies report earnings to track trends. For business owners, monthly ROS calculations help identify issues quickly and monitor improvement initiatives. Always examine ROS trends over at least 3-5 years rather than focusing on single periods.
ROS declines when operating profit grows more slowly than revenue or decreases entirely. Common causes include: rising input costs without pricing power, increased competition forcing price cuts, operational inefficiencies, higher labor costs, expanding into lower-margin products, or investing heavily in growth initiatives. Distinguishing between strategic investments (temporary) and structural problems (permanent) is crucial.
Not necessarily. Extremely high ROS might indicate underinvestment in growth, R&D, or customer acquisition. A company with 30% ROS but 0% revenue growth might be less attractive than one with 15% ROS and 25% revenue growth. Balance ROS with growth rates, market position, and long-term strategic investments. Additionally, unsustainably high ROS might attract competitors or face regulatory scrutiny.
Calculate ROS from publicly available financial statements. Most companies report operating income (operating profit) and revenue in their quarterly and annual reports filed with the SEC. You can access these through the company’s investor relations website, SEC.gov (search EDGAR database), or financial data platforms like Yahoo Finance, Bloomberg, or Morningstar. Simply divide operating income by revenue and multiply by 100.
Conclusion: Making Return on Sales Work for You
Return on Sales isn’t just another financial ratio to memorize; it’s a powerful lens for understanding business quality, operational efficiency, and competitive positioning. Whether you’re evaluating potential stock investments, running your own business, or simply building financial literacy, ROS provides clear insights into how effectively companies convert revenue into operating profit.
Remember the key principles:
Context is everything – Always compare ROS within industries, never across unrelated sectors
Trends matter more than snapshots – Track ROS over multiple periods to identify genuine patterns
Combine metrics wisely – Use ROS alongside growth rates, profit margins, and return on capital for complete analysis
Question the numbers – Understand what drives ROS changes and watch for accounting manipulation
Focus on sustainability – Sustainable competitive advantages show up as consistently superior ROS over the years
Your Action Steps
- For Investors: Add ROS to your stock analysis checklist. Screen for companies with industry-leading ROS that’s been stable or improving for 3+ years.
- For Business Owners: Calculate your monthly ROS and compare it to industry benchmarks. Identify your top three opportunities to improve ROS through either revenue enhancement or cost reduction.
- For Financial Learners: Practice calculating ROS using real company financial statements. Pick three companies in the same industry and compare their ROS trends over five years.
- For Everyone: Bookmark this guide and use the interactive calculator whenever you need to analyze ROS quickly.
The businesses that consistently deliver superior ROS typically share common traits: strong brands, operational excellence, pricing power, and disciplined management. These are precisely the qualities that create smart passive income opportunities and long-term wealth.
Start incorporating Return on Sales into your financial analysis today. Whether you’re building a portfolio, running a business, or simply becoming more financially savvy, this metric will serve you well for decades to come.
References and Further Reading
For deeper exploration of Return on Sales and related financial concepts, consult these authoritative sources:
- U.S. Securities and Exchange Commission (SEC) – SEC.gov – Access company filings and financial statements
- CFA Institute – CFAInstitute.org – Professional standards for financial analysis
- Investopedia – Investopedia.com – Comprehensive financial education resources
- Morningstar – Morningstar.com – Investment research and company financial data
- Federal Reserve Economic Data (FRED) – FRED.stlouisfed.org – Economic data and industry statistics
Disclaimer
This article is for educational purposes only and does not constitute financial advice. Return on Sales is one of many metrics investors should consider when making investment decisions. Past performance does not guarantee future results. Always conduct thorough research and consider consulting with a qualified financial advisor before making investment decisions. The examples and case studies presented are hypothetical or simplified for educational purposes and may not reflect actual company performance.
About the Author
Written by Max Fonji — With a decade of experience in financial analysis and investing education, Max has helped thousands of readers understand complex financial concepts through clear, actionable guidance. As the founder of TheRichGuyMath.com, Max’s mission is to democratize financial knowledge and help everyday people build lasting wealth through informed decision-making.
Whether you’re taking your first steps in understanding the stock market or refining advanced investment strategies, TheRichGuyMath.com provides the tools, knowledge, and confidence you need to succeed.
