Imagine checking your investment portfolio and seeing your stock price has gone up 5%. You’re happy. But wait, did you remember to count the dividends you received throughout the year? What about those reinvested distributions from your mutual fund? This is where total return comes in, and understanding it could completely change how you evaluate your investment success.
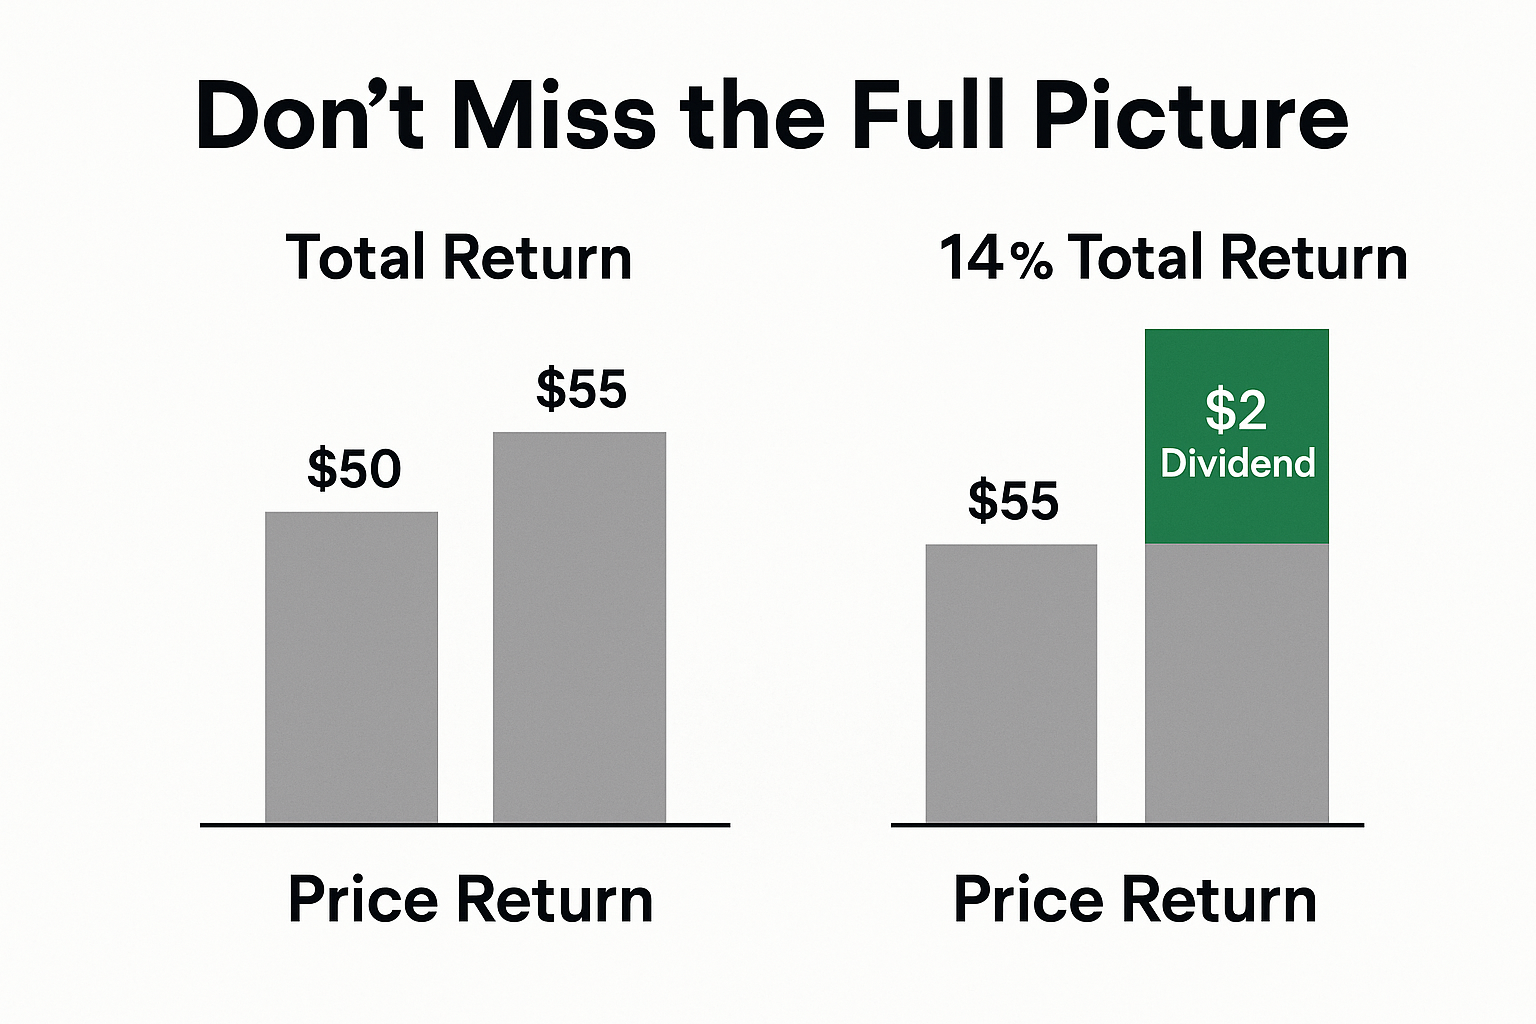
Most beginner investors make a critical mistake: they focus solely on price appreciation. They celebrate when a stock jumps from $50 to $55, but they ignore the $2 in dividends paid along the way. This narrow view can lead to poor investment decisions and missed opportunities. Total return gives you the complete picture of how your investment actually performed, and it’s the metric professional investors use to measure real success.
In simple terms, total return represents the complete gain or loss on an investment over a specific period, including both price changes and income distributions like dividends or interest.
Whether you’re just starting your investing journey or looking to sharpen your financial knowledge, mastering total return is essential for making smarter investment choices in 2025 and beyond.
Key Takeaways
Total return measures the complete performance of an investment by combining price appreciation and income (dividends, interest, or distributions)
Unlike simple price return, total return gives you the full picture of your investment gains or losses
The basic formula is: Total Return = (Ending Value – Beginning Value + Income) / Beginning Value × 100
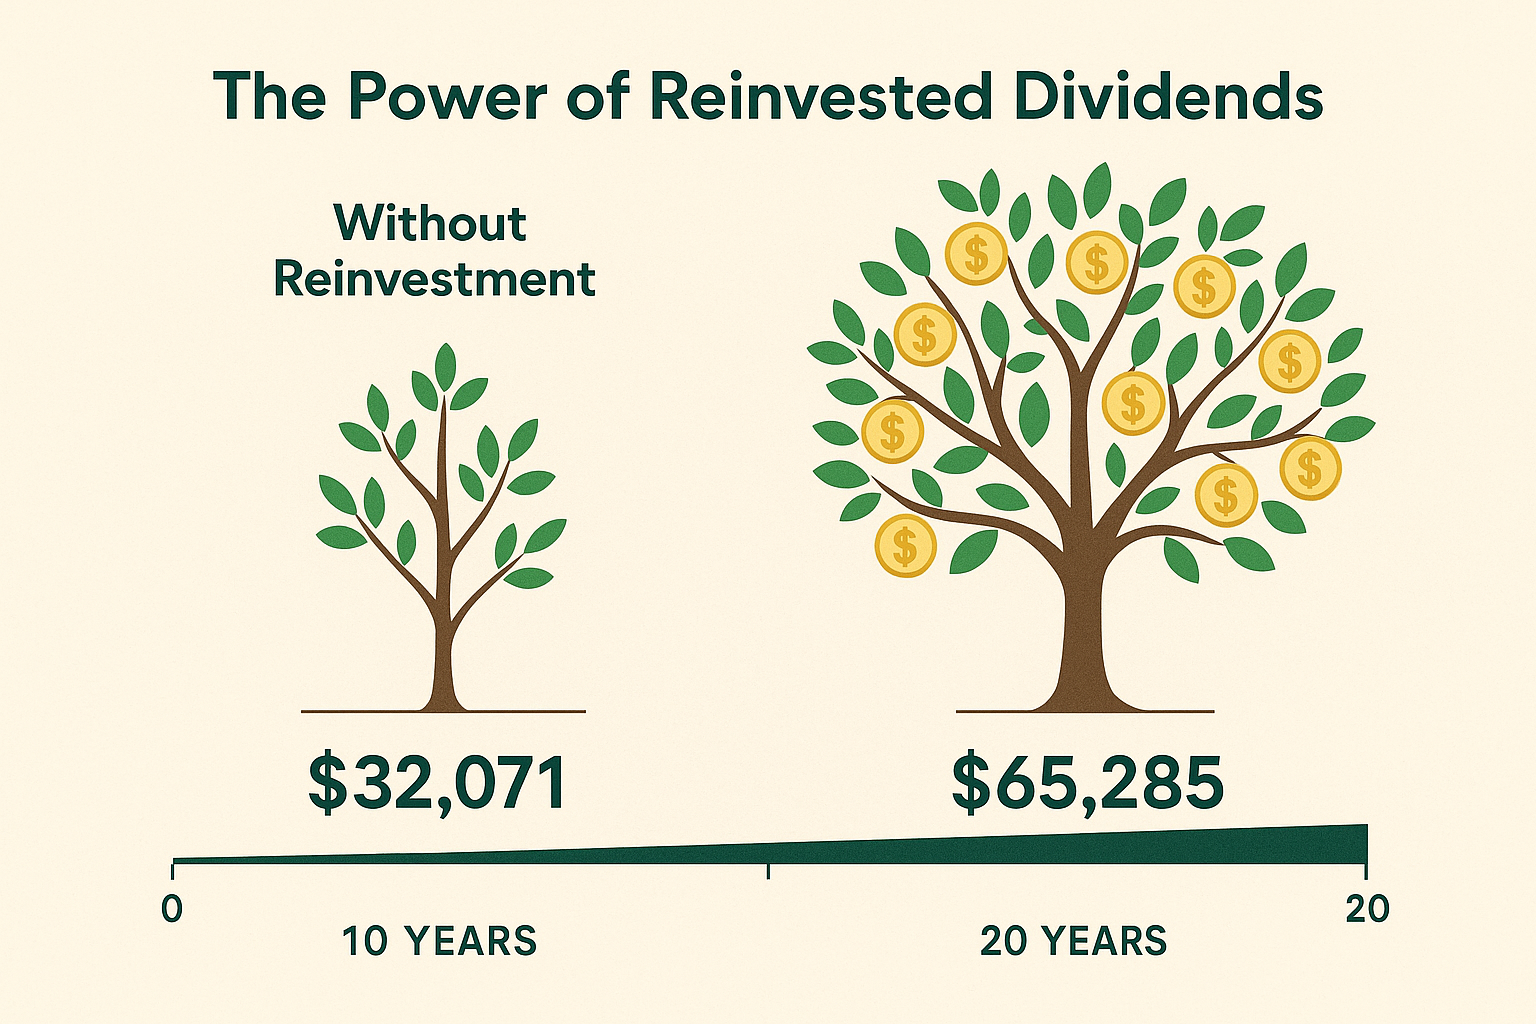
Reinvested dividends can dramatically increase your total return over time through the power of compounding
Professional investors and fund managers always use total return, not just price changes, to evaluate investment performance
What Is Total Return?
Total return is the actual rate of return on an investment over a given period, accounting for all sources of return, including capital gains, dividends, interest payments, and distributions.
Think of it this way: if you bought a rental property, you wouldn’t just measure your success by how much the property value increased. You’d also count the rent you collected each month, right? Total return applies the same logic to stocks, bonds, mutual funds, and other investments.
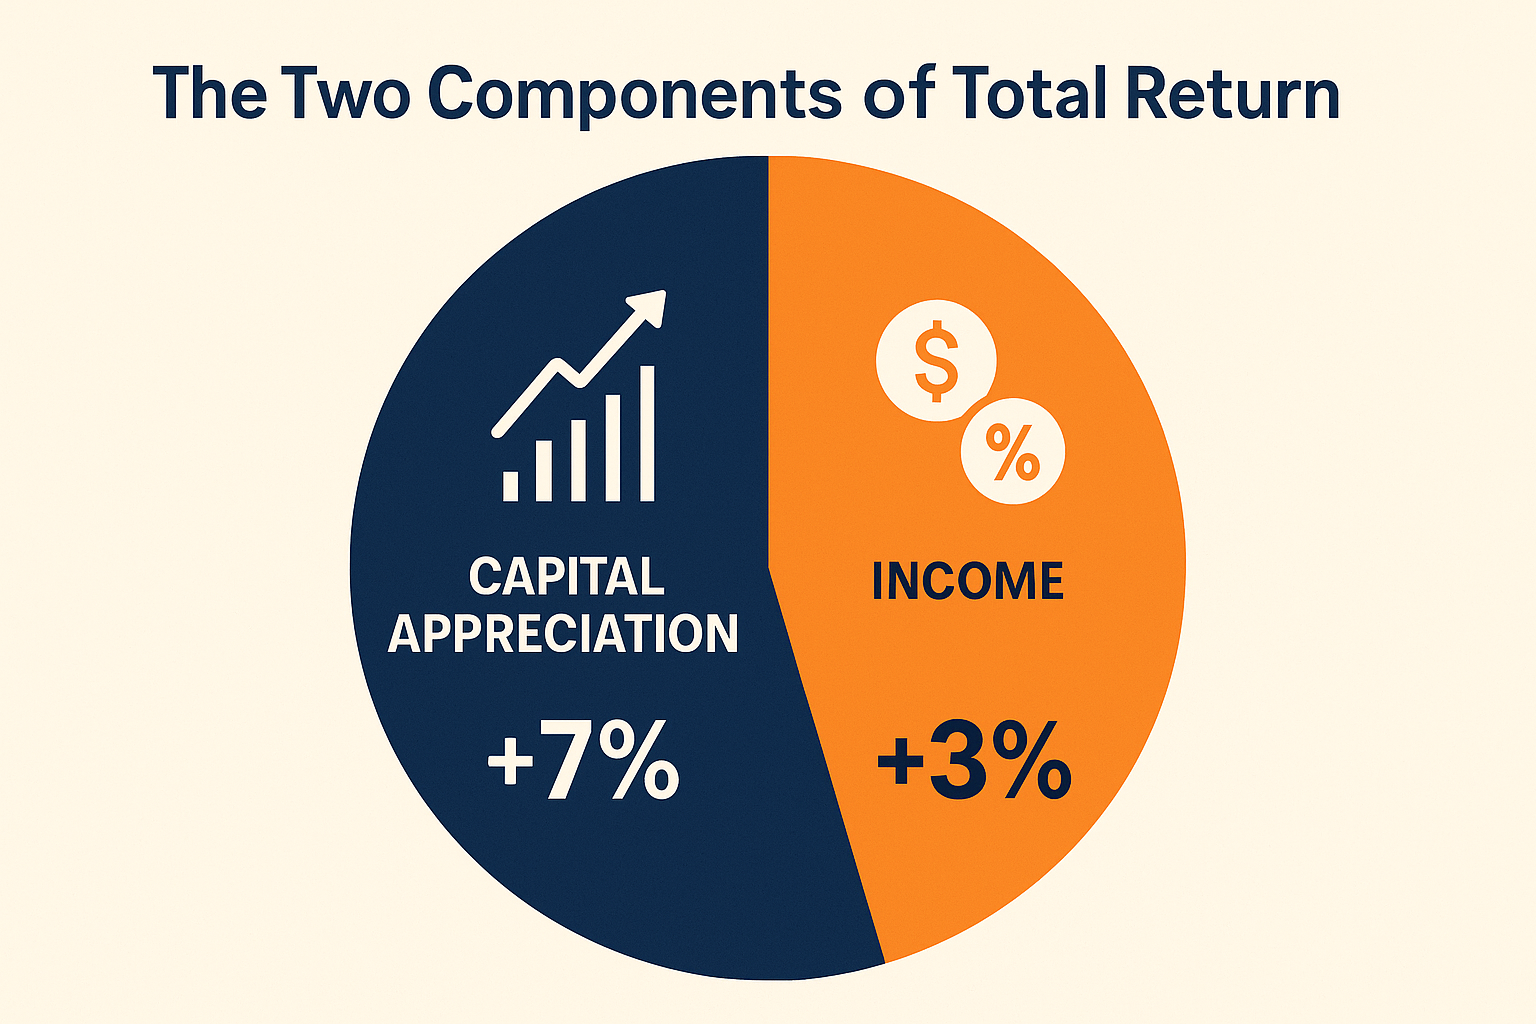
The Two Components of Total Return
Total return consists of two distinct parts:
- Capital Appreciation (or Depreciation): The change in the investment’s price or market value
- Income: Dividends from stocks, interest from bonds, or distributions from funds
Here’s a simple example: Sarah bought 100 shares of a dividend-paying stock at $50 per share in January 2024. By December 2024, the stock price rose to $55. During the year, she also received $2 per share in dividends.
- Price return: ($55 – $50) / $50 = 10%
- Dividend return: $2 / $50 = 4%
- Total return: 10% + 4% = 14%
If Sarah only looked at the stock price, she’d think she earned 10%. But her actual total return was 14%, a significant difference! This is why understanding how the stock market works requires looking beyond just price movements.
Why Total Return Matters More Than Price Return
According to research from Hartford Funds, reinvested dividends have accounted for approximately 40% of the S&P 500’s total return since 1930. That means investors who ignore dividends are missing nearly half the story!
This becomes especially important when comparing investments or evaluating fund managers. A stock that rises 8% with no dividends might actually underperform a stock that rises 5% but pays 4% in dividends (9% total return).
The Total Return Formula
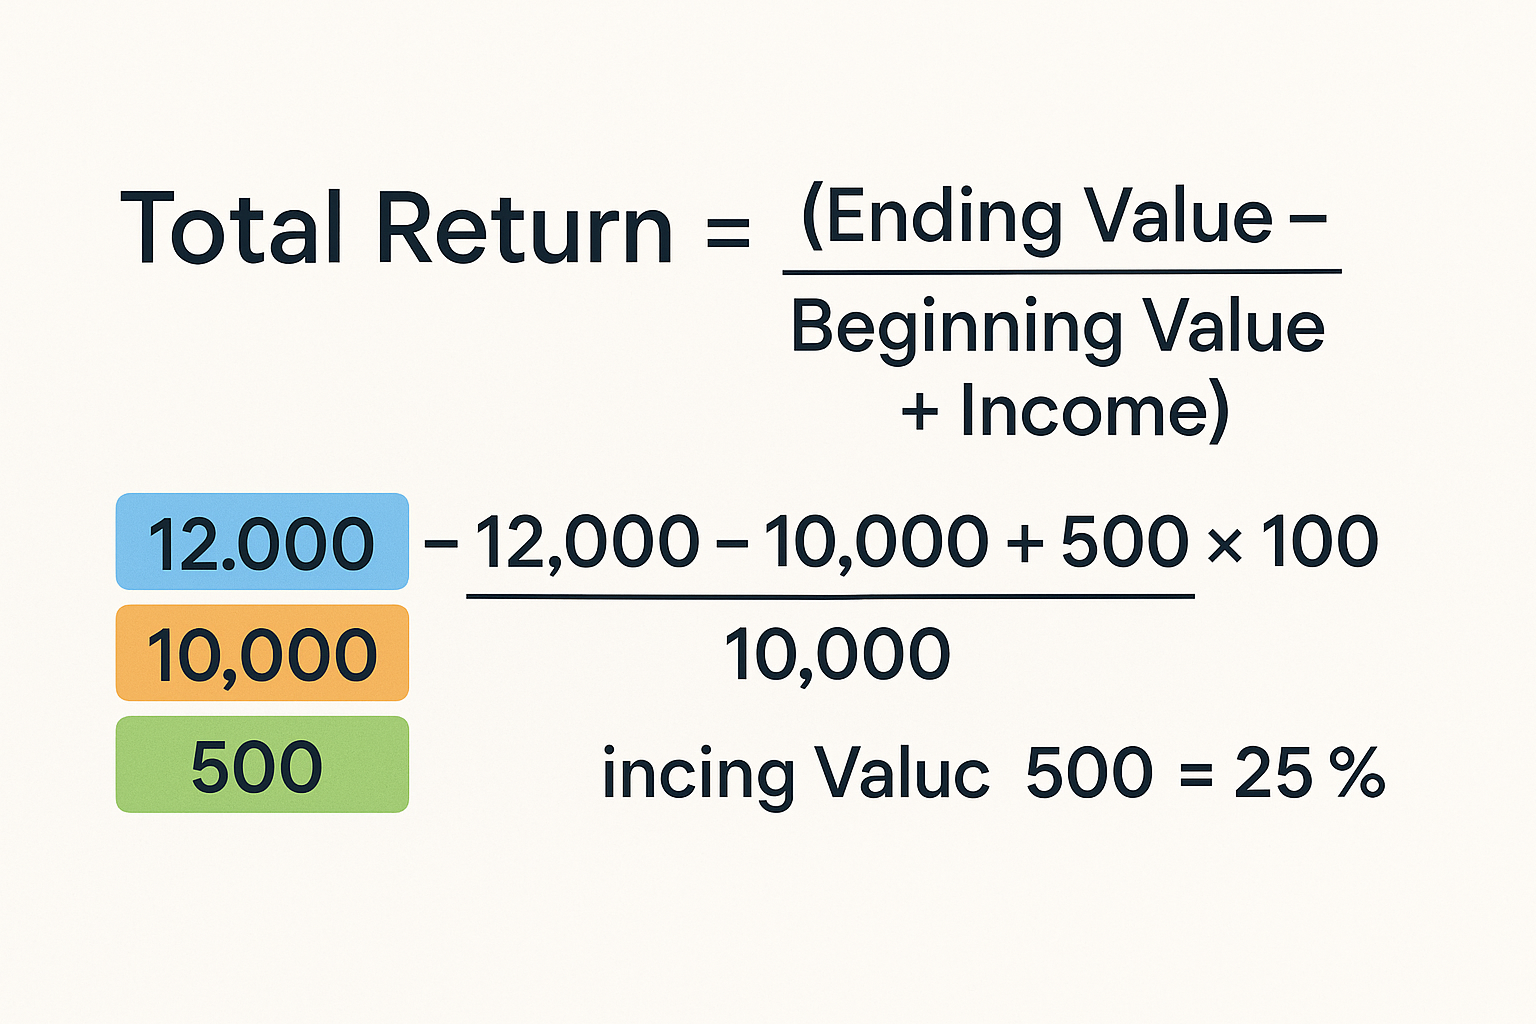
The standard formula for calculating total return is straightforward:
Total Return = [(Ending Value – Beginning Value + Income) / Beginning Value] × 100
Where:
- Ending Value = Current market value of the investment
- Beginning Value = Original purchase price or value at the start of the period
- Income = Dividends, interest, or distributions received during the period
Breaking Down the Formula
Let’s use a real-world scenario to understand each component:
Example: Marcus invested $10,000 in a mutual fund on January 1, 2024. By December 31, 2024:
- The fund’s value grew to $11,200
- He received $400 in dividend distributions
Calculation:
- Ending Value: $11,200
- Beginning Value: $10,000
- Income: $400
Total Return = [($11,200 – $10,000 + $400) / $10,000] × 100
Total Return = ($1,600 / $10,000) × 100
Total Return = 16%
If Marcus had only looked at the fund’s price appreciation, he would have calculated:
($11,200 – $10,000) / $10,000 × 100 = 12%
By including the $400 in distributions, he sees his actual return was 16%—a much better performance!
Total Return Formula Variations
Annualized Total Return
When comparing investments held for different time periods, you need to annualize the returns to make fair comparisons. The annualized total return formula is:
Annualized Total Return = [(1 + Total Return)^(1/n) – 1] × 100
Where n = number of years
Example: If an investment produced a 50% total return over 3 years:
Annualized Return = [(1 + 0.50)^(1/3) – 1] × 100
Annualized Return = [(1.50)^0.333 – 1] × 100
Annualized Return = [1.1447 – 1] × 100
Annualized Return = 14.47%
This tells you the investment grew at an average rate of 14.47% per year over the three years.
Total Return with Reinvested Dividends
Many investors automatically reinvest their dividends to purchase more shares. This creates a compounding effect that can significantly boost long-term returns, a key principle in dividend investing.
When dividends are reinvested, the calculation becomes more complex because you need to track:
- Additional shares purchased with each dividend payment
- The price at which those shares were purchased
- The final value of all shares (original + reinvested)
Simplified approach:
Total Return = [(Ending Total Value of All Shares – Original Investment) / Original Investment] × 100
Most brokerage platforms and financial websites calculate this automatically, showing you both price return and total return with dividends reinvested.
Real-World Total Return Examples
Example 1: Individual Stock Investment
Scenario: In January 2023, Jennifer bought 200 shares of Company XYZ at $75 per share ($15,000 total investment).
What happened in 2024:
- The stock price rose to $82 per share by December 2024
- The company paid quarterly dividends of $0.50 per share (4 quarters × $0.50 = $2 per share annually)
- Total dividends received: 200 shares × $2 = $400
Calculation:
- Ending Value: 200 shares × $82 = $16,400
- Beginning Value: $15,000
- Income: $400
Total Return = [($16,400 – $15,000 + $400) / $15,000] × 100
Total Return = ($1,800 / $15,000) × 100
Total Return = 12%
Breakdown:
- Price appreciation: ($82 – $75) / $75 = 9.33%
- Dividend yield: $2 / $75 = 2.67%
- Total return: 12%
Example 2: Bond Investment
Scenario: David purchased a corporate bond with a face value of $10,000 at par value (100% of face value).
Bond details:
- Purchase price: $10,000
- Annual coupon rate: 5%
- After one year, the bond’s market price rose to $10,300
Calculation:
- Ending Value: $10,300
- Beginning Value: $10,000
- Income (interest): $10,000 × 5% = $500
Total Return = [($10,300 – $10,000 + $500) / $10,000] × 100
Total Return = ($800 / $10,000) × 100
Total Return = 8%
The bond delivered 8% total return, combining 3% price appreciation and 5% interest income.
Example 3: Index Fund with Dividend Reinvestment
Scenario: Lisa invested $25,000 in an S&P 500 index fund on January 1, 2022, with automatic dividend reinvestment.
Three-year performance:
- By December 31, 2024, her account value grew to $32,750
- This includes all reinvested dividends
Calculation:
Total Return = [($32,750 – $25,000) / $25,000] × 100
Total Return = ($7,750 / $25,000) × 100
Total Return = 31%
Annualized:
Annualized Return = [(1.31)^(1/3) – 1] × 100 = 9.42% per year
This demonstrates the power of dividend reinvestment; those small quarterly dividends compounded over three years contributed significantly to Lisa’s total return.
Total Return vs Other Performance Metrics
Understanding how total return differs from other common metrics helps you evaluate investments more accurately.
| Metric | What It Measures | Includes Dividends/Income? | Best Used For |
|---|---|---|---|
| Total Return | Complete investment performance | Yes | Overall investment evaluation |
| Price Return | Change in market price only | No | Quick price movement check |
| Dividend Yield | Annual dividends as % of price | Only dividends | Income-focused investing |
| Capital Gains | Profit from selling at higher price | No | Tax planning |
| Real Return | Return adjusted for inflation | Yes (if using total return) | Purchasing power analysis |
| Risk-Adjusted Return | Return relative to risk taken | Profit from selling at a higher price | Comparing different risk levels |
Total Return vs. Absolute Return
Absolute return simply shows the percentage gain or loss without any benchmark comparison. Total return is a type of absolute return that includes all income sources.
Example: If your portfolio grew from $50,000 to $55,000 while earning $1,000 in dividends:
- Absolute return (price only): 10%
- Total return: 12%
Total Return vs Relative Return
Relative return compares your investment’s performance to a benchmark (like the S&P 500).
Example: Your stock fund achieved a 15% total return in 2024, while the S&P 500 returned 18%.
- Total return: +15% (good in isolation)
- Relative return: -3% (underperformed the market)
Both metrics matter. Total return tells you how much money you made; relative return tells you if you could have done better with a simple index fund. This is crucial when evaluating whether passive income strategies are working for you.
How to Calculate Total Return: Step-by-Step Guide
Let’s walk through a comprehensive example with multiple dividend payments.
Step 1: Gather Your Information
You need:
- Purchase date and price: When and how much you paid
- Current date and price: Current value of the investment
- All income received: Every dividend, interest payment, or distribution
- Any additional investments: If you added money during the period
Step 2: Calculate the Basic Components
Example: On March 1, 2024, you bought 500 shares of Tech Corp at $40 per share = $20,000 investment.
Dividends received in 2024:
- June 15: $0.30 per share = $150
- September 15: $0.30 per share = $150
- December 15: $0.35 per share = $175
- Total dividends: $475
Current situation (December 31, 2024):
- Stock price: $44 per share
- Total value: 500 × $44 = $22,000
Step 3: Apply the Formula
Total Return = [($22,000 – $20,000 + $475) / $20,000] × 100
Total Return = ($2,475 / $20,000) × 100
Total Return = 12.375%
Step 4: Verify Your Calculation
Double-check:
- Price gain: $22,000 – $20,000 = $2,000
- Dividend income: $475
- Total profit: $2,475
- Return percentage: $2,475 / $20,000 = 12.375%
Step 5: Annualize If Needed
Since you held the investment for 10 months (March 1 to December 31), you might want to see what this represents as an annual rate:
Months held: 10
Years: 10/12 = 0.833
Annualized Return = [(1 + 0.12375)^(1/0.833) – 1] × 100
Annualized Return = [(1.12375)^1.2 – 1] × 100
Annualized Return ≈ 15%
This means if the investment continued at this pace, you’d earn approximately 15% per year.
The Impact of Reinvested Dividends on Total Return
One of the most powerful aspects of total return investing is dividend reinvestment. Let’s see the dramatic difference it can make over time.
Scenario Comparison: Reinvested vs Cash Dividends
Initial investment: $10,000 in a dividend-paying stock
Annual dividend yield: 3%
Annual price appreciation: 7%
Time period: 20 years
Option A: Take dividends as cash
- Stock value after 20 years: $10,000 × (1.07)^20 = $38,697
- Dividends collected (assuming no growth): $10,000 × 3% × 20 = $6,000
- Total value: $44,697
- Total return: 347%
Option B: Reinvest all dividends
- Combined annual return: 10% (7% appreciation + 3% reinvested dividends)
- Final value: $10,000 × (1.10)^20 = $67,275
- Total return: 573%
Difference: $22,578 more with reinvestment!
This is why high dividend stocks with reinvestment can be such powerful wealth-building tools.
The Compounding Effect
When you reinvest dividends, you’re buying more shares. Those additional shares generate their own dividends, which buy even more shares. This creates a snowball effect that accelerates over time.
Year-by-year example (simplified):
- Year 1: 100 shares at $100 = $10,000, receive $300 dividend, buy 3 more shares
- Year 2: 103 shares at $107 = $11,021, receive $309 dividend, buy 2.9 more shares
- Year 3: 105.9 shares at $114.49 = $12,126, receive $318 dividend, buy 2.8 more shares
- And so on…
Each year, you own more shares that generate more dividends, which buy more shares. This is the mathematical magic behind long-term wealth creation.
Using Total Return to Make Investment Decisions
Understanding total return helps you make smarter choices across various investment scenarios.
Comparing Investment Options
When evaluating two investments, total return gives you an apples-to-apples comparison.
Example:
- Stock A: 12% price appreciation, 0% dividend yield = 12% total return
- Stock B: 8% price appreciation, 4% dividend yield = 12% total return
Both deliver the same total return, but they do it differently. Your choice might depend on:
- Tax situation: Qualified dividends may be taxed at lower rates than capital gains
- Income needs: If you need current income, Stock B provides cash flow
- Growth preference: If you’re reinvesting everything anyway, Stock A might have more growth potential
Evaluating Fund Managers
When choosing mutual funds or ETFs, always look at total return, not just how the fund’s price (NAV) changed.
Many investors make the mistake of comparing fund prices without considering distributions. A fund that pays regular distributions might have a lower price increase but a higher total return.
Red flag: If a fund’s total return significantly lags its benchmark’s total return over 3-5 years, it might be time to find a better option. This is a key insight when understanding why some people lose money in the stock market—they focus on the wrong metrics.
Setting Realistic Expectations
Historical total return data helps you set appropriate expectations:
Historical average annual total returns (according to various financial research):
- S&P 500: ~10-11% (including dividends)
- Investment-grade bonds: ~5-6%
- Real estate (REITs): ~9-11%
- Gold: ~7-8%
These are long-term averages. Individual years vary wildly, which is why understanding the cycle of market emotions is crucial for staying the course.
Rebalancing Your Portfolio
Total return helps you identify which assets have grown disproportionately and need rebalancing.
Example: You started with a 60/40 stock/bond allocation:
- Stocks returned 18% total return
- Bonds returned 4% total return
Your allocation has shifted to approximately 65/35. If you want to maintain your target allocation, you’d sell some stocks and buy bonds, essentially “selling high and buying low” automatically.
Common Mistakes When Calculating Total Return
Even experienced investors sometimes make errors when calculating or interpreting total return. Here are the most common pitfalls:
1: Forgetting About Dividends
The error: Only looking at price charts and ignoring dividend payments.
The fix: Always check if an investment pays dividends, interest, or distributions. Use sources that show “total return” charts, not just price charts.
Real impact: The difference between 6% and 9% annually might not sound huge, but over 30 years, $10,000 grows to:
- At 6%: $57,435
- At 9%: $132,677
That’s $75,242 you’d miss by ignoring dividends!
2: Ignoring Taxes and Fees
The error: Calculating total return without considering taxes on dividends or capital gains, and investment fees.
The fix: Calculate your “after-tax, after-fee” total return for a more accurate picture of your actual wealth growth.
Example:
- Gross total return: 10%
- Investment fees: 1%
- Tax on dividends and gains: 1.5%
- Net total return: 7.5%
This 2.5% difference compounds dramatically over time. This is why making smart financial moves includes minimizing fees and tax-efficient investing.
3: Not Accounting for Additional Contributions
The error: Adding money to an investment during the period and calculating total return as if it were all invested from the beginning.
The fix: Use a time-weighted return calculation or track your cost basis accurately.
Example:
- January: Invested $10,000
- June: Added $5,000 more
- December: Total value $16,200
Wrong calculation: ($16,200 – $15,000) / $15,000 = 8%
Right approach: Calculate the return for each period separately or use dollar-weighted return formulas that account for cash flows.
4: Comparing Returns Over Different Time Periods
The error: Saying “Investment A returned 30% over 3 years, Investment B returned 25% over 2 years, so A is better.”
The fix: Always annualize returns when comparing different time periods.
Correct comparison:
- Investment A: (1.30)^(1/3) – 1 = 9.14% annualized
- Investment B: (1.25)^(1/2) – 1 = 11.80% annualized
- Investment B actually performed better!
5: Confusing Total Return with Risk-Adjusted Return
The error: Choosing investments based solely on total return without considering the risk taken.
The fix: Consider volatility and risk-adjusted metrics like the Sharpe ratio.
Example:
- Investment A: 12% total return with 8% volatility
- Investment B: 15% total return with 25% volatility
Investment B has a higher total return but a much higher risk. Depending on your risk tolerance, A might be the better choice despite lower returns.
Total Return in Different Asset Classes
Total return calculations work across all investment types, but the components vary.
Stocks and Equity Funds
Components:
- Price appreciation/depreciation
- Cash dividends
- Stock dividends (additional shares)
- Special distributions
Example: A stock bought at $50, now at $58, has paid $2 in dividends
Total Return = [($58 – $50 + $2) / $50] × 100 = 20%
Bonds and Fixed Income
Components:
- Price changes (due to interest rate movements)
- Coupon payments (interest)
- Accrued interest if sold between payment dates
Example: A bond bought at $1,000, now worth $980, paid $40 in interest
Total Return = [($980 – $1,000 + $40) / $1,000] × 100 = 2%
Despite the price decline, the bond still delivered a positive total return due to interest payments.
Real Estate Investment Trusts (REITs)
Components:
- Share price changes
- Dividend distributions (REITs must distribute 90% of taxable income)
- Return of capital distributions
Example: REIT bought at $25, now at $27, paid $2 in dividends
Total Return = [($27 – $25 + $2) / $25] × 100 = 16%
REITs often provide high dividend yields, making total return significantly higher than price return alone.
Mutual Funds and ETFs
Components:
- Net Asset Value (NAV) changes
- Dividend distributions
- Capital gains distributions
- Return of capital
Important note: Mutual funds automatically reinvest distributions by default in many accounts, so your total return might already include these in the NAV if you check your account value.
Example: Fund NAV bought at $20, now at $22, paid $0.80 in distributions
Total Return = [($22 – $20 + $0.80) / $20] × 100 = 14%
Advanced Total Return Concepts
Time-Weighted Return vs Money-Weighted Return
When you make multiple investments over time, there are two ways to calculate total return:
Time-Weighted Return (TWR):
- Measures the compound rate of growth
- Eliminates the effect of cash flows
- Better for comparing investment managers
- Used by professional fund managers
Money-Weighted Return (MWR):
- Accounts for the timing and size of cash flows
- Reflects your actual personal return
- Also called Internal Rate of Return (IRR)
- Better for measuring your personal investment success
Example: You invested $10,000 in January at $50/share (200 shares). The price doubled to $100 by June. You added another $10,000 (100 more shares). By December, the price fell back to $75.
Time-weighted return: Focuses on the investment’s performance regardless of when you added money
- Period 1 (Jan-Jun): +100%
- Period 2 (Jun-Dec): -25%
- TWR = [(1 + 1.00) × (1 – 0.25)]^0.5 – 1 = 22.5%
Money-weighted return: Accounts for the fact that you invested more money right before the decline
- Total invested: $20,000
- Final value: 300 shares × $75 = $22,500
- MWR = ($22,500 / $20,000) – 1 = 12.5%
Your personal return (MWR) is lower because you invested more money at the peak. This shows why timing matters for your personal results, even if the investment itself performed well.
Real Return (Inflation-Adjusted Total Return)
Real return adjusts total return for inflation, showing your actual purchasing power gain.
Formula: Real Return ≈ Total Return – Inflation Rate
Example:
- Total return: 8%
- Inflation rate: 3%
- Real return: ~5%
Your investment grew 8%, but prices also rose 3%, so your purchasing power only increased by about 5%.
More precise formula: Real Return = [(1 + Total Return) / (1 + Inflation Rate)] – 1
Using the example above:
Real Return = [(1.08) / (1.03)] – 1 = 4.85%
This distinction becomes crucial over long periods. An investment returning 7% annually sounds good, but if inflation averages 4%, your real return is only about 3%.
Risk-Adjusted Total Return
Total return alone doesn’t tell you how much risk you took to achieve it. Risk-adjusted metrics include:
Sharpe Ratio: (Total Return – Risk-Free Rate) / Standard Deviation
- Measures excess return per unit of risk
- Higher is better
- Helps compare investments with different risk levels
Example:
- Investment A: 12% return, 15% volatility, Sharpe ratio = 0.60
- Investment B: 10% return, 8% volatility, Sharpe ratio = 0.88
- Investment B is actually better on a risk-adjusted basis
Understanding these concepts helps you make more sophisticated decisions about why the stock market goes up and how to participate wisely.
💰 Total Return Calculator
How Professional Investors Use Total Return
Understanding how the pros use total return can improve your own investment strategy.
Benchmark Comparison
Professional fund managers are evaluated against benchmark indices using total return. For example:
- Large-cap U.S. stock funds are compared to the S&P 500 Total Return Index
- Bond funds are compared to the Bloomberg U.S. Aggregate Bond Index
- International funds are compared to the MSCI EAFE Total Return Index
All these benchmarks include reinvested dividends and interest, so comparing a fund’s price return to a benchmark’s total return would be misleading.
Performance Attribution
Professional investors break down total return into components to understand what drove performance:
Example attribution analysis:
- Total return: +12%
- Sector allocation: +2%
- Security selection: +3%
- Market movement: +7%
This helps identify whether the manager added value through skill or just rode the market wave.
Risk Management
Total return helps assess whether you’re being adequately compensated for risk:
Example:
- Investment A: 15% total return, 20% standard deviation
- Investment B: 12% total return, 10% standard deviation
Investment B might be preferable because it delivers almost as much return with half the volatility. This is especially important for retirement accounts, where building wealth for your children requires balancing growth and risk.
Fee Justification
Active fund managers justify their fees by delivering total returns that exceed passive index funds after fees.
Example:
- Active fund: 11% total return, 1% annual fee = 10% net return
- Index fund: 10% total return, 0.1% annual fee = 9.9% net return
The active fund barely justifies its higher fee. Over time, that small difference compounds significantly.
Total Return and Tax Efficiency
Not all total returns are created equal from a tax perspective.
Tax Treatment of Different Return Components
Capital gains (from price appreciation):
- Short-term (held <1 year): Taxed as ordinary income (10-37%)
- Long-term (held ≥1 year): Taxed at preferential rates (0%, 15%, or 20%)
Dividends:
- Qualified dividends: Taxed at long-term capital gains rates (0%, 15%, or 20%)
- Non-qualified dividends: Taxed as ordinary income (10-37%)
Interest (from bonds):
- Generally taxed as ordinary income
- Municipal bond interest is often tax-exempt
After-Tax Total Return
Example: Two investments, both with 10% total return:
Investment A (growth stock):
- 10% price appreciation
- 0% dividend yield
- Tax (assuming 20% long-term cap gains): 2%
- After-tax return: 8%
Investment B (high-dividend stock):
- 4% price appreciation
- 6% dividend yield (qualified)
- Tax on appreciation: 0.8%
- Tax on dividends: 1.2%
- Total tax: 2%
- After-tax return: 8%
Both deliver the same after-tax return in this scenario, but the math changes if dividends are non-qualified or if you’re in different tax brackets.
Tax-Location Strategy
Smart investors place different investments in different account types:
Tax-deferred accounts (Traditional IRA, 401k):
- High-yield bonds (interest taxed as ordinary income)
- REITs (distributions often taxed as ordinary income)
- Actively managed funds (generate frequent taxable events)
Taxable accounts:
- Growth stocks (deferred capital gains)
- Tax-efficient index funds
- Municipal bonds (tax-free interest)
Roth accounts:
- Highest-growth potential investments
- Investments you expect to have the highest total return
This strategy can add 0.5-1% to your annual after-tax total return, a huge difference over decades.
Total Return in Retirement Planning
Total return becomes especially critical when planning for retirement.
The 4% Rule and Total Return
The famous “4% rule” states that you can withdraw 4% of your retirement portfolio annually with a high probability of not running out of money over 30 years.
This rule assumes:
- Portfolio mix: 60% stocks, 40% bonds
- Expected total return: ~7% annually
- Inflation adjustment: ~3% annually
- Real return: ~4% annually
If your portfolio’s total return falls short of these assumptions, the 4% rule might not work.
Example:
- Portfolio value: $1,000,000
- Annual withdrawal: $40,000 (4%)
- Required total return: At least 4% real (7% nominal) to maintain purchasing power
Understanding total return helps you assess whether your retirement plan is on track.
Sequence of Returns Risk
In retirement, the sequence of total returns matters as much as the average.
Example: Two retirees, both with $1 million, both averaging 7% total return over 10 years, but experiencing returns in different orders:
Retiree A (good sequence – positive returns early):
- Years 1-5: Average 12% return
- Years 6-10: Average 2% return
- Withdrawing $50,000/year
- Ending balance: ~$850,000
Retiree B (bad sequence – negative returns early):
- Years 1-5: Average 2% return
- Years 6-10: Average 12% return
- Withdrawing $50,000/year
- Ending balance: ~$750,000
Same average total return, different outcomes! This is why monitoring total return year-by-year matters in retirement.
Total Return vs Income-Only Strategies
Some retirees make the mistake of only spending dividends and interest, never touching principal.
Income-only approach:
- Portfolio: $1 million
- Dividend yield: 3%
- Annual income: $30,000
- Must choose high-dividend investments (potentially lower total return)
Total return approach:
- Portfolio: $1 million
- Total return: 7%
- Annual withdrawal: $40,000 (4%)
- Can choose the best total return investments regardless of yield
- More flexible, potentially higher lifetime income
The total return approach often produces better long-term results because it doesn’t force you into potentially lower-quality, high-dividend investments.
FAQ
A “good” total return depends on the asset class and time period. Historically, the S&P 500 has averaged about 10-11% annual total return over the long term. For bonds, 4-6% is typical. For individual years, anything above inflation (currently 2-3%) maintains purchasing power. Compare your total return to relevant benchmarks rather than arbitrary targets.
To calculate total return with dividends, use this formula: Total Return = [(Ending Price – Beginning Price + Dividends) / Beginning Price] × 100. For example, if you bought a stock at $100, it’s now worth $110, and you received $3 in dividends, your total return is [($110 – $100 + $3) / $100] × 100 = 13%.
Total return measures the complete gain over any time period, while annualized return converts that gain into an equivalent yearly rate. If an investment gained 50% over 3 years, the total return is 50%, but the annualized return is about 14.5% per year. Annualized returns help compare investments held for different time periods.
Focus on total return for overall investment success. Dividend yield only measures one component of returns. A stock with a 2% dividend yield and 10% price appreciation (12% total return) beats a stock with a 5% dividend yield and 3% price appreciation (8% total return). Total return captures the complete picture of your investment performance.
Inflation reduces the purchasing power of your total return. If your investment delivers a 7% total return but inflation is 3%, your “real return” is only about 4%. This means your investment grew 7% in dollar terms, but your actual purchasing power only increased by 4%. Always consider inflation when evaluating long-term investment performance.
Yes, total return can be negative when investment losses exceed any income received. For example, if a stock drops from $100 to $85 and pays a $2 dividend, the total return is [($85 – $100 + $2) / $100] × 100 = -13%. This represents a 13% loss despite receiving dividend income.
For long-term investors, checking total return quarterly or annually is sufficient. Checking too frequently can lead to emotional decisions based on short-term volatility. Professional investors often evaluate performance over 3-5 year periods. However, review annually to ensure your investments remain aligned with your goals and to rebalance if needed.
Tools and Resources for Tracking Total Return
Online Portfolio Trackers
Several free and paid tools automatically calculate total return:
Free options:
- Yahoo Finance: Create portfolios and track total return with dividend reinvestment
- Google Finance: Basic portfolio tracking with total return calculations
- Personal Capital: Free comprehensive portfolio tracking and analysis
- Morningstar: Free basic tracking; premium features available
Paid options:
- Quicken: Comprehensive investment tracking software
- Sharesight: Detailed performance tracking with tax reporting
- Bloomberg Terminal: Professional-grade (very expensive)
Most modern brokerage platforms (Fidelity, Vanguard, Schwab, etc.) automatically calculate and display total return in your account dashboard.
Financial Data Sources
For research and benchmarking:
- SEC.gov: Official company filings and financial data
- Morningstar.com: Fund analysis and total return data
- Yahoo Finance: Free stock data with total return charts
- Bloomberg.com: Professional financial news and data
- FRED (Federal Reserve Economic Data): Economic indicators and market indices
Spreadsheet Templates
You can create your own total return tracker using Excel or Google Sheets:
Basic template columns:
- Investment name
- Purchase date
- Purchase price
- Number of shares
- Current price
- Current value
- Dividends received
- Total return (%)
- Annualized return (%)
Formula for total return cell:=((Current Value - Initial Investment + Dividends) / Initial Investment) * 100
This gives you complete control and helps you understand the calculations deeply.
Conclusion: Mastering Total Return for Investment Success
Understanding total return is one of the most important skills you can develop as an investor. It’s the difference between seeing only part of the picture and understanding your complete investment performance.
Remember these key principles:
Total return includes everything: price changes, dividends, interest, and distributions—not just how much the price moved
Dividends matter enormously: Over long periods, reinvested dividends can account for 40% or more of your total return
Use total return for comparisons: Whether evaluating stocks, funds, or entire portfolios, total return gives you an apples-to-apples comparison
Consider taxes and fees: Your after-tax, after-fee total return is what actually grows your wealth
Time horizon matters: Annualize returns when comparing different time periods, and remember that long-term total return is what builds wealth
Context is crucial: A 10% total return might be excellent for bonds but mediocre for stocks; always compare to relevant benchmarks
Your Action Steps
Now that you understand total return, here’s what to do next:
- Review your current investments: Calculate the actual total return on each investment, including all dividends and distributions
- Check your brokerage statements: Most platforms show total return automatically—make sure you’re looking at the right number
- Evaluate your portfolio: Compare your total returns to appropriate benchmarks to see if you’re on track
- Consider dividend reinvestment: If you’re not already reinvesting dividends automatically, evaluate whether this makes sense for your situation
- Plan for taxes: Understand the tax implications of your total return and consider tax-efficient investing strategies
- Set realistic expectations: Use historical total return data to set appropriate expectations for your investment timeline
- Keep learning: Continue expanding your financial knowledge through resources like our blog to make increasingly sophisticated investment decisions
Final Thoughts
The journey to financial independence isn’t just about picking the right stocks or timing the market perfectly. It’s about understanding the fundamental metrics that drive wealth creation, and total return sits at the very top of that list.
Whether you’re investing for retirement, building wealth for your family, or pursuing financial freedom, total return gives you the clarity you need to make informed decisions. It cuts through the noise, eliminates confusion, and shows you exactly how your investments are performing.
Start applying these principles today. Calculate the total return on your existing investments. Compare them to benchmarks. Make adjustments where needed. And remember: investing is a marathon, not a sprint. Focus on maximizing your long-term total return while managing risk appropriately, and you’ll be well on your way to achieving your financial goals.
The power of total return, combined with time and consistency, is the proven path to building lasting wealth. Now you know; it’s time to put it into action!
Disclaimer
This article is for educational purposes only and does not constitute financial advice. Investment decisions should be based on your individual circumstances, risk tolerance, and financial goals. Past performance, including historical total returns, does not guarantee future results. The examples provided are for illustrative purposes and may not reflect actual investment performance. Always consult with a qualified financial advisor before making investment decisions. The author and publisher are not responsible for any financial losses incurred based on information in this article.
About the Author
Written by Max Fonji — With over a decade of experience in financial education and investment analysis, Max is dedicated to making complex financial concepts accessible to everyone. As the founder of TheRichGuyMath.com, Max has helped thousands of readers build wealth through clear, data-backed investing education. His mission is to empower individuals with the knowledge and tools they need to achieve financial independence.
