In 1968, a young finance professor at New York University named Edward Altman published a groundbreaking study that would change how investors assess corporate bankruptcy risk forever. His research analyzed 66 companies—half that had filed for bankruptcy and half that remained solvent—to identify the financial ratios that best predicted business failure. The result was the Altman Z-Score, a mathematical formula that distills complex financial statements into a single number that reveals whether a company is heading toward financial distress or standing on solid ground.
Today, as investors navigate market volatility and economic uncertainty in 2025, the Altman Z-Score remains one of the most reliable tools for evaluating bankruptcy risk. Whether you’re analyzing high dividend stocks or researching companies in a mid-cap growth ETF, understanding this metric helps separate financially healthy businesses from those teetering on the edge of insolvency.
This guide explains the Altman Z-Score in plain English: what it measures, how to calculate it, what the numbers mean, and how to use it in real-world investment decisions.
Key Takeaways
- The Altman Z-Score predicts bankruptcy probability by combining five financial ratios into a single metric, with scores below 1.8 indicating high distress risk and scores above 3.0 suggesting financial stability.
- The formula weighs profitability, liquidity, leverage, and efficiency to assess whether a company can meet its obligations and sustain operations.
- Different versions exist for different company types: the original model for public manufacturers, the Z’-Score for private companies, and the Z”-Score for non-manufacturers and emerging markets.
- The Z-Score complements fundamental analysis by providing an objective, quantitative measure of financial health that helps investors avoid value traps and identify distressed situations early.
- Regular monitoring matters more than a single calculation, as deteriorating scores over time often signal emerging problems before they become obvious in headlines.
What Is the Altman Z-Score?
The Altman Z-Score is a quantitative formula that predicts the probability of a company entering bankruptcy within two years. Developed by Edward I. Altman in 1968, the model uses five weighted financial ratios derived from a company’s balance sheet and income statement to produce a single score that indicates financial health.
Unlike traditional financial analysis, which examines ratios in isolation, the Z-Score combines multiple metrics into a comprehensive assessment. This multivariate approach captures the interaction between profitability, liquidity, leverage, and operational efficiency—the four pillars that determine whether a business can survive financial stress.
The score typically ranges from -4 to +8, though most companies fall between 0 and 5. Higher scores indicate stronger financial health and lower bankruptcy risk, while lower scores suggest financial distress and a higher probability of default.
Why the Altman Z-Score Matters for Investors
The Z-score provides an early warning system for financial distress. According to Altman’s original research, the model correctly predicted bankruptcy in 72% of cases two years before the event occurred and 80-90% accuracy one year prior. This predictive power makes the Z-score valuable for:
- Risk assessment: Identifying companies with elevated bankruptcy probability before credit ratings reflect the danger
- Value investing: Distinguishing between genuine value opportunities and value traps where low valuations reflect fundamental weakness
- Portfolio management: Monitoring existing holdings for deteriorating financial health
- Credit analysis: Evaluating counterparty risk in corporate bonds or lending relationships
As investors build positions in dividend stocks or explore passive income strategies, the Z-Score helps ensure the companies generating those cash flows possess the financial stability to sustain payments through economic cycles.
Insight: The Altman Z-Score doesn’t predict when a company will fail—it measures financial vulnerability. A low score indicates heightened risk, not certainty, while a high score suggests resilience but doesn’t guarantee success.
The Altman Z-Score Formula Explained
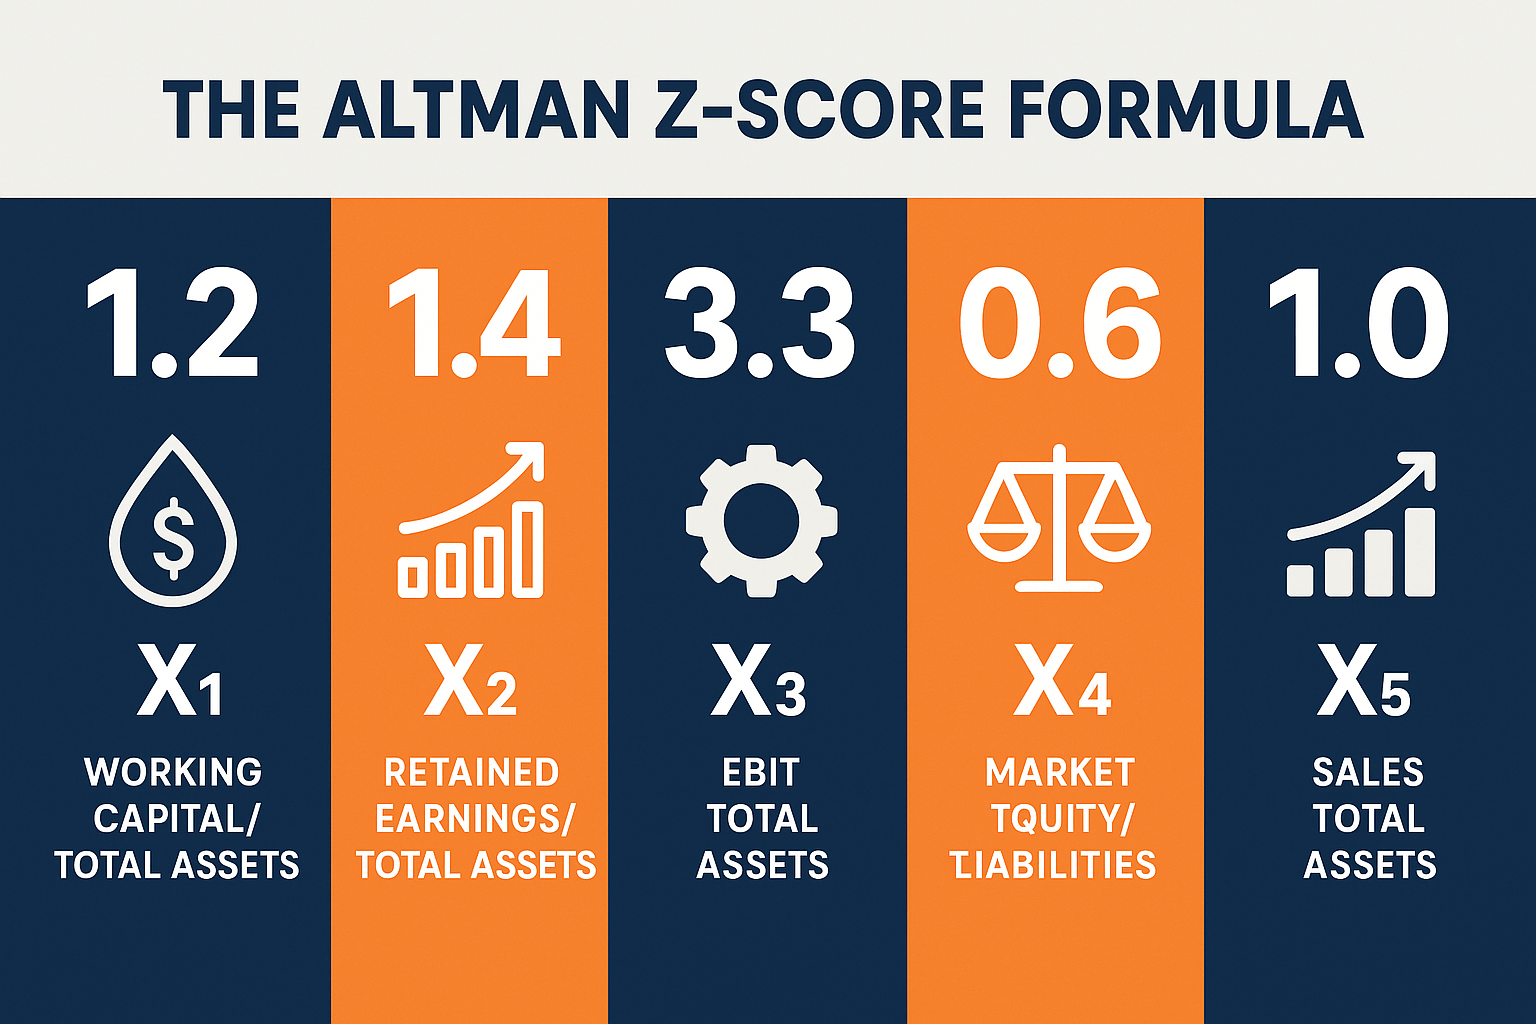
The original Altman Z-Score formula for publicly traded manufacturing companies combines five financial ratios, each weighted according to its predictive importance:
Z = 1.2X₁ + 1.4X₂ + 3.3X₃ + 0.6X₄ + 1.0X₅
Where:
- X₁ = Working Capital / Total Assets (liquidity ratio)
- X₂ = Retained Earnings / Total Assets (cumulative profitability ratio)
- X₃ = Earnings Before Interest and Taxes (EBIT) / Total Assets (operating efficiency ratio)
- X₄ = Market Value of Equity / Total Liabilities (leverage ratio)
- X₅ = Sales / Total Assets (asset turnover ratio)
Each component measures a distinct dimension of financial health. Together, they create a comprehensive picture of a company’s ability to meet obligations, generate profits, and sustain operations.
Breaking Down Each Component
X₁: Working Capital / Total Assets (Weight: 1.2)
This ratio measures short-term liquidity by comparing working capital (current assets minus current liabilities) to total assets. It reveals whether a company has sufficient liquid resources to cover near-term obligations.
A positive ratio indicates the company holds more current assets than current liabilities, suggesting operational flexibility. A negative ratio signals potential liquidity problems—the company may struggle to pay bills as they come due.
The 1.2 weighting reflects liquidity’s importance in preventing bankruptcy. Companies with inadequate working capital often fail even when profitable on paper because they cannot convert earnings into cash quickly enough to meet obligations.
X₂: Retained Earnings / Total Assets (Weight: 1.4)
This ratio captures cumulative profitability by dividing retained earnings (the sum of all historical profits kept in the business) by total assets. It measures how much of the company’s asset base was financed through reinvested profits versus debt or equity issuance.
Higher ratios indicate a track record of profitability and financial maturity. Lower or negative ratios suggest either a young company that hasn’t accumulated earnings or a struggling business that has burned through past profits.
The 1.4 weighting—the second highest in the formula—recognizes that companies with deep reserves of retained earnings possess a financial cushion that helps them weather downturns.
X₃: EBIT / Total Assets (Weight: 3.3)
This ratio measures operating profitability by comparing earnings before interest and taxes to total assets. It reveals how effectively management deploys assets to generate operating income, independent of capital structure or tax strategy.
The 3.3 weighting makes this the most important component in the Z-score formula. Profitability ultimately determines survival—companies that consistently generate operating income can refinance debt, attract equity, and navigate challenges. Those that cannot generate profits face a ticking clock toward insolvency.
X₄: Market Value of Equity / Total Liabilities (Weight: 0.6)
This leverage ratio compares the market value of equity (share price multiplied by shares outstanding) to the book value of total liabilities. It measures how much the company’s market value would need to decline before liabilities exceed assets, triggering technical insolvency.
Using market value rather than book value incorporates investor expectations about future performance. A declining market cap relative to liabilities signals deteriorating confidence and a shrinking equity cushion.
The relatively lower 0.6 weighting reflects that this ratio can be volatile due to stock price fluctuations that don’t always reflect fundamental changes in financial health.
X₅: Sales / Total Assets (Weight: 1.0)
This asset turnover ratio measures operational efficiency by comparing revenue to total assets. It reveals how effectively the company uses its asset base to generate sales.
Higher ratios indicate efficient asset utilization—the company generates substantial revenue relative to its investment in property, equipment, and inventory. Lower ratios suggest inefficiency or capital intensity that may pressure profitability.
The 1.0 weighting gives this ratio moderate importance, recognizing that revenue generation matters but varies significantly across industries.
Takeaway: Each Z-Score component captures a different aspect of financial health. Together, they measure whether a company possesses the liquidity, profitability, efficiency, and leverage profile needed to avoid bankruptcy.
Interpreting Altman Z-Score Results
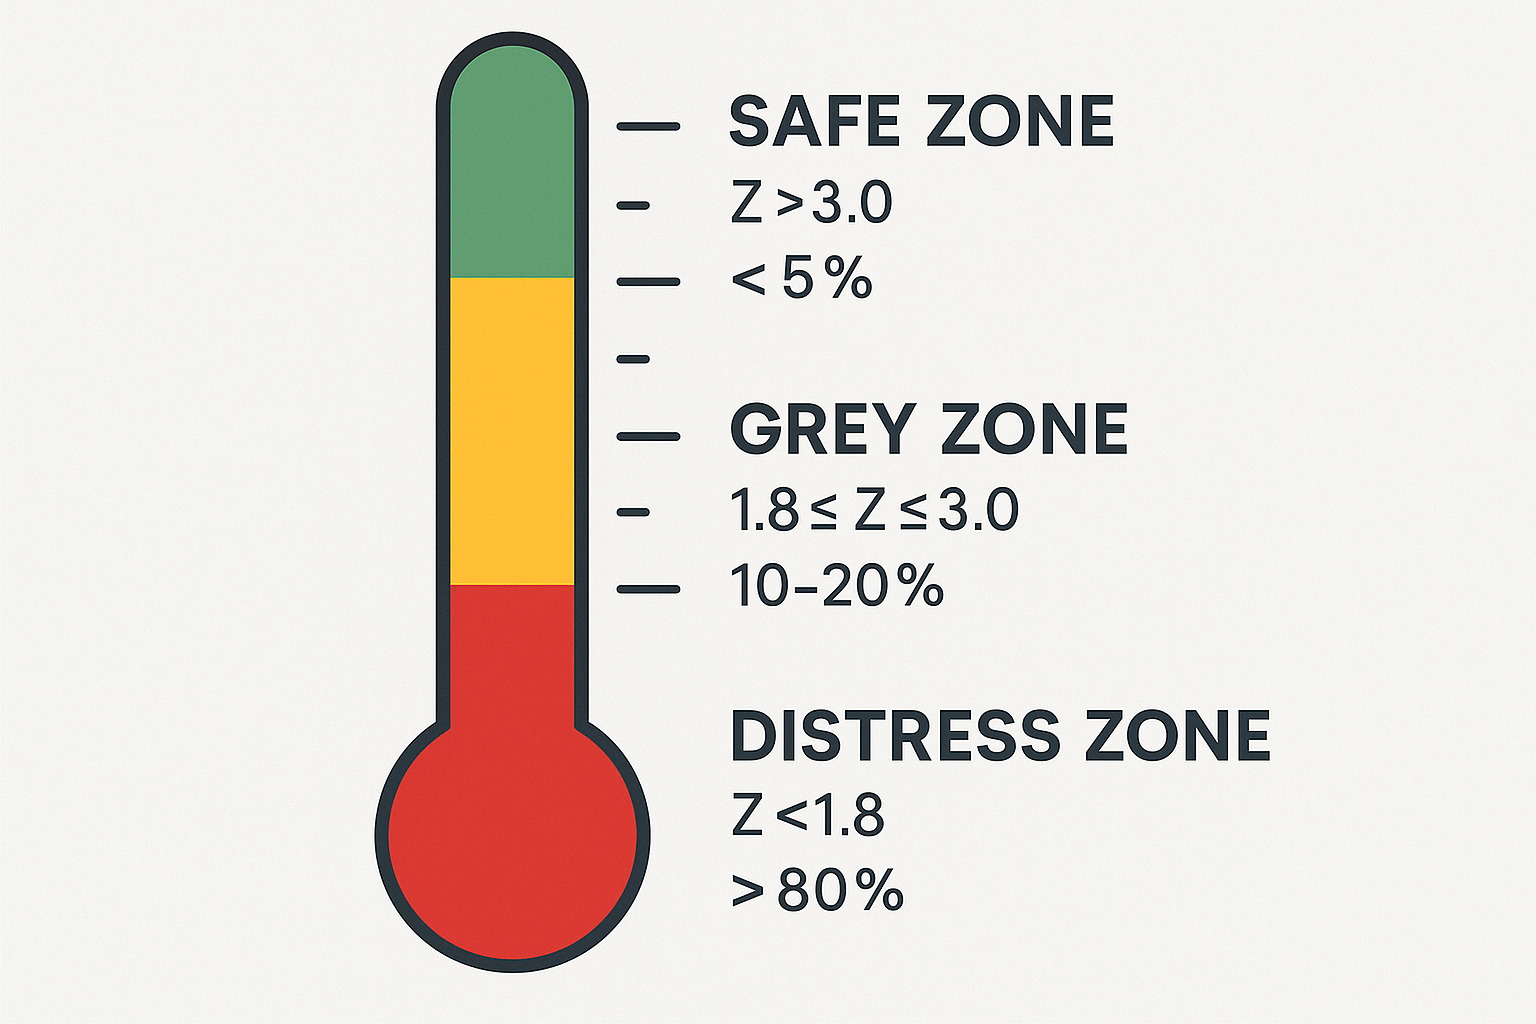
Once calculated, the Z-score falls into one of three zones that indicate bankruptcy probability:
| Z-Score Range | Zone | Interpretation | Bankruptcy Risk |
|---|---|---|---|
| Above 3.0 | Safe Zone | Strong financial health; low bankruptcy probability | < 5% within 2 years |
| 1.8 to 3.0 | Grey Zone | Moderate risk; requires closer examination | 10-20% within 2 years |
| Below 1.8 | Distress Zone | High bankruptcy probability; significant financial stress | > 80% within 2 years |
The Safe Zone (Z > 3.0)
Companies scoring above 3.0 demonstrate strong financial health across multiple dimensions. They typically possess:
- Adequate liquidity to meet short-term obligations
- Consistent profitability and growing retained earnings
- Efficient asset utilization, generating solid operating returns
- Conservative leverage with equity significantly exceeding liabilities
- Healthy revenue generation relative to asset base
These companies represent lower-risk investments from a bankruptcy perspective. However, a high Z-Score doesn’t guarantee stock performance—overvalued companies with strong balance sheets may underperform, while business model disruption or industry decline can affect even financially healthy firms.
The Grey Zone (1.8 ≤ Z ≤ 3.0)
Scores in this range indicate moderate risk requiring deeper analysis. Companies here may be:
- Cyclical businesses facing temporary industry headwinds
- Growth companies invest heavily before achieving profitability
- Mature businesses with elevated but manageable debt levels
- Turnaround situations showing early improvement signs
The grey zone demands context. A capital-intensive manufacturer with a 2.5 Z-score may be perfectly normal for its industry, while a software company at the same score might signal trouble. Investors should examine trends—is the score improving or deteriorating over time?
The Distress Zone (Z < 1.8)
Scores below 1.8 indicate high bankruptcy probability and severe financial stress. Common characteristics include:
- Negative working capital or minimal liquidity
- Operating losses depleting retained earnings
- Poor asset efficiency generates insufficient returns
- High leverage with liabilities approaching or exceeding equity value
- Declining revenue relative to asset base
Companies in this zone often face existential threats. Some may successfully restructure or raise capital to survive, but many eventually file for bankruptcy or undergo distressed acquisitions. For investors, these situations represent either high-risk turnaround opportunities or value traps to avoid.
Insight: The Z-score provides a probability estimate, not a certainty. Companies with low scores sometimes survive through restructuring, asset sales, or improved operations, while high-scoring companies occasionally fail due to fraud, sudden shocks, or rapid industry changes.
Modified Altman Z-Score Formulas
Altman developed modified versions of the original formula to address different company types and capital structures:
Z’-Score (For Private Companies)
Z’ = 0.717X₁ + 0.847X₂ + 3.107X₃ + 0.420X₄ + 0.998X₅
The Z’-Score modifies the fourth component (X₄) to use the book value of equity instead of the market value, since private companies lack publicly traded shares. This adjustment makes the model applicable to closely held businesses.
Interpretation zones shift slightly:
- Safe Zone: Z’ > 2.9
- Grey Zone: 1.23 ≤ Z’ ≤ 2.9
- Distress Zone: Z’ < 1.23
Z”-Score (For Non-Manufacturing and Emerging Markets)
Z” = 6.56X₁ + 3.26X₂ + 6.72X₃ + 1.05X₄
The Z”-Score eliminates the sales/assets ratio (X₅) because asset turnover varies dramatically across industries. Service companies, retailers, and emerging market firms often have very different asset intensity than traditional manufacturers.
This version applies to:
- Service companies with minimal physical assets
- Retailers and wholesalers
- Emerging market companies
- Non-manufacturing businesses
Interpretation zones:
- Safe Zone: Z” > 2.6
- Grey Zone: 1.1 ≤ Z” ≤ 2.6
- Distress Zone: Z” < 1.1
Takeaway: Choose the appropriate Z-score formula based on company type. Using the wrong version can produce misleading results, as weighting and interpretation zones differ across models.
Step-by-Step Altman Z-Score Calculation Example
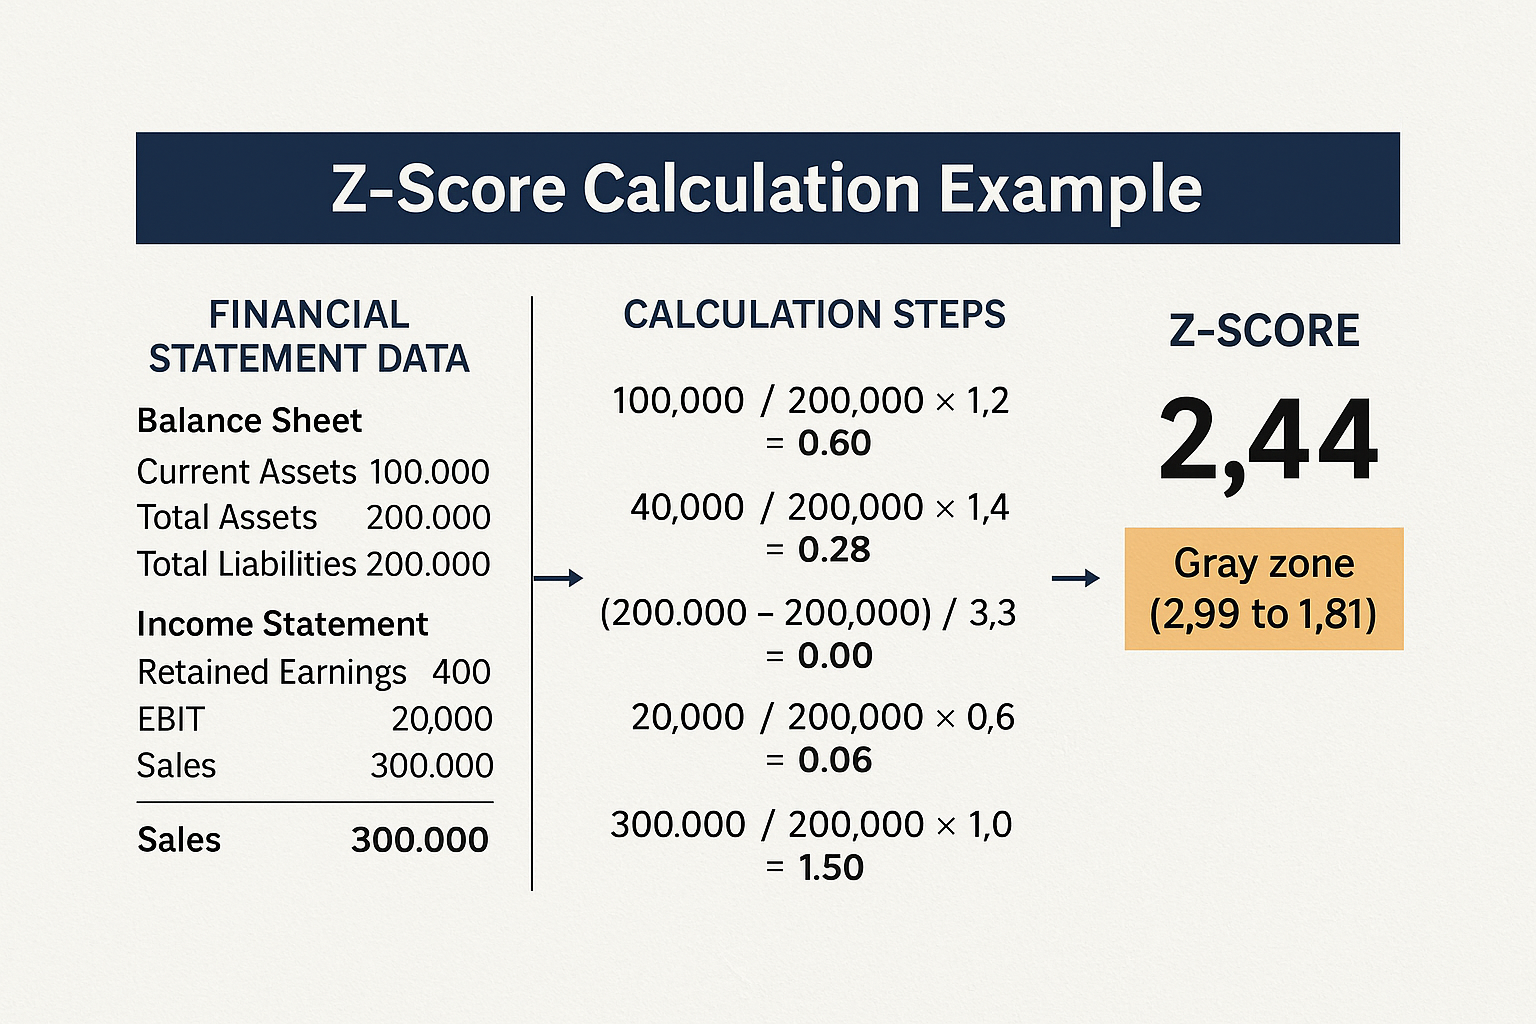
Let’s calculate the Altman Z-Score for a hypothetical publicly traded manufacturing company using recent financial statements:
Company Financial Data
Balance Sheet Items:
- Current Assets: $850,000
- Current Liabilities: $400,000
- Total Assets: $2,500,000
- Total Liabilities: $1,200,000
- Retained Earnings: $600,000
Income Statement Items:
- Sales (Revenue): $3,200,000
- EBIT: $380,000
Market Data:
- Market Value of Equity: $1,800,000
Calculate Each Component
X₁ = Working Capital / Total Assets
- Working Capital = Current Assets – Current Liabilities = $850,000 – $400,000 = $450,000
- X₁ = $450,000 / $2,500,000 = 0.18
X₂ = Retained Earnings / Total Assets
- X₂ = $600,000 / $2,500,000 = 0.24
X₃ = EBIT / Total Assets
- X₃ = $380,000 / $2,500,000 = 0.152
X₄ = Market Value of Equity / Total Liabilities
- X₄ = $1,800,000 / $1,200,000 = 1.5
X₅ = Sales / Total Assets
- X₅ = $3,200,000 / $2,500,000 = 1.28
Apply the Formula
Z = 1.2(0.18) + 1.4(0.24) + 3.3(0.152) + 0.6(1.5) + 1.0(1.28)
Z = 0.216 + 0.336 + 0.502 + 0.9 + 1.28
Z = 3.23
Interpretation
With a Z-score of 3.23, this company falls in the Safe Zone (above 3.0), indicating:
- Low bankruptcy probability over the next two years
- Strong financial health across liquidity, profitability, and leverage metrics
- Adequate equity cushion relative to liabilities
- Efficient asset utilization generating solid returns
This company would generally be considered financially stable from a bankruptcy risk perspective, though investors should still examine industry trends, competitive position, and valuation before making investment decisions.
When to Use the Altman Z-Score
The Z-score proves most valuable in specific investment scenarios and analytical contexts:
Credit Risk Assessment
Bond investors and lenders use the Z-score to evaluate default probability before extending credit or purchasing corporate debt. A declining Z-score may signal the need to sell bonds, tighten lending terms, or demand higher interest rates to compensate for elevated risk.
The model helps identify credit deterioration before rating agencies downgrade bonds—agencies often lag fundamental changes by several quarters, creating opportunities for investors who monitor Z-Scores independently.
Value Investing Screening
Value investors face a persistent challenge: distinguishing between genuinely undervalued companies and value traps that trade cheaply for good reason. The Z-score helps separate these categories.
A company trading at low multiples with a Z-Score above 3.0 may represent a genuine opportunity—the market undervalues a financially sound business. The same low multiples, combined with a Z-Score below 1.8, often signal a value trap in which apparent cheapness reflects justified bankruptcy concerns.
When researching dividend stocks or building passive income strategies, the Z-Score helps ensure dividend sustainability by confirming that the company has financial stability to maintain payments during downturns.
Portfolio Monitoring
Regular Z-score calculation for portfolio holdings provides an early warning of deteriorating financial health. A company whose score drops from 3.5 to 2.2 over two years may be experiencing fundamental problems not yet reflected in stock price or analyst ratings.
This monitoring proves especially valuable for buy-and-hold investors who may not closely track every holding daily. Quarterly Z-Score updates reveal emerging risks that warrant deeper investigation or position reduction.
Industry Comparison
Comparing Z-Scores across competitors within an industry reveals relative financial strength. In cyclical sectors like manufacturing or retail, identifying which companies possess the strongest balance sheets helps predict which will survive downturns and gain market share as weaker competitors fail.
During the 2008 financial crisis and 2020 pandemic, companies with higher Z-Scores generally weathered disruption better than highly leveraged competitors, validating the model’s predictive value during stress periods.
Limitations to Consider
While powerful, the Z-score has important limitations:
Industry Variation: Capital intensity and normal leverage ratios vary dramatically across sectors. A Z-score of 2.0 might be concerning for a software company but normal for a utility. Always compare scores within industries rather than across different sectors.
Accounting Manipulation: The Z-score relies on financial statement data that companies can manipulate through aggressive accounting. Firms engaging in revenue recognition games or hiding liabilities may produce misleadingly high scores.
Non-Financial Factors: The model ignores qualitative factors like management quality, competitive moats, technological disruption, or regulatory changes that can dramatically affect survival probability.
Timing Uncertainty: A low Z-score indicates elevated risk but doesn’t predict when bankruptcy might occur. Some distressed companies survive for years through restructuring, while others fail quickly.
Not Designed for Financial Institutions: Banks and financial services companies have fundamentally different balance sheets than manufacturers. The Z-score doesn’t apply well to these sectors—specialized models exist for financial institution analysis.
Takeaway: Use the Z-score as one tool within a comprehensive analytical framework. It provides valuable quantitative insight into bankruptcy risk but should complement, not replace, qualitative analysis of business models, competitive position, and industry dynamics.
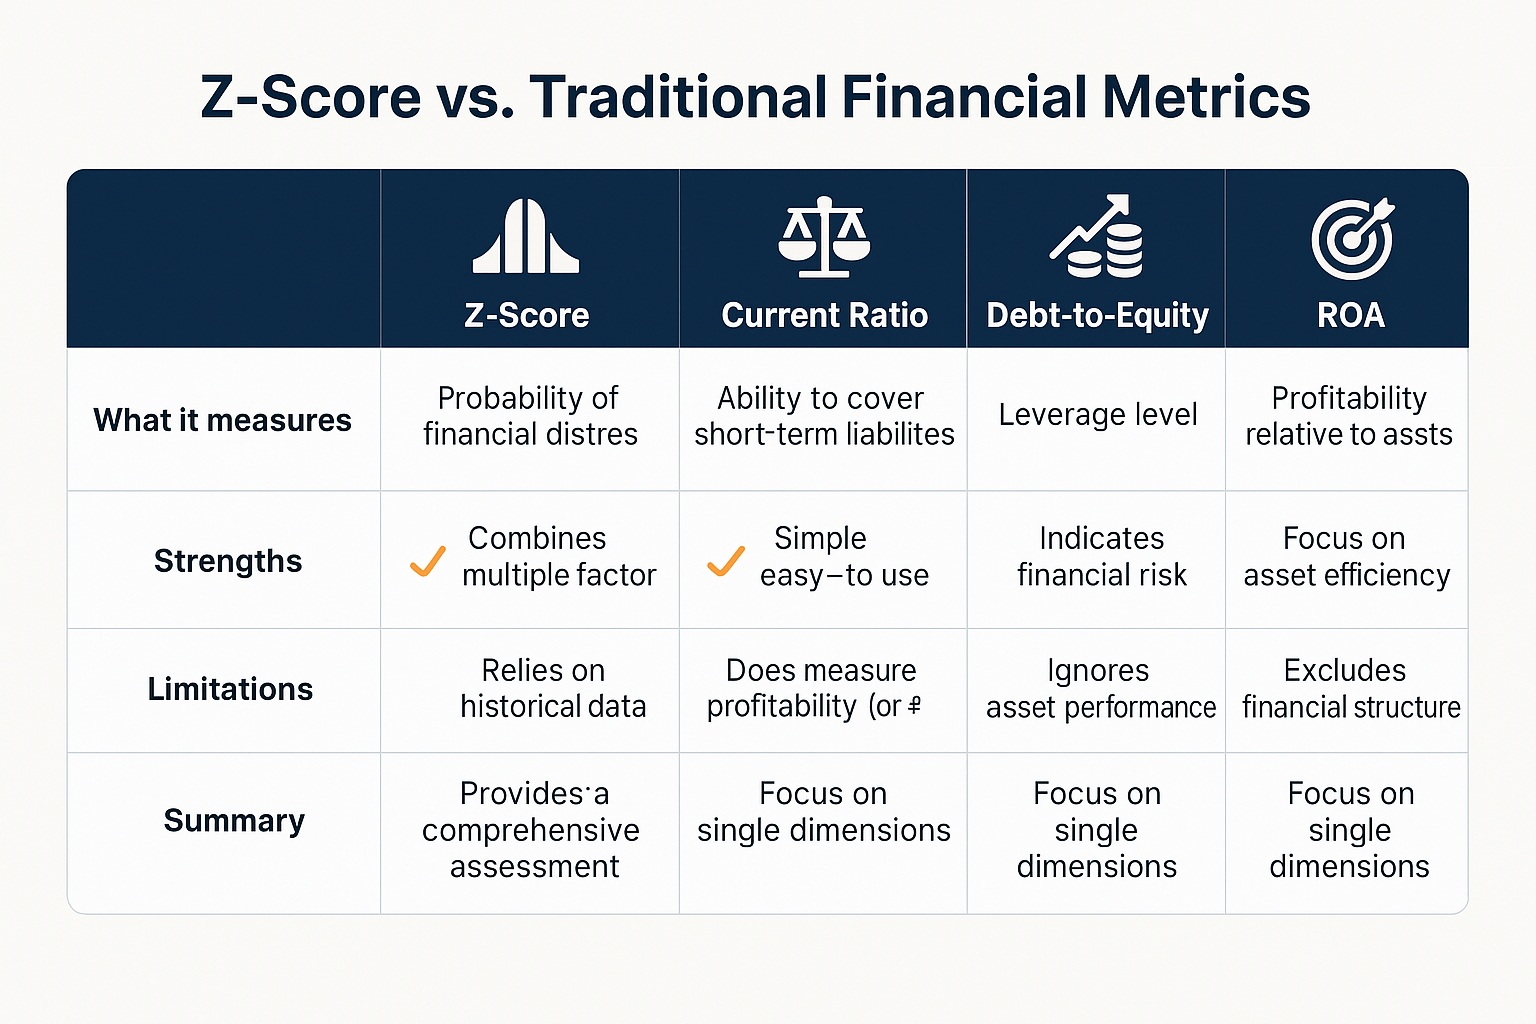
Altman Z-Score vs Other Financial Metrics
Understanding how the Z-Score relates to other financial metrics helps investors build a complete picture of company health:
Z-Score vs Current Ratio
The current ratio (current assets / current liabilities) measures short-term liquidity in isolation. The Z-Score incorporates liquidity through the X₁ component but adds profitability, leverage, and efficiency dimensions.
A company might have a strong current ratio above 2.0 but still score poorly on the Z-Score if it’s unprofitable, highly leveraged, or inefficient. Conversely, a profitable, well-capitalized company with temporarily tight working capital might show a modest current ratio but a strong overall Z-Score.
Z-Score vs Debt-to-Equity Ratio
The debt-to-equity ratio examines leverage from a single angle—how much debt finances the business relative to equity. The Z-Score’s X₄ component captures leverage but weights it alongside profitability and liquidity.
Highly leveraged companies can maintain acceptable Z-Scores if they generate strong profits and cash flow to service debt. Conversely, companies with modest leverage but poor profitability may score poorly because they lack the earnings to sustain operations.
Z-Score vs Return on Assets (ROA)
Return on Assets measures profitability relative to the asset base, similar to the Z-Score’s X₃ component. However, ROA alone doesn’t reveal whether that profitability translates into financial stability.
A company might show decent Return On Assets but maintain dangerously low liquidity or excessive leverage that threatens survival. The Z-Score’s comprehensive approach reveals whether profitable operations support overall financial health.
Z-Score vs. Credit Ratings
Credit ratings from agencies like Moody’s, S&P, and Fitch assess default probability but often lag fundamental changes. The Z-score provides a real-time, quantitative assessment that investors can calculate immediately using recent financial statements.
Research shows Z-Scores often deteriorate quarters before rating agencies downgrade bonds, creating opportunities for investors who monitor the metric independently. However, credit ratings incorporate qualitative factors and industry expertise that purely quantitative models miss.
Insight: The most effective financial analysis combines the Z-Score with traditional ratios, credit ratings, and qualitative assessment. Each metric reveals different aspects of financial health—together, they provide a comprehensive understanding.
Real-World Applications and Case Studies
The Altman Z-Score has demonstrated predictive power across decades and economic cycles:
Historical Accuracy
Altman’s original 1968 study showed the model correctly predicted bankruptcy in 72% of cases two years before failure and 80-90% accuracy one year prior. Subsequent research has validated these results across different time periods and geographies.
A 2000 study by Altman found the model maintained 80-90% accuracy in predicting bankruptcy one year in advance across multiple decades. The two-year prediction accuracy remained around 70%, demonstrating remarkable consistency.
Corporate Failures Predicted by Low Z-Scores
Several high-profile bankruptcies showed deteriorating Z-Scores well before filing:
Lehman Brothers (2008): The investment bank’s Z-Score declined sharply in quarters preceding its September 2008 collapse as leverage soared and asset quality deteriorated. Investors monitoring the metric would have seen clear warning signs before the failure shocked markets.
General Motors (2009): GM’s Z-Score fell into distress territory years before its bankruptcy filing as operating losses mounted and liabilities exceeded assets. The model correctly signaled severe financial stress requiring government intervention.
Toys “R” Us (2017): The retailer showed a deteriorating Z-score for years as e-commerce competition eroded profitability and high debt loads from a leveraged buyout crushed financial flexibility. The bankruptcy filing surprised few analysts tracking the company’s Z-score.
Successful Turnarounds
Not all low Z-scores lead to bankruptcy. Some companies successfully restructure:
Ford Motor Company (2009): Unlike GM and Chrysler, Ford avoided bankruptcy during the financial crisis despite a low Z-score. Aggressive cost-cutting, asset sales, and product improvements restored financial health, demonstrating that distressed scores indicate risk, not certainty.
Delta Air Lines (Post-2007): After emerging from bankruptcy in 2007, Delta rebuilt its Z-Score through debt reduction, improved profitability, and operational efficiency. The airline transformed from distressed to financially stable over several years.
Using Z-Scores During Market Volatility
Market volatility often creates opportunities to apply the Z-score. When stock market movements create indiscriminate selling, the Z-Score helps identify which beaten-down companies possess financial strength to survive versus those facing genuine distress.
During the March 2020 COVID-19 crash, companies with Z-Scores above 3.0 generally recovered faster than those with scores below 2.0, as investors recognized that financially strong businesses would weather temporary disruption while weak balance sheets faced existential threats.
Understanding why the stock market goes up over time helps investors recognize that companies with strong Z-Scores participate more reliably in long-term market appreciation, as they survive downturns and compound value through cycles.
Takeaway: The Z-Score’s track record across decades, industries, and economic conditions validates its usefulness as a bankruptcy prediction tool. While not perfect, it provides objective, quantitative insight that complements qualitative analysis.
How to Calculate Altman Z-Score for Your Portfolio
Investors can calculate Z-Scores for any publicly traded company using financial statements available through:
Data Sources
Company Filings: Download 10-K annual reports and 10-Q quarterly reports from the SEC’s EDGAR database (sec.gov). These filings contain all the balance sheet and income statement data needed for the Z-score calculation.
Financial Websites: Sites like Yahoo Finance, Morningstar, and Seeking Alpha provide organized financial statements that simplify data extraction. Most display current assets, current liabilities, total assets, total liabilities, retained earnings, EBIT, and revenue in standardized formats.
Bloomberg Terminal / FactSet: Professional investors access comprehensive financial data through institutional platforms that often calculate Z-Scores automatically.
Calculation Process
- Gather financial statement data from the most recent 10-K or 10-Q filing
- Extract the required values: current assets, current liabilities, total assets, total liabilities, retained earnings, EBIT, sales
- Find market capitalization (shares outstanding × current stock price) for the X₄ component
- Calculate each ratio (X₁ through X₅) using the formulas provided earlier
- Apply the appropriate formula based on company type (original Z, Z’, or Z”)
- Interpret the result using the zone classifications
Tracking Over Time
Single Z-score calculations provide a snapshot, but tracking changes over multiple quarters reveals trends. Create a spreadsheet that calculates the Z-score each quarter, then chart the results to visualize improvement or deterioration.
Declining Z-Scores warrant investigation—examine which components are weakening and whether the changes reflect temporary factors or fundamental deterioration.
Improving Z-Scores suggests strengthening financial health, potentially indicating turnaround success or business model improvements that may not yet be reflected in the stock price.
Portfolio-Level Analysis
Calculate Z-Scores for all portfolio holdings to identify concentration in financially stressed companies. A portfolio heavily weighted toward low Z-Score stocks carries elevated bankruptcy risk that may not be obvious from traditional diversification metrics.
Consider establishing minimum Z-score thresholds for new purchases or position sizes. For example, requiring Z-Scores above 2.0 for any holding exceeding 5% of portfolio value reduces concentration in high-risk names.
⚡ Altman Z-Score Calculator
Enter financial data to calculate bankruptcy risk
Conclusion: Using the Altman Z-Score for Smarter Investment Decisions
The Altman Z-Score transforms complex financial statements into a single, actionable metric that reveals bankruptcy probability with remarkable accuracy. By combining liquidity, profitability, leverage, efficiency, and market valuation into a weighted formula, the model provides comprehensive insight into financial health that individual ratios cannot capture.
For investors navigating stock market dynamics in 2025, the Z-Score offers several practical applications:
Risk Management: Calculate Z-Scores before purchasing stocks to avoid companies with elevated bankruptcy probability. This discipline prevents value traps where low valuations reflect justified distress rather than opportunity.
Portfolio Monitoring: Track Z-Scores quarterly for existing holdings to identify deteriorating financial health before it becomes obvious in headlines or stock prices. Declining scores warrant investigation and potentially position reduction.
Opportunity Identification: During market selloffs, the Z-Score helps distinguish between financially sound companies facing temporary price pressure and genuinely distressed businesses. High Z-score companies trading at depressed valuations often represent compelling opportunities.
Dividend Sustainability: When building passive income strategies through dividend investing, the Z-Score confirms whether companies possess the financial stability to maintain and grow distributions through economic cycles.
Actionable Next Steps
- Calculate Z-Scores for your current holdings using the formulas and process outlined in this guide. Identify any positions with scores below 2.0 that warrant deeper investigation.
- Establish Z-score screening criteria for new investments. Consider requiring minimum scores (e.g., above 2.0 or 2.5) before purchasing, especially for core portfolio positions.
- Create a tracking spreadsheet that calculates Z-scores quarterly for your portfolio. Chart trends over time to visualize improving or deteriorating financial health.
- Combine Z-score analysis with qualitative research. Use the metric as one tool within comprehensive due diligence that includes competitive analysis, management assessment, and industry trends.
- Learn complementary analytical frameworks by exploring smart investment moves and understanding market fundamentals that drive long-term returns.
The Altman Z-Score doesn’t guarantee investment success—no single metric does. However, it provides objective, quantitative insight into bankruptcy risk that helps investors make more informed decisions, avoid costly mistakes, and build portfolios positioned to compound wealth through complete market cycles.
By understanding the math behind financial distress, investors gain a powerful advantage: the ability to separate companies with sustainable competitive advantages from those facing existential threats, regardless of how attractive their valuations appear on the surface.
About the Author
Written by Max Fonji, founder of TheRichGuyMath.com—a finance educator and investor who explains the “math behind money” in simple, actionable terms. With experience in investment strategy, personal finance, and wealth-building systems, Max helps readers understand how financial decisions create lasting results. Connect with Max to explore more educational content at TheRichGuyMath.com.
Disclaimer
Disclaimer: The content on TheRichGuyMath.com is for educational purposes only and does not constitute financial or investment advice. The Altman Z-Score is a predictive model with limitations and should not be the sole basis for investment decisions. Always consult a qualified financial professional before making investment choices. Past performance and model accuracy do not guarantee future results.
Frequently Asked Questions (FAQ)
What is the Altman Z-Score?
The Altman Z-Score is a quantitative formula that predicts the probability of a company entering bankruptcy within two years by combining five weighted financial ratios into a single metric. Scores above 3.0 indicate financial stability, while scores below 1.8 signal high bankruptcy risk.
Why does the Altman Z-Score matter for investors?
The Z-Score provides an early warning system for financial distress, helping investors avoid value traps, assess credit risk, and identify which companies possess the financial strength to survive economic downturns. Research shows the model predicts bankruptcy with 70–90% accuracy one to two years in advance.
How can someone apply the Altman Z-Score concept?
Investors can calculate Z-Scores using publicly available financial statements from SEC filings or financial websites. Extract balance sheet and income statement data, apply the appropriate formula based on company type, and interpret results using the zone classifications. Regular quarterly calculations reveal trends that indicate improving or deteriorating financial health.
Does the Altman Z-Score work for all companies?
The original Z-Score applies to publicly traded manufacturing companies. Modified versions exist for private companies (Z’-Score using book equity value) and non-manufacturing businesses (Z”-Score eliminating the asset turnover component). The model does not apply well to financial institutions, which require specialized analytical frameworks.
What Z-Score indicates a company is financially healthy?
A Z-Score above 3.0 indicates strong financial health with low bankruptcy probability. Scores between 1.8 and 3.0 represent moderate risk requiring closer examination, while scores below 1.8 signal high distress and a bankruptcy probability exceeding 80% within two years.
Can a company with a low Z-Score avoid bankruptcy?
Yes. The Z-Score measures probability, not certainty. Companies with low scores sometimes successfully restructure through debt reduction, asset sales, operational improvements, or capital raises. However, historical evidence shows most companies with scores below 1.8 eventually face severe financial distress or bankruptcy.