Picture this: You’re sitting at your kitchen table, scrolling through your investment account, and you see that your portfolio gained 15% last year. Sounds great, right? But then you remember you only held those investments for six months. Is that 15% gain actually good, or are you comparing apples to oranges?
This is where annualized return becomes your best friend in the investing world. It’s the secret sauce that lets you compare a three-month investment to a five-year one, a stock you bought last quarter to a mutual fund you’ve held for a decade. Without understanding annualized return, you’re essentially trying to navigate the investment landscape with a broken compass.
Whether you’re just starting your investing journey or looking to sharpen your financial literacy, mastering annualized return is non-negotiable. It’s one of those fundamental concepts that separates savvy investors from those who make costly mistakes in the stock market.
TL;DR Summary
Quick Takeaways:
- Annualized return is the average yearly rate of return on an investment over a specific period, allowing you to compare investments of different time frames on an equal basis
- The formula is: Annualized Return = [(Ending Value / Beginning Value)^(1 / Number of Years)] – 1
- A 50% return over 5 years equals an annualized return of only 8.45% per year, not 10% as many beginners assume
- Annualized return accounts for compounding effects, making it more accurate than simple average returns
- This metric is essential for evaluating mutual funds, ETFs, stocks, and passive income strategies over time
What Is Annualized Return? (The Simple Definition)
In simple terms, annualized return means the geometric average amount of money an investment earns each year over a given time period.
Think of it as converting any investment’s performance, whether it lasted 3 months, 18 months, or 10 years, into a standardized “per year” format. This standardization is what makes annualized return so powerful: it’s the universal language of investment performance.
Here’s a real-world analogy: Imagine two runners. One completes a 5K race, and another finishes a marathon. You can’t directly compare their times because they ran different distances. But if you calculate their average pace per mile, suddenly you can compare them fairly. Annualized return does the same thing for investments.
Why Annualized Return Matters
When you’re evaluating investment opportunities, you need a fair comparison tool. Without an annualized return, you might think:
- A 40% gain over 4 years is better than a 30% gain over 2 years (it’s not, the second investment has a higher annualized return)
- Your portfolio’s 25% jump in 6 months means you’re on track for 50% annual gains (again, not how it works)
- A mutual fund that returned 100% over 10 years doubled your money annually (it actually returned about 7.2% per year)
These misconceptions can lead to poor investment decisions and unrealistic expectations. Understanding annualized return helps you avoid common mistakes that cause people to lose money in the stock market.
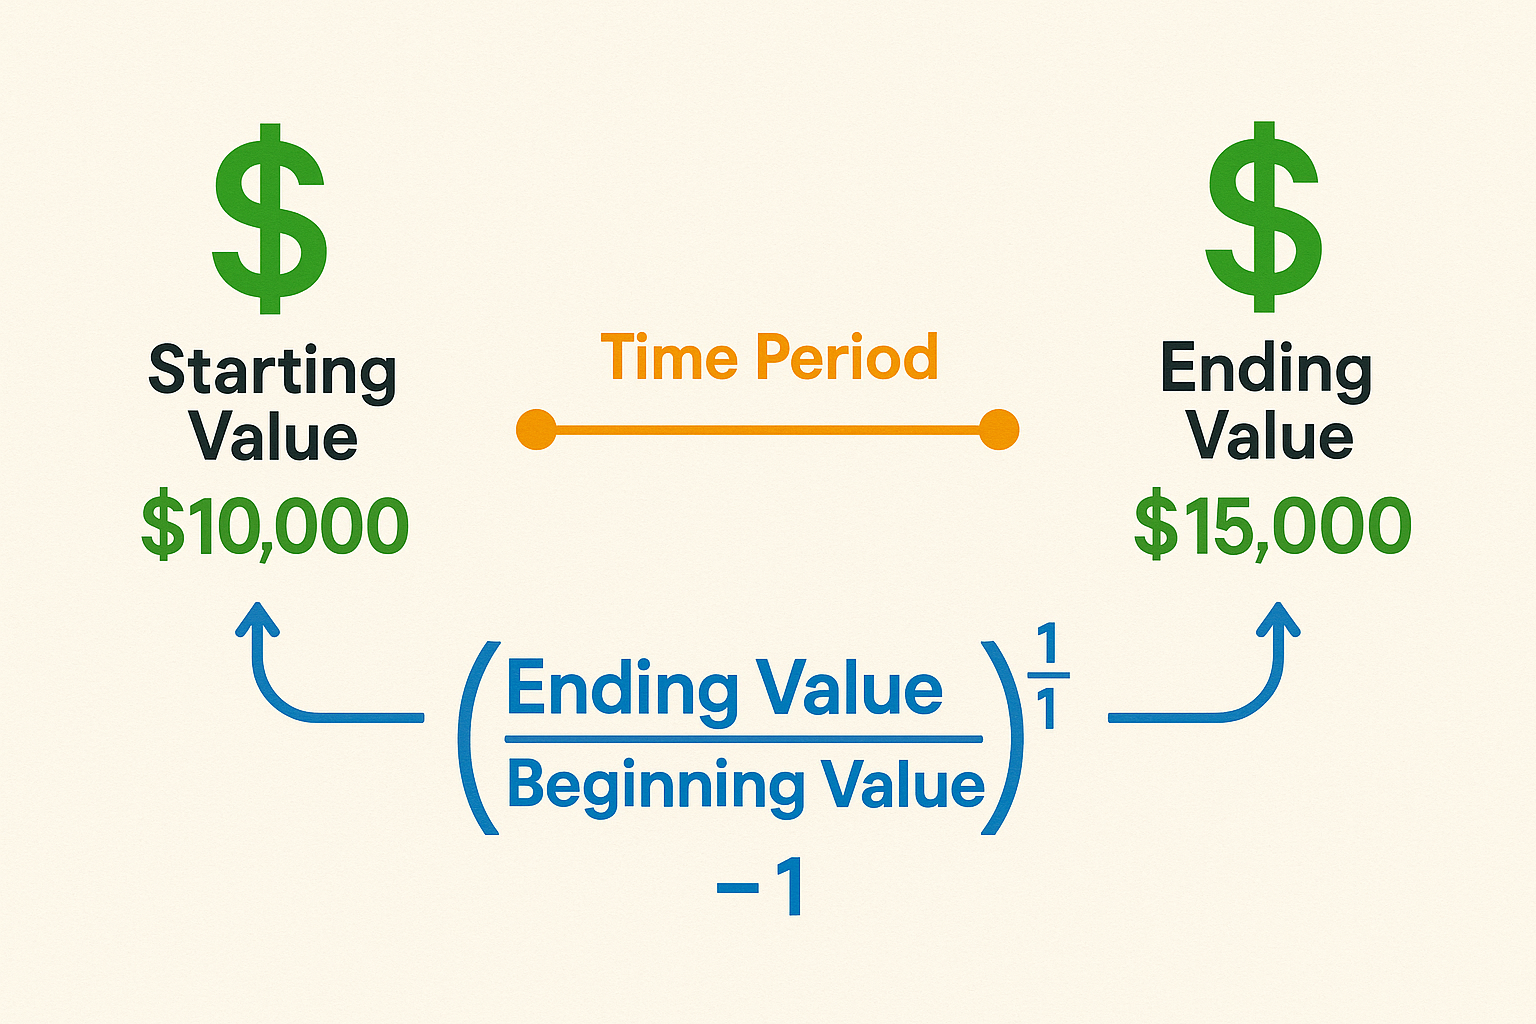
The Formula: How to Calculate Annualized Return
The formula for annualized return is:
Annualized Return = [(Ending Value / Beginning Value)^(1 / Number of Years)] – 1
Let’s break down each component:
- Ending Value: The final value of your investment
- Beginning Value: The initial amount you invested
- Number of Years: The total time period (can be a fraction, like 0.5 for 6 months)
- ^ (1 / Number of Years): This represents the root function that accounts for compounding
Converting the Formula to a Percentage
To express your annualized return as a percentage (which is how most people think about returns), simply multiply the result by 100.
Example Formula:
Annualized Return (%) = {[(Ending Value / Beginning Value)^(1 / Number of Years)] - 1} × 100Step-by-Step Calculation Examples
Let’s work through some real-world examples to make this crystal clear.
Example 1: A Simple Multi-Year Investment
Scenario: You invested $10,000 in a stock, and after 5 years, it’s worth $16,105.
Step 1: Identify your variables
- Beginning Value = $10,000
- Ending Value = $16,105
- Number of Years = 5
Step 2: Plug into the formula
Annualized Return = [(16,105 / 10,000)^(1/5)] - 1
                  = [1.6105^0.2] - 1
                  = 1.1000 - 1
                  = 0.1000 or 10%
Result: Your annualized return is 10% per year.
This means that if your investment had grown at a steady 10% each year (with compounding), you would have ended up with the same $16,105.
Example 2: An Investment Held Less Than One Year
Scenario: You bought shares worth $5,000, and after 8 months, they’re worth $5,600.
Step 1: Convert months to years
- 8 months = 8/12 = 0.667 years
Step 2: Apply the formula
Annualized Return = [(5,600 / 5,000)^(1/0.667)] - 1
                  = [1.12^1.5] - 1
                  = 1.1852 - 1
                  = 0.1852 or 18.52%
Result: Your annualized return is 18.52%.
Notice how a 12% gain over 8 months translates to an 18.52% annualized return. This is because the formula assumes that if you maintained this performance for a full year, compounding would amplify your gains.
Example 3: A Longer Investment with Dividends
Scenario: You invested $20,000 in a dividend-paying stock. After 7 years, including reinvested dividends, your total value is $35,000.
Step 1: Calculate
Annualized Return = [(35,000 / 20,000)^(1/7)] - 1
                  = [1.75^0.1429] - 1
                  = 1.0818 - 1
                  = 0.0818 or 8.18%
Result: Your annualized return is 8.18%.
This example shows how dividend investing can provide solid long-term returns when you reinvest those payments.
Annualized Return vs Average Return: Understanding the Difference
Here’s where many investors get confused: annualized return is NOT the same as average return.
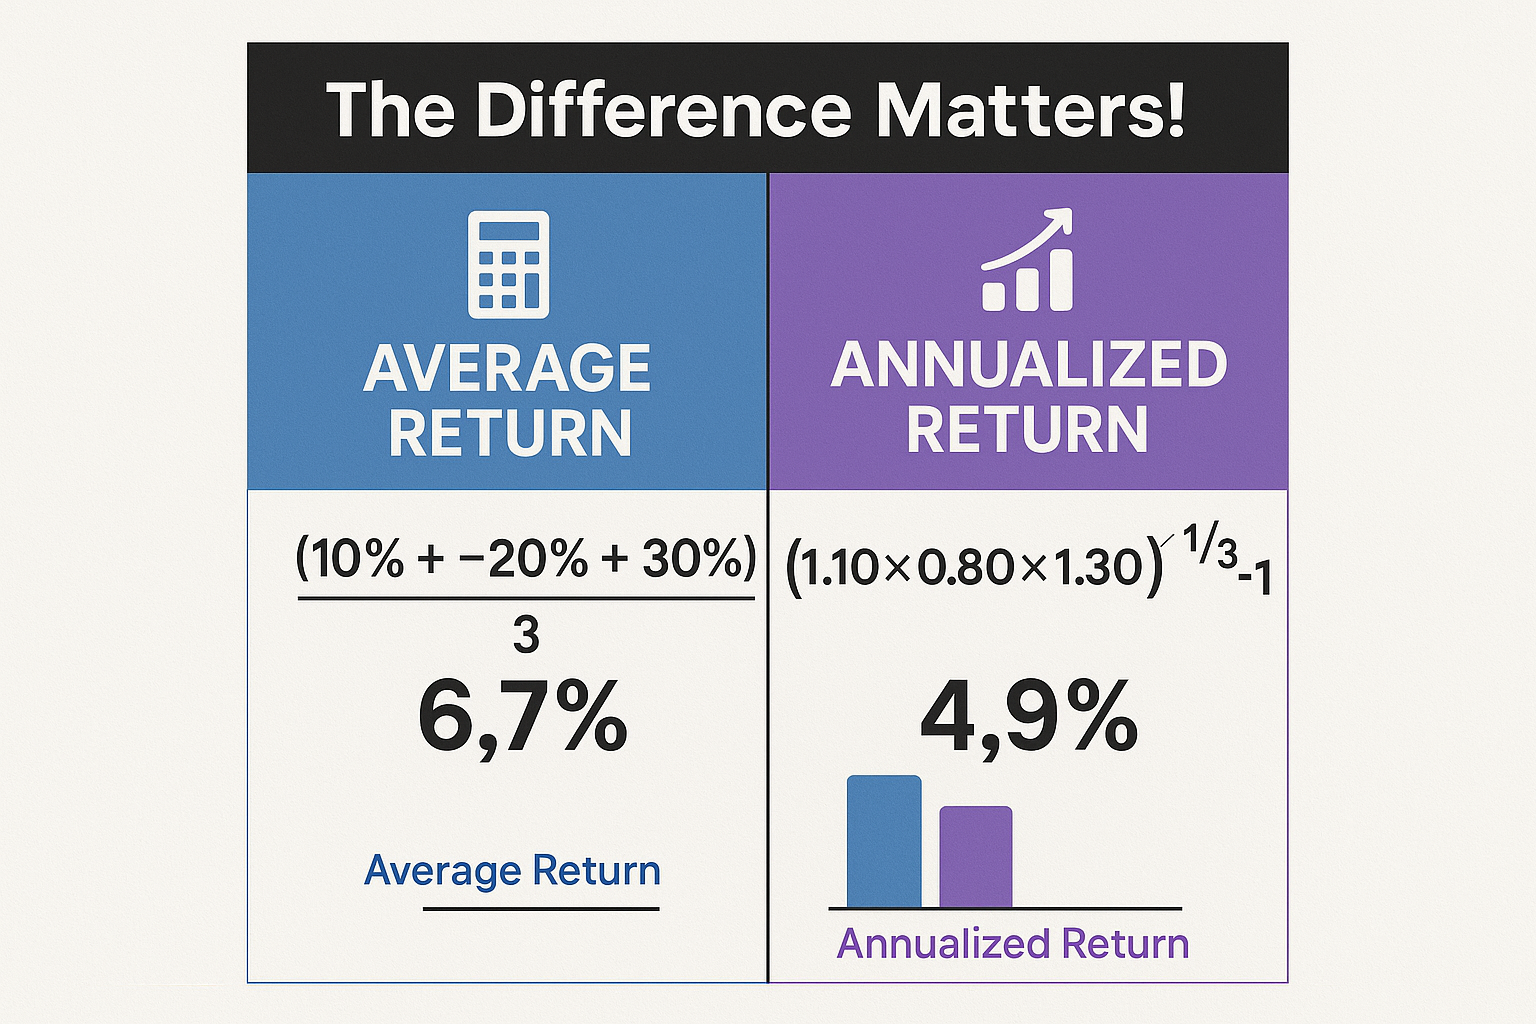
Average Return (Arithmetic Mean)
The average return is simply the sum of all yearly returns divided by the number of years.
Example:
- Year 1: +20%
- Year 2: -10%
- Year 3: +15%
Average Return = (20% + (-10%) + 15%) / 3 = 8.33%
Annualized Return (Geometric Mean)
The annualized return accounts for compounding effects.
Using the same example with a $10,000 starting investment:
- After Year 1: $10,000 × 1.20 = $12,000
- After Year 2: $12,000 × 0.90 = $10,800
- After Year 3: $10,800 × 1.15 = $12,420
Annualized Return = [(12,420 / 10,000)^(1/3)] - 1
                  = [1.242^0.333] - 1
                  = 1.0749 - 1
                  = 0.0749 or 7.49%
Key Insight: The annualized return (7.49%) is lower than the average return (8.33%) because it accounts for the compounding effect of losses and gains.
“The annualized return tells you what you actually earned per year, while the average return can be misleading, especially when returns vary significantly from year to year.”
Why Annualized Return Accounts for Compounding
The magic (and complexity) of annualized return lies in its treatment of compounding, the phenomenon where your investment earnings generate their own earnings over time.
The Compounding Effect Illustrated
Let’s say you invest $1,000 with a 10% annualized return:
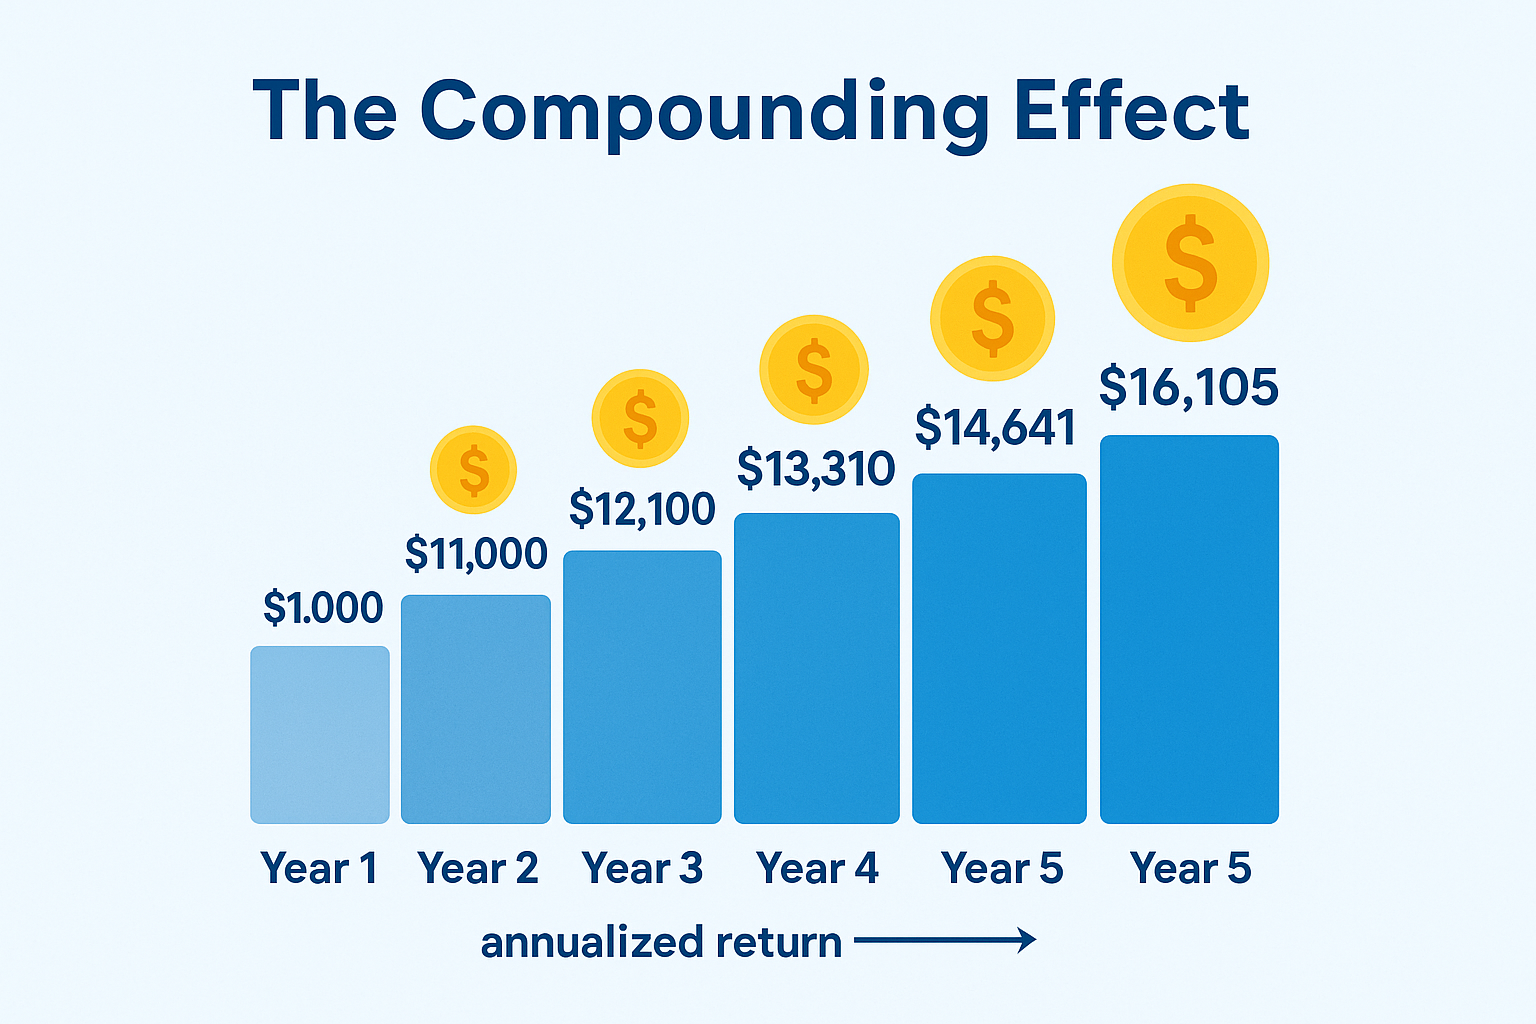
| Year | Beginning Balance | 10% Return | Ending Balance |
|---|---|---|---|
| 1 | $1,000 | $100 | $1,100 |
| 2 | $1,100 | $110 | $1,210 |
| 3 | $1,210 | $121 | $1,331 |
| 4 | $1,331 | $133.10 | $1,464.10 |
| 5 | $1,464.10 | $146.41 | $1,610.51 |
Notice how your returns grow each year? That’s compounding in action. You’re earning returns on your returns.
This is exactly why understanding annualized return matters when evaluating why the stock market tends to go up over time.
How to Use Annualized Return in Investment Decisions
Now that you understand what annualized return is and how to calculate it, let’s explore how to use this powerful metric in real-world investing scenarios.
1. Comparing Different Investments
Annualized return lets you compare investments with different time horizons on equal footing.
Example Comparison:
- Investment A: 45% return over 3 years → Annualized: 13.16%
- Investment B: 60% return over 5 years → Annualized: 9.86%
At first glance, Investment B looks better (60% vs. 45%), but when annualized, Investment A is actually the stronger performer.
2. Evaluating Mutual Funds and ETFs
When researching funds, you’ll often see performance data for 1-year, 3-year, 5-year, and 10-year periods. These are almost always presented as annualized returns, allowing you to:
Compare funds with different track records
Understand long-term performance trends
Set realistic expectations for future returns
3. Setting Investment Goals
If you’re planning for retirement or trying to make your kid a millionaire, annualized return helps you calculate how much you need to invest and what returns you need to achieve your goals.
Example Goal:
You want to turn $50,000 into $200,000 in 15 years.
Required Annualized Return = [(200,000 / 50,000)^(1/15)] - 1
                           = [4^0.0667] - 1
                           = 1.0993 - 1
                           = 0.0993 or 9.93%
You need an annualized return of about 10% to reach your goal.
4. Assessing Your Portfolio Performance
Regularly calculating your portfolio’s annualized return helps you:
- Track whether you’re meeting your investment objectives
- Identify underperforming assets
- Make informed rebalancing decisions
- Stay grounded during the cycle of market emotions
What Is a Good Annualized Return?
This is one of the most common questions investors ask, and the answer is: it depends on your investment type and risk tolerance.
Historical Benchmarks
Here are some general benchmarks based on historical data:
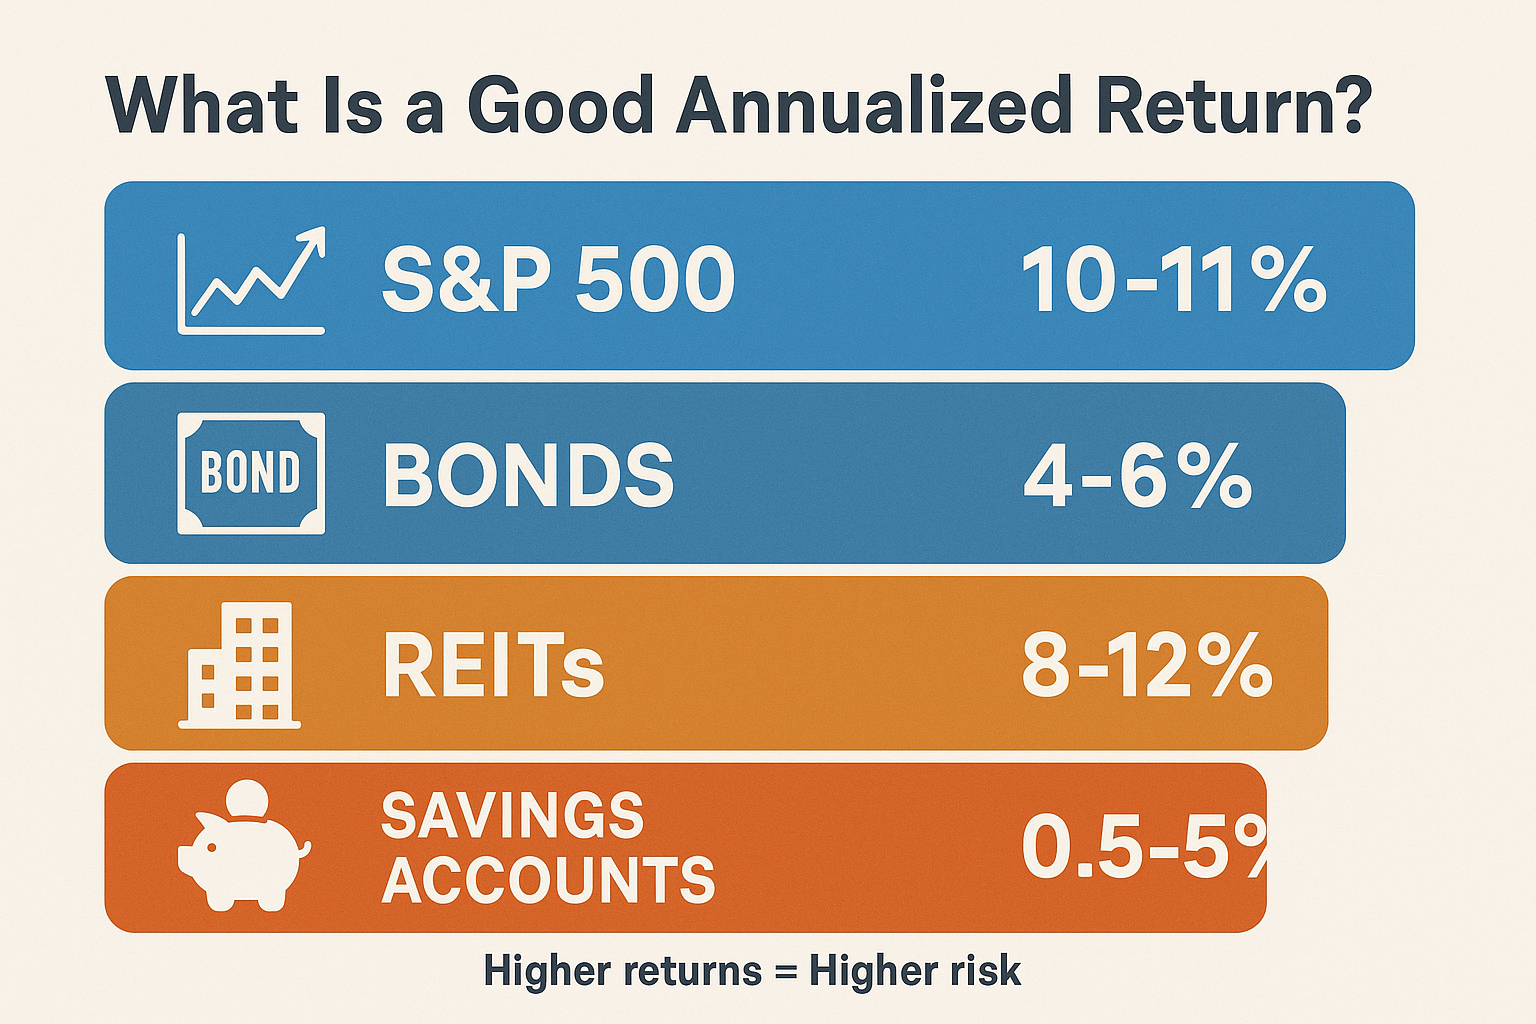
S&P 500 Index:
- Long-term average (1928-2025): ~10-11% annualized return
- Includes both price appreciation and dividends
Bonds:
- Investment-grade corporate bonds: 4-6% annualized
- Government bonds: 2-5% annualized
Real Estate:
- Real estate investment trusts (REITs): 8-12% annualized
- Direct property ownership: 6-10% annualized (varies greatly by location)
Savings Accounts:
- High-yield savings: 3-5% annualized (as of 2025)
- Traditional savings: 0.5-1% annualized
Context Matters
A “good” annualized return also depends on:
- Your investment timeline: Longer horizons can typically handle more volatility for higher returns
- Risk tolerance: Higher returns usually come with higher risk
- Market conditions: What’s good during a bull market differs from a bear market
- Inflation: Your real return (after inflation) is what truly matters
“A 7% annualized return might seem modest, but if inflation is 2%, your real return is 5%, which means your purchasing power is genuinely growing.”
Common Mistakes When Interpreting Annualized Return
Even experienced investors sometimes misinterpret annualized returns. Here are the pitfalls to avoid:
1: Confusing Annualized with Annual
Annual return = The return for one specific year
Annualized return = The average yearly return over multiple years
If a fund had returns of +15%, +5%, and +10% over three years, each of those is an annual return. The annualized return would be approximately 9.97%.
2: Ignoring Volatility
Two investments can have the same annualized return but very different risk profiles.
Example:
- Investment A: Steady 8% every year for 5 years
- Investment B: +40%, -10%, +20%, -5%, +15% over 5 years (also ~8% annualized)
Investment B is much more volatile, which matters for your stress levels and when you might need to access your money.
3: Extrapolating Short-Term Performance
Just because an investment returned 30% annualized over 6 months doesn’t mean it will continue at that pace. Short-term performance is often not sustainable.
4: Forgetting About Fees and Taxes
Published annualized returns often don’t account for:
- Management fees
- Trading costs
- Tax implications
- Inflation
Your actual, after-tax, after-fee, inflation-adjusted return is what really matters for building wealth.
5: Assuming Past Performance Predicts Future Results
This is so important that it’s required in investment disclaimers. Historical annualized returns are useful for context, but they don’t guarantee future performance.
Advanced Considerations: CAGR and Time-Weighted Returns
As you become more sophisticated in your investing journey, you’ll encounter related concepts:
Compound Annual Growth Rate (CAGR)
CAGR is essentially the same as annualized return. The terms are often used interchangeably. CAGR specifically refers to the rate at which an investment would have grown if it had grown at a steady rate, compounding annually.
The formula is identical to annualized return:
CAGR = [(Ending Value / Beginning Value)^(1 / Number of Years)] - 1Time-Weighted Return (TWR)
Time-weighted return is used when you make multiple contributions or withdrawals during the investment period. It removes the effect of cash flows to show the investment’s true performance.
When to use TWR:
- You regularly add money to your investment account (like monthly contributions to a 401(k))
- You make irregular withdrawals
- You want to evaluate a fund manager’s performance independent of investor behavior
Money-Weighted Return (MWR)
Also called the internal rate of return (IRR), this method accounts for the timing and size of cash flows. It shows the return you personally experienced, including the impact of when you added or withdrew money.
When to use MWR:
- You want to know your personal investment experience
- You made significant contributions or withdrawals at different times
- You’re evaluating whether your timing decisions helped or hurt your returns
Real-World Case Study: Comparing Two Investment Strategies
Let’s bring this all together with a realistic scenario.
Meet Sarah and James: Both started with $25,000 to invest in 2020.
Sarah’s Strategy:
- Invested in a diversified index fund
- Made no additional contributions
- By 2025, her account was worth $38,500
James’s Strategy:
- Tried to time the market with individual stocks
- Had wild swings: +40% one year, -15% the next, +25%, +5%, +10%
- By 2025, his account was also worth $38,500
Calculating Their Annualized Returns
Sarah:
Annualized Return = [(38,500 / 25,000)^(1/5)] - 1
                  = [1.54^0.2] - 1
                  = 1.0900 - 1
                  = 0.0900 or 9.00%
James:
Starting value: $25,000
- After Year 1: $25,000 × 1.40 = $35,000
- After Year 2: $35,000 × 0.85 = $29,750
- After Year 3: $29,750 × 1.25 = $37,187.50
- After Year 4: $37,187.50 × 1.05 = $39,046.88
- After Year 5: $39,046.88 × 1.10 = $42,951.57
Wait—James should have MORE than Sarah with those returns! But let’s recalculate assuming his ending value matches Sarah’s at $38,500:
Annualized Return = [(38,500 / 25,000)^(1/5)] - 1
                  = 0.0900 or 9.00%
The Lesson
Both achieved the same annualized return, but Sarah experienced:
- Less stress and emotional turbulence
- Lower trading costs
- More tax efficiency (fewer taxable events)
- More time to focus on other things
This illustrates why smart investing moves often involve simplicity and consistency rather than complexity and constant trading.
Using Annualized Return for Passive Income Planning
If you’re building passive income streams, understanding annualized return helps you project future income.
Dividend Growth Example
Suppose you invest in dividend stocks with:
- Initial investment: $50,000
- Current dividend yield: 3.5%
- Expected dividend growth: 5% annually
- Expected price appreciation: 4% annually
Total expected annualized return: ~7.5%
After 10 years:
Future Value = 50,000 × (1.075)^10
            = 50,000 × 2.061
            = $103,050
With a 3.5% dividend yield on that future value, your annual dividend income would be approximately $3,607, and that’s assuming the yield stays constant (it would likely be higher on your original cost basis). Corporate Finance Institute
The Interactive Calculator Experience
To help you master annualized return calculations, I’ve created an interactive calculator below. Play around with different scenarios to see how time, starting values, and ending values affect your annualized return.
📊 Annualized Return Calculator
Calculate your investment’s true performance over time
Limitations and Risks of Relying Solely on Annualized Return
While annualized return is an invaluable tool, it’s not perfect. Understanding its limitations will make you a more sophisticated investor.
1. It Doesn’t Show Volatility or Risk
Two investments with identical annualized returns can have vastly different risk profiles. Annualized return doesn’t tell you:
- How bumpy the ride was
- Maximum drawdown (largest peak-to-trough decline)
- How often has the investment lost money
- Standard deviation of returns
2. It Assumes Reinvestment
The annualized return calculation assumes all gains are reinvested. If you withdrew dividends or took profits along the way, your experience would differ.
3. It’s Backward-Looking
Annualized return tells you what happened, not what will happen. Market conditions change, and past performance doesn’t guarantee future results.
4. It Can Be Misleading for Short Periods
Annualizing a very short-term return (like one month) can create unrealistic expectations. A 5% gain in one month annualizes to over 79%, but sustaining that pace is virtually impossible.
5. It Doesn’t Account for External Factors
Annualized return doesn’t consider:
- Fees and expenses
- Taxes
- Inflation
- Currency fluctuations (for international investments)
- Your personal cash flow needs
FAQ
Historically, the stock market has returned approximately 10-11% annualized over the long term (based on S&P 500 data from 1928-2025). However, a “good” return depends on your investment strategy, risk tolerance, and market conditions. Conservative investors might target 6-8%, while aggressive growth investors might aim for 12-15% or higher, understanding that higher targets come with increased risk.
The formula for annualized return is: [(Ending Value / Beginning Value)^(1 / Number of Years)] – 1. Multiply by 100 to express as a percentage. This formula accounts for compounding and gives you the geometric average return per year.
Yes, annualized return and Compound Annual Growth Rate (CAGR) are essentially the same thing. Both represent the geometric average growth rate of an investment over a specified time period, assuming the profits are reinvested at the end of each period.
Absolutely. If your investment loses value over time, your annualized return will be negative. For example, if you invested $10,000 and it’s now worth $8,000 after 3 years, your annualized return would be approximately -7.21%.
Annualized return (geometric mean) accounts for compounding and provides a more accurate picture of investment performance, while average return (arithmetic mean) simply adds up all the returns and divides by the number of periods. Annualized return is almost always lower than average return when there’s volatility.
Use annualized return when comparing investments held for different time periods, as it standardizes performance to a per-year basis. Use total return when you want to know the absolute gain or loss over a specific period. Both metrics are valuable for different purposes.
It can, depending on how it’s calculated. “Total annualized return” includes dividends, interest, and capital gains. “Price annualized return” only includes price appreciation. Always check which version you’re looking at when evaluating investments.
Key Takeaways and Action Steps
You’ve now mastered one of the most important concepts in investing. Here’s what to remember:
Core Concepts to Remember
- Annualized return standardizes performance across different time periods, making apples-to-apples comparisons possible
- The formula accounts for compounding, which is why it differs from simple average returns
- Context matters: A good annualized return depends on your goals, risk tolerance, and investment type
- It’s one tool among many: Use it alongside other metrics like volatility, maximum drawdown, and risk-adjusted returns
Your Action Plan
1: Calculate Your Current Portfolio’s Annualized Return
- Gather your account statements from when you started investing
- Use the calculator above or the formula to determine your annualized return
- Compare it to relevant benchmarks (S&P 500, bond indexes, etc.)
2: Set Realistic Expectations
- Based on your asset allocation, determine a reasonable target annualized return
- Remember that higher returns typically require accepting higher risk
- Factor in fees, taxes, and inflation when setting goals
3: Use Annualized Return for Decision-Making
- When evaluating new investments, calculate and compare their historical annualized returns
- Don’t chase high short-term returns; focus on sustainable long-term performance
- Rebalance your portfolio based on whether assets are meeting their expected annualized return targets
4: Track and Review Regularly
- Calculate your portfolio’s annualized return at least annually
- Keep a record to identify trends and patterns
- Adjust your strategy if you’re consistently underperforming your goals
5: Continue Your Education
- Explore related concepts like Sharpe ratio, standard deviation, and alpha
- Learn about smart investing strategies that can improve your returns
- Stay informed about market conditions and economic factors
Conclusion: Your Path to Investment Mastery
Understanding annualized return isn’t just about crunching numbers; it’s about developing the financial literacy to make informed decisions that align with your goals. Whether you’re building passive income through dividends, saving for retirement, or growing your wealth through stock market investing, this metric will be your constant companion.
The investors who succeed over the long term aren’t necessarily the ones who find the highest-returning investments. They’re the ones who:
Understand what their returns truly mean
Set realistic expectations based on historical data
Make decisions based on facts, not emotions
Stay consistent through market ups and downs
Continuously educate themselves
You now have the knowledge to calculate, interpret, and apply annualized return to your investment decisions. The question is: what will you do with it?
Start by calculating your own portfolio’s annualized return today. Be honest about your performance. Compare it to relevant benchmarks. Then make a plan to improve—not by chasing unrealistic returns, but by building a solid, diversified portfolio that can deliver consistent, compounded growth over time.
Remember, investing is a marathon, not a sprint. Your annualized return over 20 or 30 years matters far more than what happens in any single year. Stay the course, keep learning, and let the power of compounding work its magic.
The journey to financial independence starts with understanding the numbers. You’ve just taken a major step forward.
References and Further Reading
For those who want to dive deeper into annualized returns and investment performance metrics, here are authoritative sources:
- U.S. Securities and Exchange Commission (SEC): Investor.gov – Compound Returns
- CFA Institute: “Investment Performance Measurement” standards and guidelines
- Morningstar: Historical market return data and fund performance metrics
- Investopedia: Comprehensive articles on CAGR, geometric vs. arithmetic returns, and investment performance
- Federal Reserve Economic Data (FRED): Historical economic and market data
Disclaimer:
This article is for educational purposes only and does not constitute financial advice. Investment returns can be volatile, and past performance does not guarantee future results. Before making any investment decisions, consider your financial situation, risk tolerance, and investment objectives. Consult with a qualified financial advisor for personalized guidance. The annualized return calculations and examples provided are for illustrative purposes and may not reflect your actual investment experience.
Author Bio
Max Fonji is the founder of TheRichGuyMath.com, where he breaks down complex finance and investing topics into clear, actionable ideas for beginners and seasoned investors alike. With a focus on building authority, educating through data-driven insights, and helping readers make better long-term investment decisions, Max Fonji covers everything from return metrics to portfolio strategy and behavioral finance with over a decade of expexperience.