Ever wonder how companies actually make and spend their money? While profit numbers on an income statement might look impressive, they don’t tell you whether a business has cash in the bank to pay bills, invest in growth, or weather tough times. That’s where the cash flow statement comes in, the financial document that reveals the real story of how money moves through a business.
TL;DR
- A cash flow statement tracks the actual movement of cash in and out of a business during a specific period, divided into three categories: operating, investing, and financing activities
- Operating cash flow shows money from core business operations, investing cash flow reveals capital expenditures and investments, while financing cash flow displays debt and equity transactions
- Positive cash flow doesn’t always mean profitability, and profitable companies can still run out of cash—understanding all three sections together provides the complete financial picture
- Investors use cash flow statements to assess a company’s liquidity, financial health, and ability to generate sustainable returns before making investment decisions
- The cash flow statement complements the income statement and balance sheet, providing the missing piece that shows whether reported profits translate into actual cash
What Is a Cash Flow Statement?
In simple terms, a cash flow statement is a financial document that shows how much cash a company generated and used during a specific time period. Unlike the income statement (which uses accrual accounting and can include non-cash items), the cash flow statement focuses exclusively on actual cash transactions.
Think of it this way: your income statement might show you earned $10,000 in revenue, but if customers haven’t paid you yet, you don’t have that cash in hand. The cash flow statement reveals what actually hits your bank account.
Why Cash Flow Statements Matter
For investors, entrepreneurs, and anyone interested in understanding the stock market, the cash flow statement is essential because:
Cash is king – A company can show accounting profits but still go bankrupt if it runs out of cash
It reveals financial health – Consistent positive cash flow indicates a sustainable business model
It shows management decisions – How a company invests and finances operations tells you about strategy
It prevents manipulation – Cash is harder to manipulate than earnings, making this statement more reliable
According to the SEC (Securities and Exchange Commission), publicly traded companies must include cash flow statements in their quarterly and annual reports, making them a cornerstone of financial transparency.
The Three Sections of a Cash Flow Statement
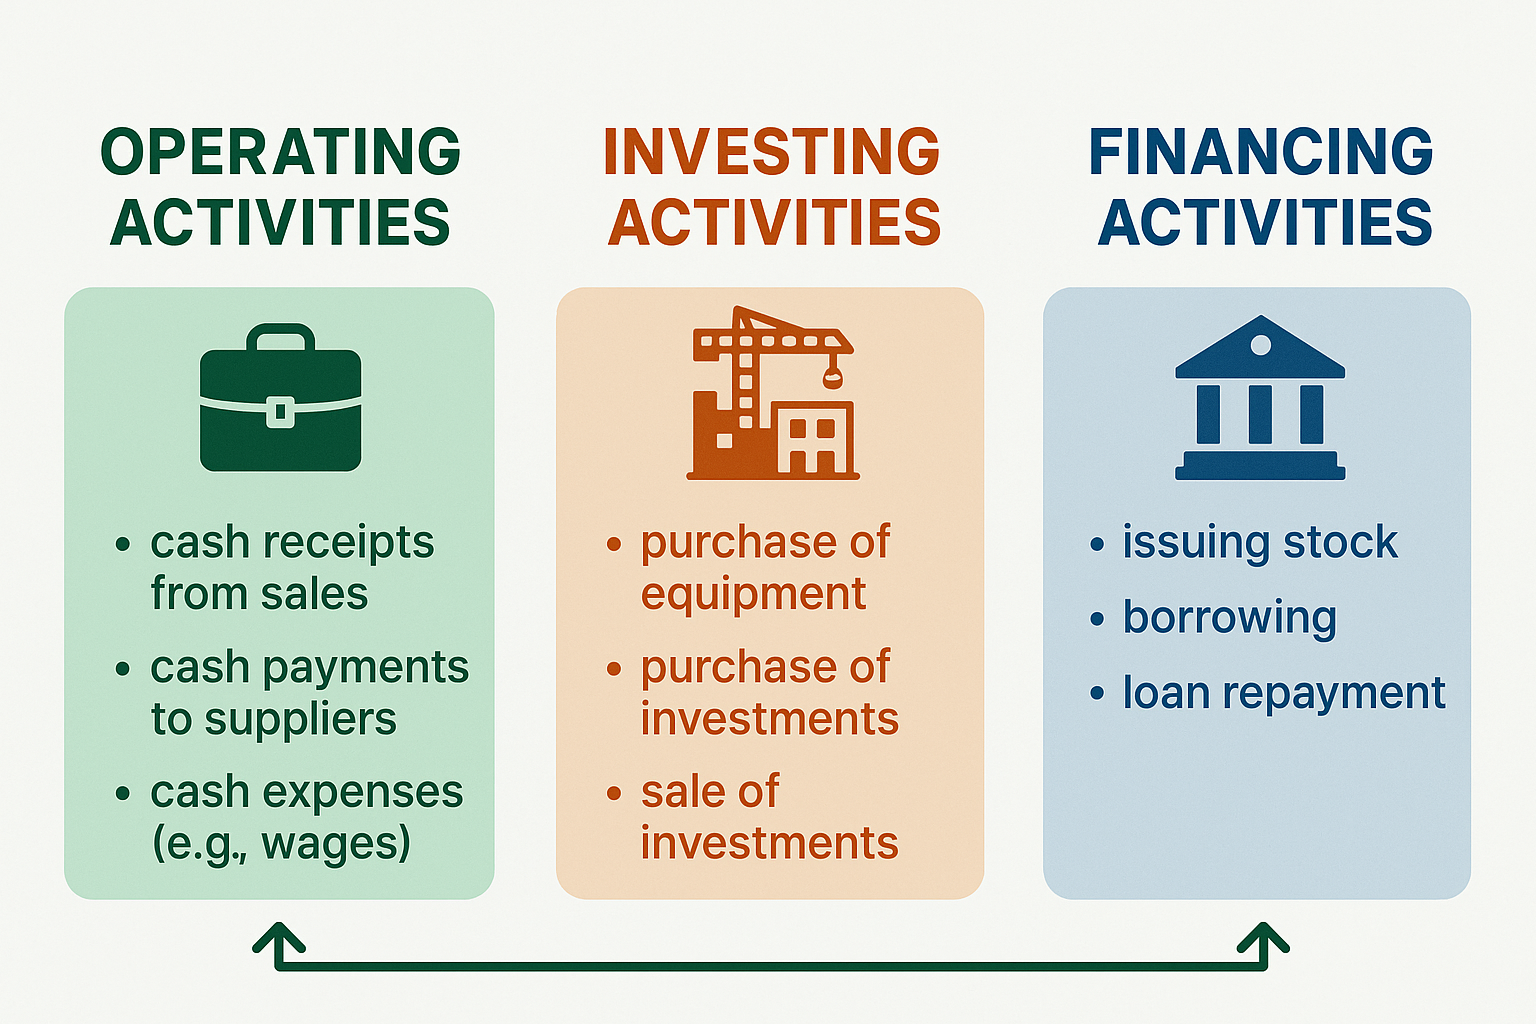
Every cash flow statement divides cash movements into three distinct categories. Understanding each section helps you see the complete financial picture of any business.
1. Operating Activities (Cash Flow from Operations)
Operating cash flow shows the cash generated or used by a company’s core business operations. This is the most important section for most investors because it reveals whether the company’s main business model actually generates cash.
What’s Included in Operating Activities:
- Cash received from customers for goods or services
- Cash paid to suppliers and employees
- Cash paid for operating expenses (rent, utilities, marketing)
- Interest and tax payments
- Changes in working capital (accounts receivable, inventory, accounts payable)
The Formula for Operating Cash Flow:
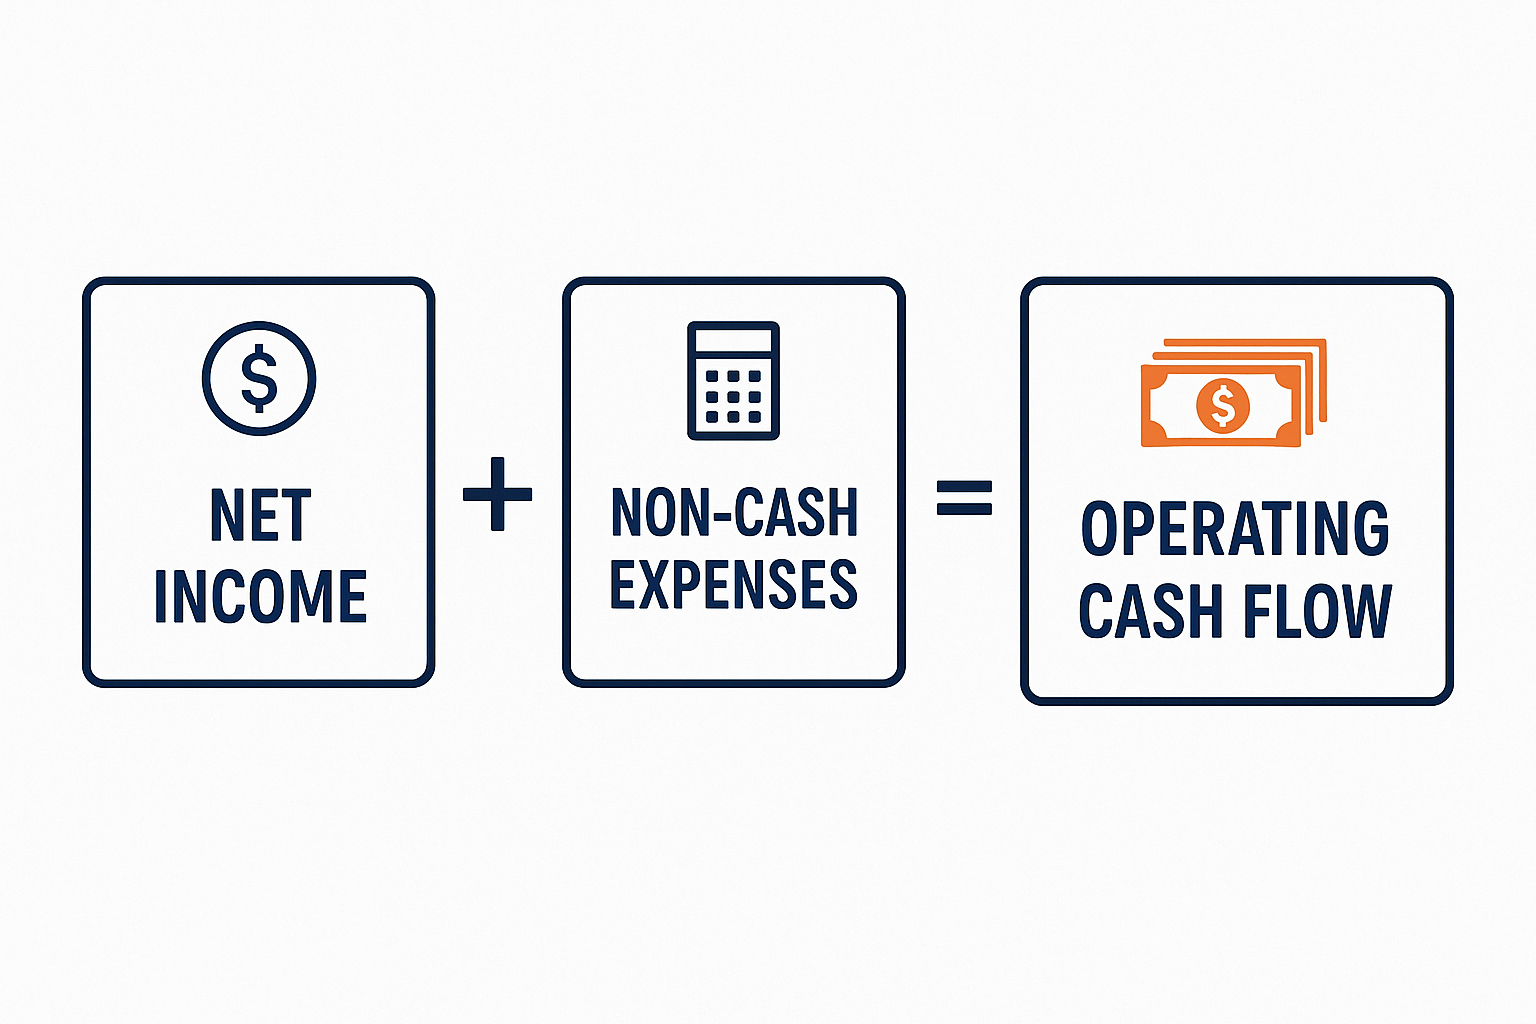
Operating Cash Flow = Net Income + Non-Cash Expenses + Changes in Working Capital
Example:
Imagine a retail company reports $500,000 in net income. However, they also had $100,000 in depreciation (a non-cash expense), customers owe them $150,000 (increase in accounts receivable), and they owe suppliers $80,000 (increase in accounts payable).
Operating Cash Flow = $500,000 + $100,000 – $150,000 + $80,000 = $530,000
“A company with strong operating cash flow can fund growth, pay dividends, and reduce debt without relying on external financing—that’s financial independence.”
2. Investing Activities (Cash Flow from Investing)
Investing cash flow tracks money spent on or received from long-term investments and capital assets. This section shows how a company is positioning itself for future growth.
What’s Included in Investing Activities:
- Purchase or sale of property, plant, and equipment (PP&E)
- Acquisition or sale of other businesses
- Purchase or sale of investment securities (stocks, bonds)
- Loans made to other entities or collected from borrowers
A negative investing cash flow isn’t necessarily bad—it often means the company is investing in growth. However, consistently large negative numbers without corresponding revenue growth could signal poor capital allocation.
Real-World Example:
Tech companies like Apple regularly show negative investing cash flow because they invest billions in research facilities, manufacturing equipment, and acquisitions. In 2024, Apple reported approximately $10 billion in capital expenditures—money spent to maintain and grow its business infrastructure.
3. Financing Activities (Cash Flow from Financing)
Financing cash flow displays how a company raises capital and returns money to investors. This section reveals the company’s funding strategy and relationship with shareholders and creditors.
What’s Included in Financing Activities:
- Issuing or repurchasing stock
- Issuing or repaying debt (bonds, loans)
- Paying dividends to shareholders
- Payment of financing costs
What Positive vs Negative Financing Cash Flow Means:
| Cash Flow Direction | What It Typically Indicates |
|---|---|
| Positive | A company is raising capital through debt or equity, which may indicate a growth phase or financial stress |
| Negative | Company is returning cash to shareholders (dividends, buybacks) or paying down debt; often signals financial strength |
For investors interested in dividend investing, the financing section shows exactly how much cash a company distributed to shareholders.
How to Read a Cash Flow Statement: Step-by-Step Guide
Let’s walk through reading an actual cash flow statement using a simplified example:
XYZ Corporation – Cash Flow Statement (Year Ended 2025)
Operating Activities:
- Net Income: $1,000,000
- Depreciation & Amortization: +$200,000
- Increase in Accounts Receivable: -$150,000
- Increase in Inventory: -$100,000
- Increase in Accounts Payable: +$50,000
- Net Cash from Operating Activities: $1,000,000
Investing Activities:
- Purchase of Equipment: -$400,000
- Sale of Investments: +$100,000
- Net Cash from Investing Activities: -$300,000
Financing Activities:
- Proceeds from Bank Loan: +$200,000
- Dividend Payments: -$150,000
- Stock Repurchases: -$100,000
- Net Cash from Financing Activities: -$50,000
Net Increase in Cash: $650,000
Cash at Beginning of Period: $500,000
Cash at End of Period: $1,150,000
What This Tells Us:
- Strong operating cash flow ($1M) shows the core business is healthy
- Negative investing cash flow ($300K) indicates growth investments
- Negative financing cash flow ($50K) shows the company is returning value to shareholders while also taking on some debt
- Overall, cash increased by $650K, strengthening the balance sheet
Operating Cash Flow vs Net Income: Understanding the Difference
One of the most important concepts in financial analysis is understanding why operating cash flow and net income can differ significantly.
Key Differences:
Net Income (from Income Statement):
- Uses accrual accounting
- Includes non-cash expenses (depreciation, amortization)
- Recognizes revenue when earned, not when cash is received
- Can be influenced by accounting choices
Operating Cash Flow:
- Shows actual cash movements
- Adds back non-cash expenses
- Adjusts for timing differences in receivables and payables
- Harder to manipulate
“Investors use operating cash flow to measure a company’s ability to generate cash from its core business—it’s the ultimate test of business model viability.”
Why Companies Can Be Profitable But Cash-Poor:
Imagine a growing software company that:
- Books $2 million in annual subscriptions (revenue recognized upfront)
- But customers pay monthly for over 12 months
- Simultaneously invests heavily in servers and infrastructure
- Hires aggressively to support growth
This company might show strong profits on paper, but struggles with cash flow because:
- Revenue is recognized before cash is collected
- Capital expenditures consume cash immediately
- Payroll must be paid regardless of customer payment timing
Understanding why people lose money in the stock market often comes down to ignoring cash flow in favor of flashy revenue numbers.
How Investors Use Cash Flow Statements
Professional investors and analysts rely on cash flow statements to make informed decisions. Here are the key metrics and ratios they examine:
1. Free Cash Flow (FCF)
Free Cash Flow = Operating Cash Flow – Capital Expenditures
Free cash flow represents the cash available after maintaining or expanding the asset base. Companies with strong FCF can:
- Pay dividends
- Reduce debt
- Make acquisitions
- Repurchase shares
A higher free cash flow usually indicates a company has flexibility and financial strength.
2. Operating Cash Flow Ratio
Operating Cash Flow Ratio = Operating Cash Flow ÷ Current Liabilities
This ratio measures whether a company can cover its short-term obligations with cash from operations. A ratio above 1.0 is generally considered healthy.
3. Cash Flow Margin
Cash Flow Margin = Operating Cash Flow ÷ Revenue
This percentage shows how efficiently a company converts sales into actual cash. Higher margins indicate better operational efficiency.
4. Cash Flow to Debt Ratio
Cash Flow to Debt Ratio = Operating Cash Flow ÷ Total Debt
This metric reveals how quickly a company could pay off all debt using operating cash flow. Higher ratios suggest lower financial risk.
Interpreting Cash Flow Patterns: What Different Scenarios Mean
The combination of positive or negative cash flows across all three sections tells a story about a company’s life stage and financial health.
Healthy, Mature Company
- Operating: Positive (strong core business)
- Investing: Negative (moderate reinvestment)
- Financing: Negative (paying dividends, reducing debt)
This pattern indicates a stable, profitable business returning value to shareholders. Many high dividend stocks show this profile.
High-Growth Startup
- Operating: Negative or barely positive (investing in growth)
- Investing: Negative (heavy capital investment)
- Financing: Positive (raising capital)
This pattern is typical for fast-growing companies that need external funding to fuel expansion.
Struggling Company
- Operating: Negative (core business losing money)
- Investing: Positive (selling assets to raise cash)
- Financing: Positive (borrowing to stay afloat)
This dangerous pattern suggests a company is burning cash and selling assets to survive.
Turnaround Story
- Operating: Turning positive (improving business model)
- Investing: Minimal (conserving cash)
- Financing: Negative (paying down debt accumulated during tough times)
This pattern can signal a successful recovery, though it requires careful monitoring.
Common Mistakes When Analyzing Cash Flow Statements
Even experienced investors can misinterpret cash flow data. Here are pitfalls to avoid:
1: Ignoring Quality of Earnings
Not all positive operating cash flow is created equal. If cash flow comes primarily from:
- Delaying payments to suppliers (increasing payables)
- Aggressive collection from customers (decreasing receivables)
- Reducing inventory to dangerously low levels
…then the cash flow improvement may be temporary and unsustainable.
2: Overlooking Capital Requirements
Some businesses require constant capital investment just to maintain operations. Comparing operating cash flow without considering capital expenditures (CapEx) can be misleading.
Always look at Free Cash Flow, not just operating cash flow.
3: Treating All Negative Investing Cash Flow Equally
Negative cash flow from acquiring productive assets or strategic companies differs vastly from money lost on failed investments or overpriced acquisitions.
4: Missing One-Time Items
Unusual items like lawsuit settlements, asset sales, or tax refunds can temporarily boost cash flow. Identify and adjust for these to understand sustainable cash generation.
5: Forgetting Industry Context
Capital-intensive industries (manufacturing, utilities) naturally show different cash flow patterns than asset-light businesses (software, consulting). Always compare companies within their industry context.
Cash Flow Statement vs Income Statement vs Balance Sheet
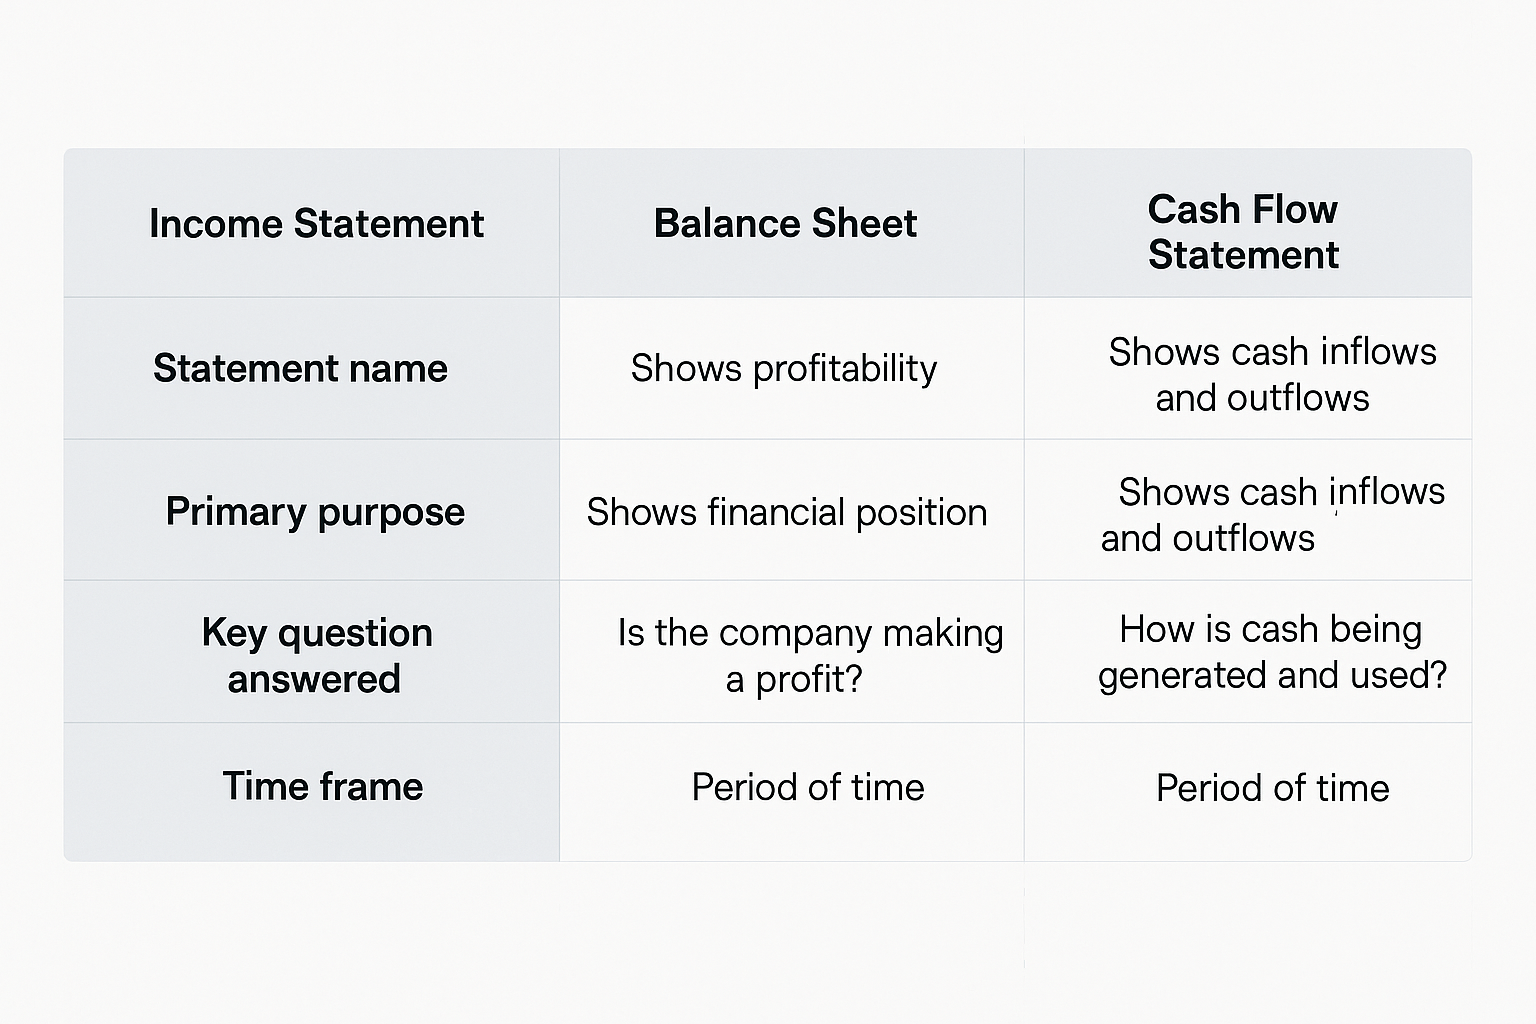
Understanding how these three core financial statements work together provides complete financial insight.
| Statement | Primary Purpose | Key Question Answered | Time Frame |
|---|---|---|---|
| Income Statement | Shows profitability | Did the company make a profit? | Period of time |
| Balance Sheet | Shows financial position | What does the company own and owe? | Specific point in time |
| Cash Flow Statement | Shows cash movements | Where did cash come from and go? | Period of time |
How They Connect:
- Net income from the income statement is the starting point for operating cash flow
- Changes in balance sheet accounts (receivables, payables, inventory) adjust net income to arrive at cash flow
- Cash balance on the balance sheet should equal the ending cash on the cash flow statement
“The three financial statements together tell the complete story—income statement shows profitability, balance sheet shows financial position, and cash flow statement shows liquidity and sustainability.”
For those learning about smart money moves, mastering all three statements is essential. See our full guide on Statement of Shareholders’ Equity
Real-World Case Study: Analyzing a Tech Company’s Cash Flow
Let’s examine how cash flow analysis works in practice using a hypothetical but realistic tech company scenario.
TechGrowth Inc. – 2025 Cash Flow Highlights:
Operating Activities: $800 million
- Net income: $600M
- Depreciation: $150M
- Stock-based compensation: $100M
- Increase in deferred revenue: $50M (customers prepaying)
- Working capital changes: -$100M
Investing Activities: -$500 million
- Capital expenditures: -$300M (data centers, equipment)
- Acquisitions: -$250M (bought two smaller competitors)
- Sale of investments: +$50M
Financing Activities: -$200 million
- Stock repurchases: -$300M
- Proceeds from stock option exercises: +$100M
Net increase in cash: $100 million
Analysis:
Strengths:
- Strong operating cash flow of $800M shows the core business is highly profitable
- Positive free cash flow ($800M – $300M CapEx = $500M) provides financial flexibility
- Returning $300M to shareholders through buybacks demonstrates confidence
- Strategic acquisitions suggest a growth focus
Considerations:
- Heavy reliance on stock-based compensation (adds $100M to operating cash flow but dilutes shareholders)
- Significant acquisition spending requires monitoring to ensure value creation
- Working capital consumption of $100M bears watching
This pattern suggests a healthy, growing company with strong fundamentals—the type that might appear in analyses of why the stock market goes up over time.
How to Find and Read Cash Flow Statements
Ready to start analyzing real companies? Here’s where to find cash flow statements:

For Public Companies:
- SEC EDGAR Database (sec.gov/edgar)
- Search for any public company
- Look for 10-K (annual) or 10-Q (quarterly) reports
- The cash flow statement is typically the third financial statement
- Company Investor Relations Pages
- Most companies post financial reports on their websites
- Navigate to “Investors” or “Investor Relations”
- Find quarterly earnings reports
- Financial Data Platforms
- Yahoo Finance, Google Finance (free)
- Morningstar, Bloomberg (subscription)
- These platforms often present data in easy-to-read formats
What to Look For:
Trend Analysis: Compare 3-5 years of cash flow data
Consistency: Look for stable or growing operating cash flow
Red Flags: Operating cash flow consistently below net income
Capital Allocation: How management invests and returns cash
Industry Comparison: Benchmark against competitors
Advanced Cash Flow Metrics for Serious Investors
Once you’ve mastered the basics, these advanced metrics provide deeper insights:
1. Cash Conversion Cycle
Cash Conversion Cycle = Days Inventory Outstanding + Days Sales Outstanding – Days Payable Outstanding
This measures how quickly a company converts investments in inventory back into cash. Shorter cycles are generally better. See our full guide on Cash Conversion Cycle
2. Cash Return on Invested Capital (CROIC)
CROIC = Free Cash Flow ÷ Invested Capital
This shows how efficiently a company generates cash from its total capital base.
3. Price to Cash Flow Ratio
P/CF Ratio = Market Price per Share ÷ Operating Cash Flow per Share
Similar to the P/E ratio, but uses cash flow instead of earnings, providing a harder-to-manipulate valuation metric.
4. Dividend Coverage Ratio
Dividend Coverage = Free Cash Flow ÷ Dividends Paid
For income investors exploring passive income through dividends, this ratio shows whether dividends are sustainable. A ratio above 1.5 is generally considered safe.
Cash Flow Considerations for Different Investment Strategies
Your investment approach should influence how you analyze cash flow statements:
For Value Investors
Focus on:
- Consistent positive free cash flow
- Low price-to-cash-flow ratios
- Strong cash flow relative to debt
- History of returning cash to shareholders
For Growth Investors
Look for:
- Rapidly growing operating cash flow
- Strategic reinvestment (negative cash flow)
- Improving cash flow margins
- Declining capital requirements as the business scales
For Income Investors
Prioritize:
- Stable, predictable operating cash flow
- High free cash flow to dividend payout ratio
- Low debt levels
- History of maintaining dividends through economic cycles
Understanding these patterns helps when building wealth for the next generation through smart investing.
The Psychology of Cash Flow: Avoiding Emotional Mistakes
Cash flow analysis isn’t just about numbers—it’s about maintaining discipline during market volatility.
The cycle of market emotions often leads investors to:
- Panic sell during temporary cash flow disruptions
- Overpay for companies with impressive revenue but poor cash generation
- Ignore warning signs when emotionally attached to a stock
How Cash Flow Analysis Provides Emotional Stability:
✓ Objective metrics cut through market hype and fear
✓ Long-term trends reveal sustainable business models
✓ Red flags appear early in cash flow statements
✓ Valuation discipline prevents overpaying for growth
“Investors who focus on cash flow fundamentals are less likely to be swayed by short-term market sentiment—they’re buying businesses, not lottery tickets.”
Key Risks and Limitations of Cash Flow Analysis
While cash flow statements are invaluable, they have limitations:
1. Timing Issues
Cash flow can be lumpy—large one-time receipts or payments can distort quarterly results. Always analyze multiple periods.
2. Industry Differences
Comparing cash flow metrics across different industries can be misleading. A software company and a manufacturing firm will have vastly different capital requirements.
3. Accounting Choices
While harder to manipulate than earnings, companies still make choices that affect cash flow presentation, such as:
- Classification of certain items
- Timing of capital expenditures
- Treatment of leases and financing arrangements
4. Missing Context
Cash flow statements don’t show:
- Quality of management decisions
- Competitive positioning
- Market opportunities or threats
- Technological disruption risks
5. Historical Nature
Cash flow statements report past performance. They don’t predict future cash generation, though trends can be informative.
Always combine cash flow analysis with qualitative assessment and forward-looking research.
References
- Investopedia: Comprehensive financial education resource
- Morningstar: Independent investment research and data
- CFA Institute: Professional standards for investment analysis
FAQ
A good operating cash flow is positive, growing over time, and exceeds net income. Specifically, investors look for operating cash flow that consistently covers capital expenditures with money left over (positive free cash flow). The operating cash flow margin (operating cash flow ÷ revenue) should ideally be 15% or higher for most businesses, though this varies significantly by industry.
Free cash flow is calculated by subtracting capital expenditures from operating cash flow: Free Cash Flow = Operating Cash Flow – Capital Expenditures. You’ll find operating cash flow at the bottom of the operating activities section and capital expenditures (often listed as “purchase of property, plant, and equipment”) in the investing activities section. This metric shows how much cash a company has available after maintaining or expanding its asset base.
Yes, though it’s rare. A company could have a temporarily positive cash flow from selling assets, taking on debt, or collecting old receivables while the underlying business continues to lose money. If operating cash flow is negative and the company is simply raising cash through financing activities, bankruptcy remains a risk. This is why analyzing all three sections together is crucial; the source of positive cash flow matters as much as the amount.
Profit (net income) is an accounting measure that uses accrual accounting and includes non-cash items like depreciation. Cash flow measures actual cash moving in and out of the business. A company can be profitable on paper but cash-poor if customers haven’t paid yet, or it can have positive cash flow while showing accounting losses due to large depreciation charges. Cash flow is generally considered a more reliable indicator of financial health because cash can’t be manipulated as easily as accounting profits.
Negative operating cash flow typically means the company is spending more cash on operations than it’s generating from customers. This happens in several scenarios: early-stage companies investing heavily in growth before revenue scales, seasonal businesses during off-peak periods, companies experiencing rapid growth that requires working capital investment, or struggling businesses losing money. Context matters—negative operating cash flow is normal for startups but concerning for mature companies.
Serious investors should review cash flow statements quarterly when companies report earnings. However, focus on trends over multiple quarters or years rather than obsessing over single-period fluctuations. Annual cash flow statements (from 10-K reports) provide the most comprehensive view. For long-term investors, reviewing cash flow statements annually while monitoring quarterly trends for significant changes is a balanced approach.
Positive investing cash flow typically means the company is selling assets or investments rather than buying them. This could indicate: the company is divesting non-core assets (potentially positive), the company is selling productive assets to raise cash (potentially concerning), or the company is collecting on loans or selling investment securities (neutral). Context is crucial—occasional asset sales are normal, but consistent positive investing cash flow while the business is supposedly growing raises red flags.
Conclusion: Mastering Cash Flow for Investment Success
The cash flow statement is your window into the real financial health of any business. While income statements can be influenced by accounting choices and balance sheets show only a snapshot in time, the cash flow statement reveals the truth: Is this company actually generating cash?
Your Next Steps to Cash Flow Mastery:
- Start practicing by pulling up cash flow statements for 3-5 companies you’re interested in
- Calculate key metrics like free cash flow, cash flow margin, and operating cash flow ratio
- Compare competitors within the same industry to understand normal patterns
- Track trends over 3-5 years to identify improving or deteriorating cash generation
- Integrate cash flow analysis into your investment checklist before buying any stock
Remember, the goal isn’t to find perfect companies—those rarely exist. Instead, you’re looking for businesses with:
Consistent positive operating cash flow
Reasonable capital requirements
Sensible capital allocation decisions
Cash generation that supports or exceeds dividends and growth investments
The Bottom Line:
In simple terms, cash flow statements show you whether a business model actually works in practice, not just on paper. Companies that consistently generate more cash than they consume have the financial flexibility to weather storms, invest in opportunities, and reward shareholders, exactly the type of businesses that create long-term wealth.
Whether you’re building a dividend portfolio, evaluating growth stocks, or simply trying to understand financial markets better, cash flow analysis is an essential skill that will serve you throughout your investing journey.
The companies that master cash generation are the ones that survive recessions, fund innovation, and ultimately drive stock market growth over decades. By learning to read and interpret cash flow statements, you’re equipping yourself with one of the most powerful tools in fundamental analysis.
Start today, pick a company, download their latest annual report, and work through their cash flow statement section by section. The insights you gain will transform how you evaluate investment opportunities.
Interactive Cash Flow Statement Analyzer
💰 Cash Flow Statement Calculator
Enter your company’s financial data to analyze cash flow health
Disclaimer
This article is for educational purposes only and does not constitute financial advice. Cash flow analysis is one component of comprehensive investment research. Always conduct thorough due diligence, consider your personal financial situation, and consult with qualified financial advisors before making investment decisions. Past performance does not guarantee future results.
About the Author
Written by Max Fonji — with a decade of experience in financial education and investment analysis, Max is your go-to source for clear, data-backed investing education at TheRichGuyMath.com. His mission is to demystify complex financial concepts and empower readers to make informed investment decisions.


