

When a company faces an unexpected financial crisis, one question matters above all others: Can it pay its bills right now?
Not next month. Not after collecting customer payments. Not after selling inventory. Today.
This is where the Cash Ratio becomes the ultimate stress test of corporate liquidity. Unlike other financial metrics that paint optimistic pictures by including assets that might convert to cash eventually, the cash ratio strips away all assumptions and reveals the brutal truth: how much immediate firepower a company has to meet its obligations.
For investors evaluating potential stock purchases, creditors assessing loan applications, or business owners managing their own finances, understanding the cash ratio provides critical insight into financial stability and risk management. This metric represents the math behind money at its most conservative and most revealing.
Key Takeaways
- The cash ratio measures immediate liquidity by dividing cash and cash equivalents by current liabilities, showing a company’s ability to pay short-term debts instantly without selling other assets
- A ratio of 1.0 or higher indicates strong liquidity, meaning the company can cover all short-term obligations with cash on hand, while below 0.5 signals potential financial stress
- This is the most conservative liquidity metric, stricter than both the current ratio and quick ratio, because it excludes accounts receivable, inventory, and other less-liquid assets
- The formula is straightforward: (Cash + Cash Equivalents) ÷ Current Liabilities, with all data readily available on the balance sheet
- Context matters more than the number alone; industry standards, business models, and growth strategies all influence what constitutes an optimal cash ratio
What Is the Cash Ratio?
The cash ratio is a liquidity metric that measures a company’s capacity to pay off short-term liabilities using only its most liquid assets: cash and cash equivalents.
This financial ratio answers a simple but critical question: If every creditor demanded payment tomorrow, could the company settle all its short-term debts immediately?
Unlike broader liquidity measures, the cash ratio takes an extremely conservative approach. It ignores accounts receivable (money customers owe but haven’t paid yet), inventory (products that need to be sold), and prepaid expenses. The calculation focuses exclusively on resources that are already liquid or can be converted to cash within days, not weeks or months.
Why the Cash Ratio Matters
Financial analysts and investors use the cash ratio as a worst-case scenario assessment tool.
When economic conditions deteriorate rapidly, think market crashes, supply chain disruptions, or sudden credit freezes, companies with strong cash ratios survive while those with weak positions face bankruptcy. This metric reveals which businesses have built genuine financial resilience versus those operating on optimistic assumptions about future cash flows.
Creditors particularly value this ratio because it shows repayment capacity without requiring the company to sell assets, collect receivables, or generate new revenue. A bank evaluating a loan application will scrutinize the cash ratio to determine default risk.
For individual investors building wealth through evidence-based investing, the cash ratio provides data-driven insights into a company’s financial health. A consistently strong cash ratio suggests management practices sound capital allocation strategies and maintain adequate liquidity buffers; traits that often correlate with long-term stability and compound growth potential.
The Cash Ratio Formula Explained
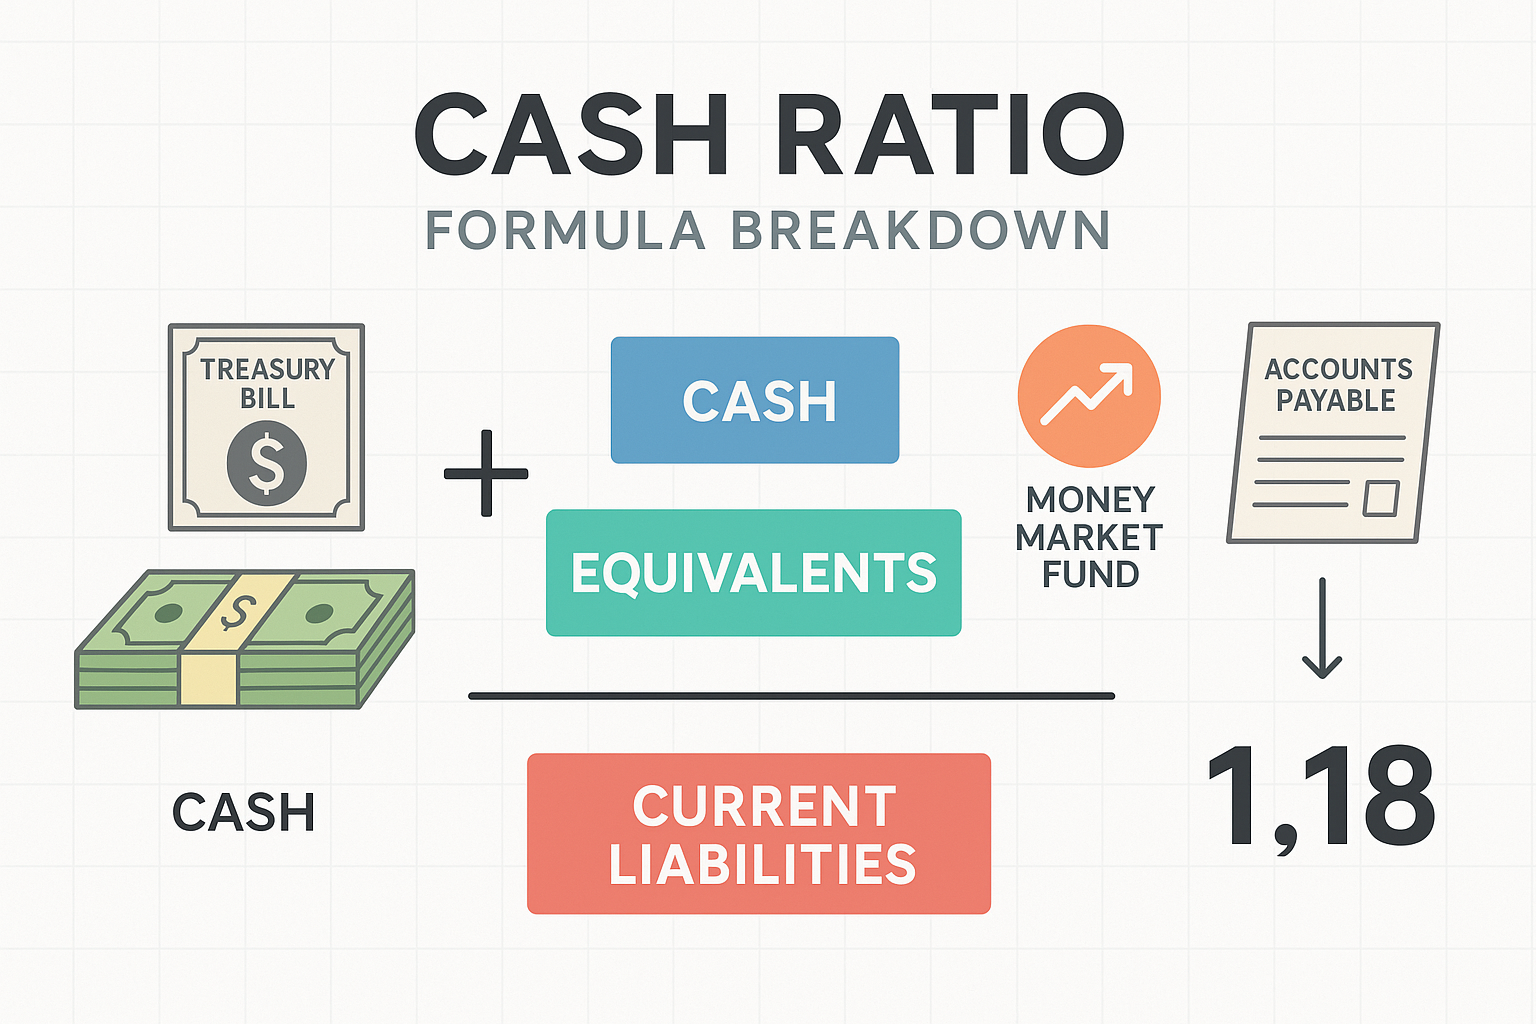
The cash ratio calculation is remarkably straightforward:
Cash Ratio = (Cash + Cash Equivalents) ÷ Current Liabilities
Each component of this formula carries a specific meaning and requires precise identification on a company’s balance sheet.
Cash Component
Cash includes all immediately available funds:
- Checking account balances held at financial institutions
- Savings account deposits that can be withdrawn without penalty
- Physical currency on hand at business locations
- Petty cash funds are maintained for minor expenses
These represent dollars that can be deployed instantly—no conversion process, no waiting period, no uncertainty about value.
Cash Equivalents Component
Cash equivalents are short-term, highly liquid investments that can be converted to known amounts of cash within 90 days or less, with negligible risk of value changes:
- Money market accounts and money market funds
- Treasury bills with maturities of three months or less
- Commercial paper (short-term corporate debt) with near-term maturity dates
- Certificates of deposit that mature within 90 days
The key characteristic: these instruments trade in active markets and maintain stable values. A stock portfolio, even a liquid one, doesn’t qualify because prices fluctuate significantly.
Current Liabilities Component
Current liabilities represent all obligations due within one year or the company’s operating cycle, whichever is longer:
- Accounts payable owed to suppliers and vendors
- Accrued expenses like wages, taxes, and interest payments
- Short-term debt, including the current portion of long-term loans
- Deferred revenue for which goods or services haven’t been delivered yet
- Other short-term obligation,s like dividends payable or customer deposits
Understanding the relationship between accounts receivable and accounts payable helps clarify why receivables don’t appear in the cash ratio numerator—they represent money owed to the company, not money the company currently possesses.
Finding the Numbers
Every publicly traded company reports these figures on its balance sheet, which is published quarterly in 10-Q filings and annually in 10-K reports. The balance sheet organizes assets and liabilities into clear categories, making the cash ratio components easy to locate.
Cash and cash equivalents typically appear as the first line item under current assets. Current liabilities occupy their own section, usually positioned between current assets and long-term liabilities.
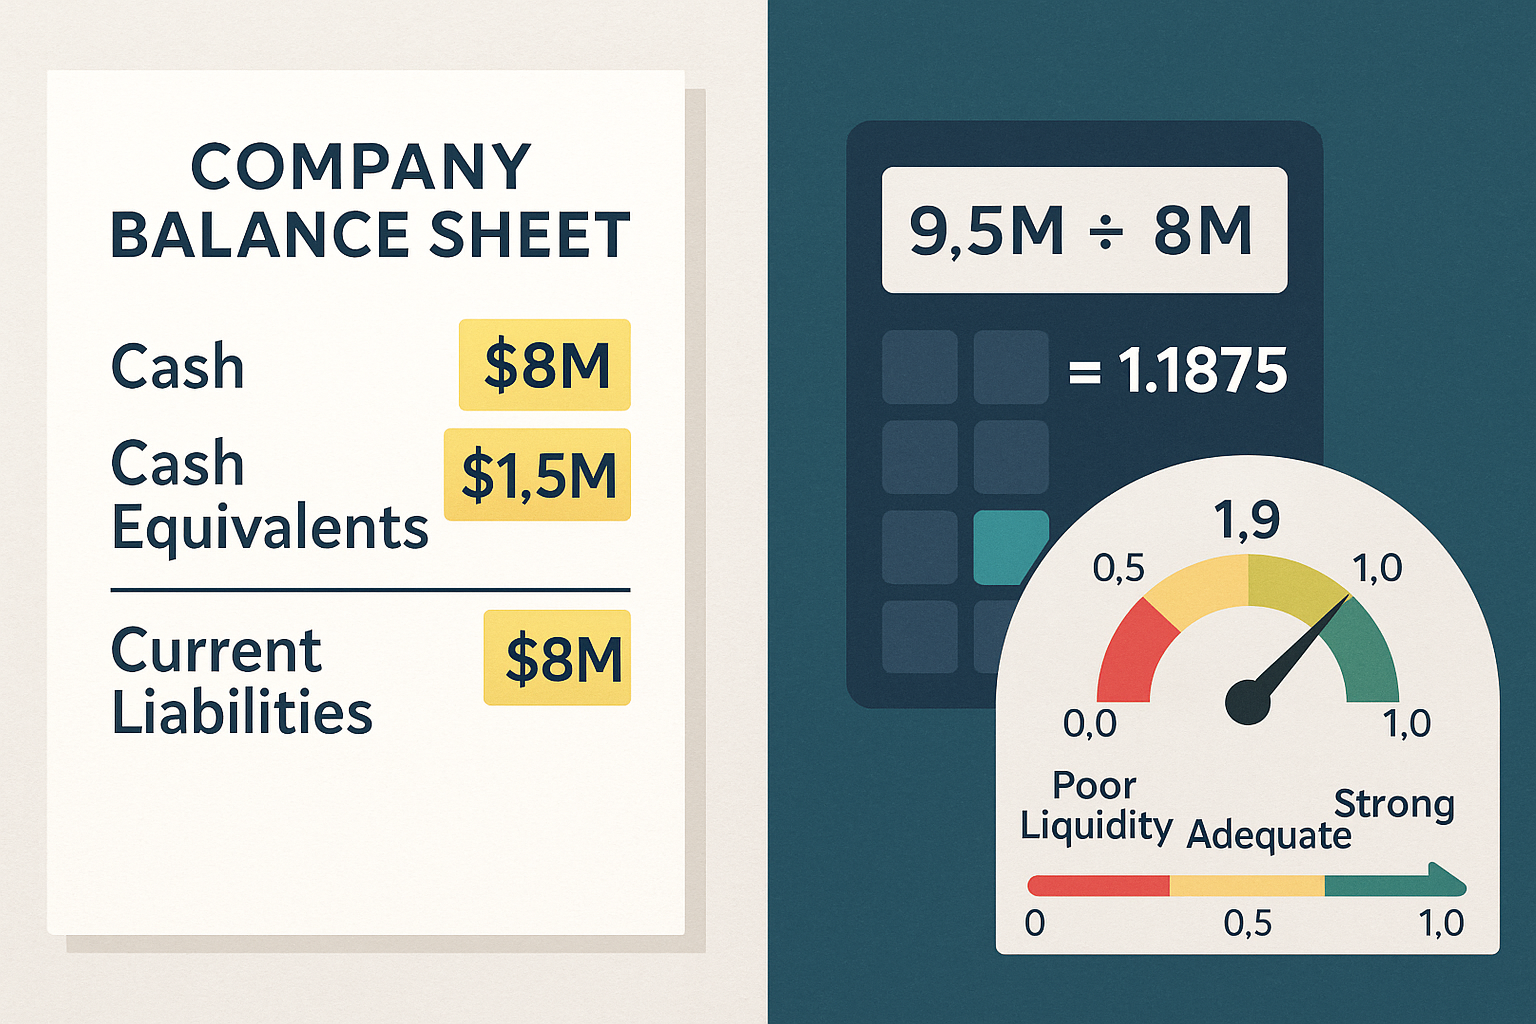
How to Calculate the Cash Ratio: Step-by-Step Example
Let’s walk through a practical calculation using a hypothetical company’s balance sheet data.
Example Company Balance Sheet Excerpt:
Current Assets:
- Cash: $8,000,000
- Cash Equivalents: $1,500,000
- Accounts Receivable: $4,200,000
- Inventory: $6,800,000
Current Liabilities:
- Accounts Payable: $3,500,000
- Accrued Expenses: $2,100,000
- Short-term Debt: $2,400,000
- Total Current Liabilities: $8,000,000
Step 1: Identify Cash and Cash Equivalents
Add together all cash and cash equivalent line items:
Cash + Cash Equivalents = $8,000,000 + $1,500,000 = $9,500,000
Notice we’re ignoring the $4,200,000 in accounts receivable and $6,800,000 in inventory. These assets have value, but they’re not immediately liquid.
Step 2: Identify Total Current Liabilities
Sum all obligations due within one year:
Total Current Liabilities = $3,500,000 + $2,100,000 + $2,400,000 = $8,000,000
Step 3: Apply the Formula
Cash Ratio = $9,500,000 ÷ $8,000,000 = 1.1875
Step 4: Interpret the Result
A cash ratio of 1.19 means the company holds $1.19 in cash and cash equivalents for every $1.00 of current liabilities.
This indicates strong liquidity. The company could theoretically pay off all short-term debts immediately and still have $1,500,000 in cash remaining ($9,500,000 – $8,000,000).
From a risk management perspective, this business has built a substantial liquidity buffer. Creditors would view this favorably because repayment capacity is clear and immediate. Investors might interpret this as financial stability, though they’d also want to ensure the company isn’t hoarding excessive cash that could be deployed more productively.
Interpreting Cash Ratio Results: What the Numbers Mean
Raw numbers require context. A cash ratio of 0.8 might signal danger for one company but represent prudent management for another.
The Benchmark Ranges
Cash Ratio ≥ 1.0: Strong Liquidity
Companies with ratios at or above 1.0 can pay all current liabilities immediately using only cash reserves. This represents maximum financial flexibility and minimal short-term risk.
Banks and creditors love these numbers. They indicate the company won’t default on short-term obligations even if revenue stops completely.
However, excessively high ratios (above 2.0 or 3.0) may suggest capital misallocation. Cash sitting in low-yield accounts generates minimal returns compared to productive investments in growth, research and development, or strategic acquisitions.
Cash Ratio 0.5 to 1.0: Adequate Liquidity
This range represents typical, healthy liquidity for many businesses. The company can’t cover all current liabilities with cash alone, but it maintains substantial liquid reserves.
Most companies operate in this zone because they balance liquidity needs with productive capital deployment. They maintain enough cash for operational stability while investing excess capital into growth initiatives that drive compound returns.
Cash Ratio < 0.5: Potential Liquidity Concerns
Ratios below 0.5 warrant closer examination. The company holds less than 50 cents in cash for every dollar of short-term obligations.
This doesn’t automatically indicate financial distress. Fast-growing companies often maintain lower cash ratios because they’re aggressively investing available capital into expansion. Retail businesses with predictable cash flows might operate comfortably with lower ratios because they generate cash daily through sales.
However, low ratios do create vulnerability. If revenue drops unexpectedly or credit markets tighten, the company may struggle to meet obligations without selling assets, securing additional financing, or cutting expenses dramatically.
Industry Context Matters
Different business models require different liquidity levels.
Capital-intensive industries like manufacturing or utilities typically maintain higher cash ratios because they face large, irregular capital expenditures and want buffers for unexpected equipment failures or regulatory requirements.
Retail and consumer businesses with daily cash generation can operate with lower ratios because they convert inventory to cash quickly and predictably.
Technology and software companies often hold substantial cash reserves—sometimes appearing to have “too much” cash—because they operate in rapidly changing markets where strategic acquisitions and R&D investments require immediate capital deployment.
Financial institutions follow entirely different liquidity frameworks regulated by banking authorities, making direct comparisons to non-financial companies inappropriate.
The Optimal Cash Ratio
There’s no universal “perfect” number.
The optimal cash ratio balances three competing priorities:
- Sufficient liquidity to weather unexpected disruptions without financial distress
- Creditor confidence that obligations will be met reliably
- Productive capital allocation that generates returns exceeding the cost of capital
Warren Buffett’s Berkshire Hathaway famously maintains enormous cash reserves (often $100+ billion), creating an extremely high cash ratio. Buffett views this as strategic optionality—the ability to make massive investments during market downturns when opportunities emerge and other companies face liquidity constraints.
Conversely, Amazon operated for years with relatively low cash ratios because Jeff Bezos reinvested virtually every available dollar into infrastructure, technology, and market expansion. The strategy worked because Amazon generated increasingly predictable cash flows that funded growth without requiring large liquidity buffers.
Both approaches succeeded, but they reflected fundamentally different business strategies and risk tolerances.
For most companies, a cash ratio between 0.5 and 1.5 represents prudent management—enough liquidity for stability, but not so much that capital sits idle earning minimal returns.
Cash Ratio vs Other Liquidity Ratios
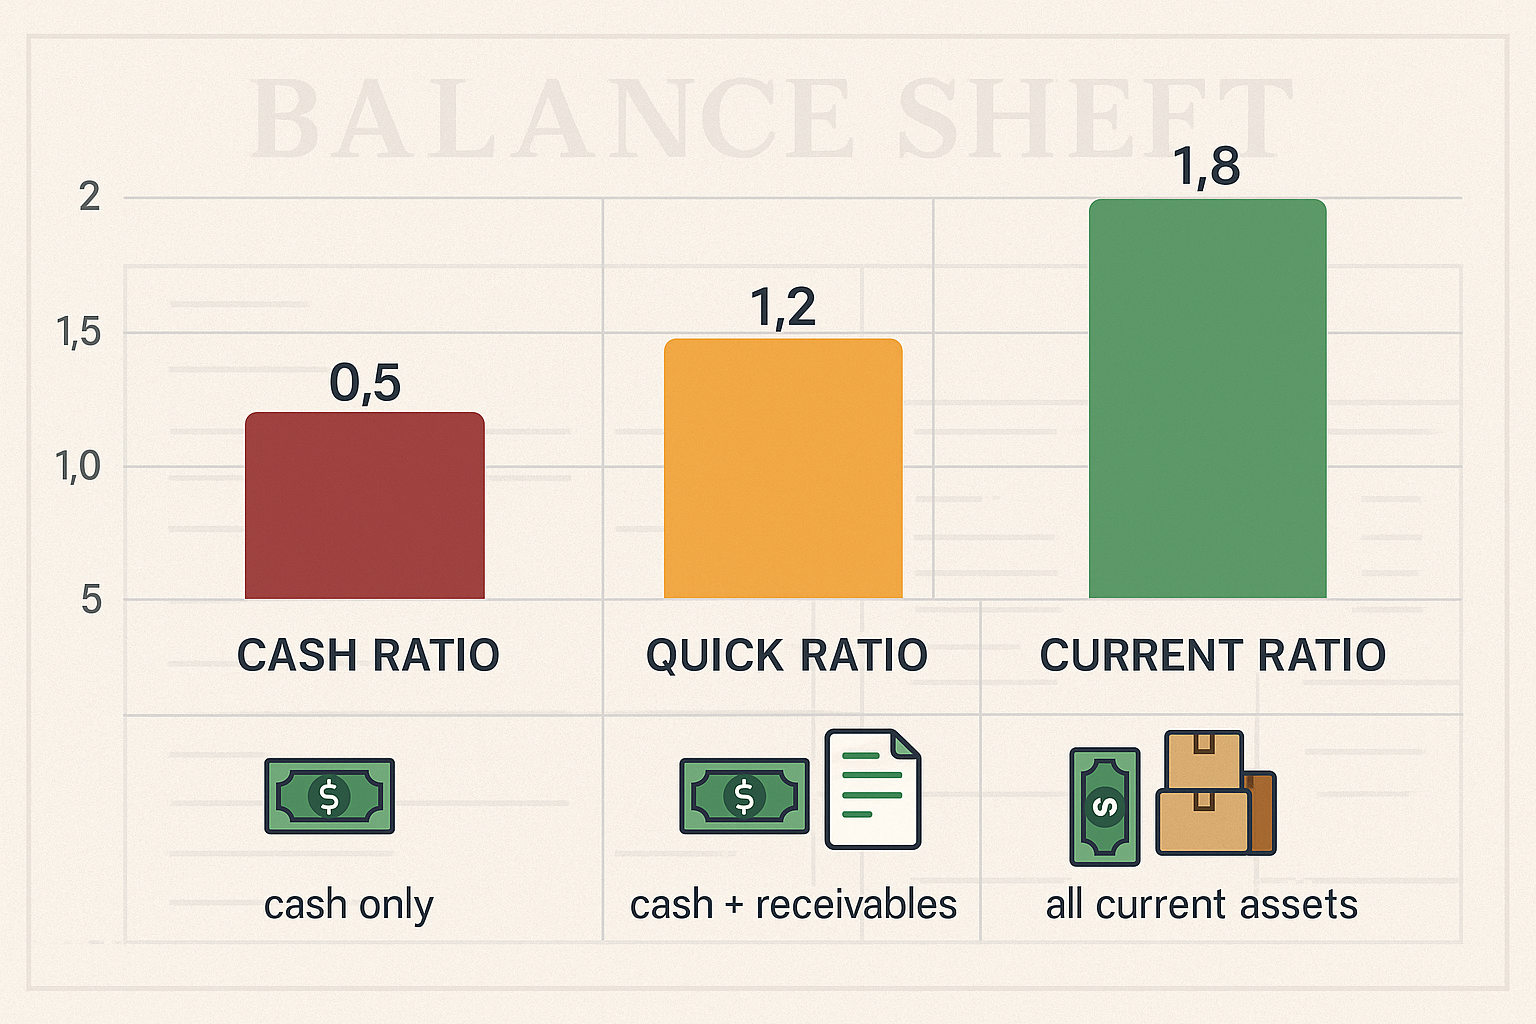
The cash ratio belongs to a family of liquidity metrics, each measuring financial flexibility with different levels of conservatism.
Understanding how these ratios relate reveals a more complete picture of financial health than any single metric alone.
Cash Ratio vs Current Ratio
The current ratio divides all current assets by current liabilities:
Current Ratio = Current Assets ÷ Current Liabilities
This broader measure includes cash, cash equivalents, accounts receivable, inventory, prepaid expenses, and other short-term assets.
Key Difference: The current ratio assumes the company can convert all current assets to cash within a year. This is often realistic but introduces uncertainty—will customers actually pay their receivables on time? Can inventory be sold at expected prices?
A company might show a healthy current ratio of 2.0 while maintaining a cash ratio of only 0.4. This gap reveals dependency on converting receivables and inventory to meet obligations, which works fine under normal conditions but creates vulnerability during economic stress.
For a detailed comparison, see current ratio vs. quick ratio.
Cash Ratio vs Quick Ratio
The quick ratio (also called the acid-test ratio) takes a middle position between the current ratio and cash ratio:
Quick Ratio = (Current Assets – Inventory – Prepaid Expenses) ÷ Current Liabilities
Or alternatively:
Quick Ratio = (Cash + Cash Equivalents + Accounts Receivable) ÷ Current Liabilities
Key Difference: The quick ratio includes accounts receivable but excludes inventory and prepaid expenses. It recognizes that collecting receivables is generally faster and more certain than selling inventory.
The quick ratio is less conservative than the cash ratio but more conservative than the current ratio. It provides a realistic middle-ground assessment for most businesses.
Comparison Table
| Metric | Formula | What It Includes | Conservatism Level | Best Use Case |
|---|---|---|---|---|
| Cash Ratio | (Cash + Cash Equivalents) ÷ Current Liabilities | Only immediately liquid assets | Most conservative | Worst-case scenario analysis, credit risk assessment |
| Quick Ratio | (Cash + Cash Equivalents + Receivables) ÷ Current Liabilities | Liquid assets plus near-term receivables | Moderately conservative | Realistic short-term liquidity assessment |
| Current Ratio | Current Assets ÷ Current Liabilities | All assets convertible within one year | Least conservative | General working capital adequacy |
Why Use Multiple Ratios?
Each ratio reveals different aspects of liquidity and financial management.
A company with a cash ratio of 0.6, quick ratio of 1.2, and current ratio of 2.0 tells a clear story: substantial assets exist, but much of the value is tied up in inventory. This pattern is typical for retailers and manufacturers.
Conversely, a software company might show a cash ratio of 1.5, a quick ratio of 1.6, and a current ratio of 1.7, a minimal difference between ratios because the company holds few receivables and no inventory. This pattern reflects asset-light business models common in technology sectors.
Analyzing ratios together provides context that individual metrics can’t deliver alone. This represents the data-driven insights approach that strengthens financial literacy and investment decision-making.
Practical Applications: Who Uses the Cash Ratio and Why
Different stakeholders analyze the cash ratio for distinct purposes, each seeking specific insights about financial stability and risk.
Creditors and Lenders
Banks and bondholders scrutinize cash ratios before extending credit.
A strong cash ratio reduces default risk because the borrower can service debt even if operations deteriorate temporarily. This often translates to better loan terms, lower interest rates, higher credit limits, and fewer restrictive covenants.
Conversely, weak cash ratios trigger red flags. Lenders may decline applications entirely, demand collateral, require personal guarantees, or impose higher interest rates to compensate for elevated risk.
The math behind money is straightforward here: lenders want assurance they’ll be repaid. Cash in hand provides that assurance more convincingly than promises about future revenue.
Equity Investors
Investors evaluate cash ratios to assess financial stability and management quality.
Conservative investors favor companies with strong cash ratios because they indicate lower bankruptcy risk and greater resilience during economic downturns. These businesses can continue operations, maintain dividends, and even pursue opportunistic investments when competitors face liquidity constraints.
Growth-oriented investors may actually prefer moderate or even low cash ratios in certain contexts. A company aggressively reinvesting cash into expansion, R&D, or acquisitions might show a lower ratio precisely because management is deploying capital productively rather than accumulating idle reserves.
The key is understanding why the ratio sits at its current level. Is low cash the result of poor planning and weak cash flow generation? Or does it reflect deliberate strategic choices to maximize growth and compound returns?
This analysis connects directly to capital allocation strategies; how management deploys available resources determines long-term value creation.
Business Owners and CFOs
Company leadership monitors cash ratios to guide financial planning and risk management.
Operational planning: Cash ratio trends inform decisions about capital expenditures, hiring, inventory purchases, and dividend policies. A declining ratio might prompt management to slow expansion, accelerate collections, or secure additional financing before liquidity becomes constrained.
Strategic positioning: Maintaining adequate cash ratios preserves financial flexibility. Companies with strong liquidity can negotiate better terms with suppliers (taking advantage of early payment discounts), weather unexpected disruptions without crisis-mode cost-cutting, and pursue strategic opportunities that require quick capital deployment.
Stakeholder confidence: Demonstrating strong liquidity reassures employees, suppliers, customers, and investors that the business operates from a position of financial strength rather than fragility.
Suppliers and Trade Partners
Vendors extending trade credit (allowing customers to pay 30, 60, or 90 days after delivery) assess customer cash ratios to evaluate payment risk.
A customer with a weak cash ratio may struggle to pay invoices on time, creating cash flow problems for suppliers. This might lead vendors to demand cash on delivery, require deposits, or reduce credit limits, all of which strain the customer’s working capital further.
Understanding the cash conversion cycle helps businesses optimize the timing of receivables, inventory, and payables to maintain healthy cash ratios without excessive capital tied up in operations.
Limitations of the Cash Ratio
Despite its usefulness, the cash ratio has significant limitations that require acknowledgment and context.
Overly Conservative Perspective
The cash ratio’s extreme conservatism can paint misleadingly pessimistic pictures.
Most businesses don’t need to pay all current liabilities simultaneously. Obligations come due on rolling schedules, some this week, others next month, still others in six months. Meanwhile, the company generates ongoing cash flow from operations.
A company with a cash ratio of 0.5 might appear vulnerable, but if it generates $2 million in operating cash flow monthly and faces only $500,000 in monthly obligation payments, actual liquidity risk is minimal.
The cash ratio provides a snapshot at a single moment, ignoring the dynamic nature of business operations where cash constantly flows in and out.
Ignores Cash Flow Generation
Two companies might show identical cash ratios of 0.7, but their actual financial health could differ dramatically.
Company A generates a strong, predictable operating cash flow of $5 million monthly. Its 0.7 cash ratio reflects deliberate capital deployment into growth initiatives, not financial weakness.
Company B generates minimal operating cash flow and relies on asset sales or new financing to meet obligations. Its 0.7 ratio represents genuine liquidity constraints.
The cash ratio alone can’t distinguish between these scenarios. Analyzing the cash flow statement alongside the balance sheet provides a more complete understanding.
Industry Variations Make Comparisons Difficult
Comparing cash ratios across different industries often produces misleading conclusions.
A grocery chain with daily cash sales might operate perfectly well with a cash ratio of 0.3, while a construction company with irregular project payments might need 1.2 to maintain equivalent safety margins.
Software companies typically show higher ratios than manufacturers. Banks follow entirely different regulatory frameworks. Utilities face unique capital requirements.
Meaningful comparisons require industry context and peer benchmarking against similar business models.
Doesn’t Capture Strategic Considerations
A high cash ratio might indicate prudent risk management, or it might signal missed opportunities.
Apple famously accumulated nearly $200 billion in cash and equivalents, creating an extraordinarily high cash ratio. Critics argued this represented capital misallocation, cash earning minimal returns instead of being returned to shareholders or invested in growth.
Apple’s management countered that massive cash reserves provided strategic flexibility for major acquisitions, protected against market disruptions, and allowed continued operations during economic crises without accessing credit markets.
Both perspectives have merit. The cash ratio itself doesn’t resolve the debate; it simply quantifies the current position.
Timing and Seasonality Issues
Balance sheet dates may not represent typical conditions.
Retail companies often show elevated cash ratios immediately after the holiday season when they’ve collected substantial revenue but haven’t yet paid down seasonal inventory financing. A ratio calculated on December 31 might look dramatically different from one calculated on June 30.
Agricultural businesses face pronounced seasonal patterns. Construction companies experience project-driven fluctuations.
Single-point measurements can mislead. Analyzing trends over multiple quarters or years provides more reliable insights than any individual calculation.
How to Improve a Low Cash Ratio
Companies facing weak cash ratios have several strategic options, each with distinct trade-offs.
Increase Cash Reserves
The most direct approach: accumulate more cash.
Methods:
- Accelerate receivables collection by offering early payment discounts, tightening credit terms, or improving invoicing and follow-up processes
- Reduce inventory levels by improving demand forecasting, negotiating just-in-time delivery arrangements, or liquidating slow-moving stock
- Delay capital expenditures by extending equipment lifecycles, leasing instead of purchasing, or prioritizing only essential investments
- Reduce dividend payments to retain more earnings (though this may disappoint shareholders)
- Sell non-core assets to convert underutilized property, equipment, or investments into cash
These tactics increase the numerator in the cash ratio formula, directly improving the metric.
Reduce Current Liabilities
Alternatively, decrease short-term obligations.
Methods:
- Negotiate extended payment terms with suppliers to convert short-term payables into longer-term arrangements
- Refinance short-term debt into long-term obligations, moving liabilities out of the “current” category
- Pay down existing short-term debt using available cash or operating cash flow
- Reduce accrued expenses through better expense management and timing
These approaches decrease the denominator, mathematically improving the ratio.
Improve Operating Cash Flow
The most sustainable long-term solution: strengthen the business fundamentals that generate cash.
Methods:
- Increase revenue through expanded sales, new products, or market penetration
- Improve profit margins by reducing costs, improving pricing, or enhancing operational efficiency
- Optimize working capital by balancing receivables, inventory, and payables more effectively
Strong operating cash flow makes the absolute cash ratio number less critical because the company continuously replenishes liquid reserves.
This connects to understanding accounting profit versus actual cash generation; profitability on paper doesn’t always translate to cash in the bank.
Strategic Considerations
Improving cash ratios requires balancing multiple objectives.
Aggressive receivables collection might damage customer relationships. Excessive inventory reduction risks stockouts and lost sales. Cutting capital expenditures might sacrifice long-term competitiveness for short-term liquidity metrics.
The optimal approach depends on the root cause of the weak ratio. Is it temporary (seasonal fluctuations, one-time expenses) or structural (consistently weak cash generation, excessive debt loads)?
Temporary issues might require patience and minor adjustments. Structural problems demand fundamental business model changes or strategic repositioning.
Cash Ratio in Investment Analysis
Sophisticated investors incorporate cash ratio analysis into broader investment frameworks.
Financial Health Screening
The cash ratio serves as an initial filter in stock screening processes.
Investors seeking stable, low-risk positions might screen for companies with cash ratios above 1.0, eliminating businesses with potential liquidity vulnerabilities. This approach aligns with defensive investment strategies focused on capital preservation.
Conversely, growth investors might screen for companies with ratios between 0.5 and 1.0, sufficient stability to avoid distress, but not so much idle cash that management appears overly conservative or lacking growth opportunities.
Trend Analysis
Single measurements provide limited insight. Tracking cash ratio trends over time reveals management priorities and business trajectory.
Improving trends (rising ratios over several quarters) might indicate:
- Strengthening cash flow generation from operations
- Deliberate balance sheet strengthening ahead of economic uncertainty
- Preparation for major strategic initiatives requiring capital
Declining trends might signal:
- Aggressive growth investments are consuming available cash
- Deteriorating operating performance
- Increasing short-term debt loads
Context determines whether trends represent positive or negative developments.
Peer Comparison
Comparing a company’s cash ratio to industry peers provides a relative perspective.
A company with a 0.6 ratio might appear weak in isolation, but if competitors average 0.4, the company actually demonstrates superior liquidity management.
Conversely, a 1.2 ratio seems strong until peer analysis reveals competitors average 2.0, suggesting the company may be underinvesting in growth or facing cash flow challenges competitors have avoided.
Integration with Other Metrics
The cash ratio works best alongside complementary financial metrics:
- Debt ratios reveal overall leverage and long-term financial risk
- Debt-to-equity ratio shows capital structure balance
- Operating cash flow indicates cash generation capacity
- Return on equity measures profitability relative to shareholder investment
- Earnings per share trends show a profit growth trajectory
Comprehensive analysis synthesizes multiple data points into coherent investment theses rather than relying on any single metric.
This multi-dimensional approach embodies the evidence-based investing philosophy that prioritizes data-driven insights over emotional reactions or market narratives.
Real-World Example: Analyzing Cash Ratios
Let’s examine how cash ratio analysis works with actual company data.
Company X (Technology Sector) – Q4 2024 Balance Sheet:
- Cash: $12,400,000
- Cash Equivalents: $3,600,000
- Total Cash and Equivalents: $16,000,000
- Current Liabilities: $10,000,000
- Cash Ratio: 1.60
Company Y (Retail Sector) – Q4 2024 Balance Sheet:
- Cash: $2,800,000
- Cash Equivalents: $700,000
- Total Cash and Equivalents: $3,500,000
- Current Liabilities: $8,500,000
- Cash Ratio: 0.41
Initial Interpretation
Company X shows strong liquidity with $1.60 in cash for every $1.00 of current liabilities. The company could pay all short-term obligations immediately and retain $6 million in cash reserves.
Company Y appears vulnerable, with only $0.41 in cash per dollar of current liabilities. The company would need to convert other assets or generate additional cash flow to meet all obligations.
Adding Context
Company X operates a software-as-a-service business with minimal inventory, predictable subscription revenue, and high profit margins. The strong cash ratio reflects:
- Asset-light business model requiring minimal working capital
- Consistent cash flow generation from recurring subscriptions
- Strategic cash reserves for potential acquisitions in a consolidating market
The high ratio makes sense given the business model and strategic positioning.
Company Y operates a fast-growing retail chain with daily cash sales, rapid inventory turnover, and aggressive expansion plans. The lower ratio reflects:
- Deliberate capital deployment into new store openings
- Inventory investments supporting expansion
- Confidence in daily cash generation to meet obligations
The company generates approximately $300,000 in daily cash sales, easily covering typical obligation payments. The low ratio reflects strategic choices, not financial distress.
Historical Trends
Examining three-year trends adds further insight:
Company X:
- 2022: Cash Ratio 1.20
- 2023: Cash Ratio 1.45
- 2024: Cash Ratio 1.60
The rising trend suggests strengthening cash generation and conservative financial management. Investors might question whether management should deploy more capital into growth initiatives or return excess cash to shareholders.
Company Y:
- 2022: Cash Ratio 0.65
- 2023: Cash Ratio 0.52
- 2024: Cash Ratio 0.41
Declining trend reflects aggressive expansion consuming available cash. This strategy works if expansion generates adequate returns, but creates vulnerability if growth slows or economic conditions deteriorate.
Investment Implications
Risk-averse investors might prefer Company X’s stability and strong liquidity position. The company can weather disruptions, maintain operations during downturns, and pursue opportunities from a position of financial strength.
Growth-oriented investors might favor Company Y’s aggressive expansion despite lower liquidity. If the retail expansion succeeds, early investors could capture substantial compound growth as new stores mature and generate cash flow.
Neither position is inherently “better”; they represent different risk-return profiles suited to different investment objectives.
Common Questions About Cash Ratio
What’s the difference between cash and cash equivalents?
Cash represents immediately available funds in checking accounts, savings accounts, and physical currency. Cash equivalents are short-term, highly liquid investments that mature within 90 days or less and carry negligible risk of value changes, like Treasury bills, money market funds, and commercial paper.
Both count equally in the cash ratio because they’re essentially interchangeable for meeting short-term obligations.
Can a cash ratio be too high?
Yes. While high ratios indicate strong liquidity, excessively high ratios (above 2.0 or 3.0) may suggest poor capital allocation.
Cash sitting in low-yield accounts generates minimal returns. Companies with excessive cash might better serve shareholders by investing in growth, returning capital through dividends or buybacks, or pursuing strategic acquisitions.
The optimal ratio balances liquidity needs with productive capital deployment that drives compound growth.
How often should companies calculate their cash ratio?
Publicly traded companies report balance sheets quarterly, allowing cash ratio calculation every three months. Many companies monitor this metric monthly or even weekly for internal management purposes.
For investors, quarterly analysis with attention to year-over-year trends provides sufficient insight without excessive focus on short-term fluctuations.
Is the cash ratio more important than the current ratio?
Neither is universally “more important”—they serve different purposes.
The cash ratio provides worst-case scenario analysis, showing immediate liquidity without assuming any asset conversions. It’s most valuable for assessing extreme financial stress scenarios.
The current ratio offers a more realistic assessment of normal operating conditions, recognizing that companies routinely convert receivables and inventory to cash.
Use both metrics together for comprehensive liquidity analysis.
Do all industries use the same cash ratio benchmarks?
No. Industry characteristics significantly influence appropriate cash ratio levels.
Capital-intensive industries, businesses with irregular cash flows, and companies in volatile markets typically maintain higher ratios. Retail, consumer goods, and businesses with predictable daily cash generation often operate with lower ratios.
Always compare companies against industry peers rather than using universal benchmarks.
💰 Cash Ratio Calculator
Calculate your company’s immediate liquidity position
Conclusion: Using the Cash Ratio for Better Financial Decisions
The cash ratio stands as the ultimate liquidity stress test, a conservative, unforgiving measure that reveals whether a company can survive immediate financial pressure.
Unlike metrics that rely on assumptions about converting receivables or selling inventory, the cash ratio deals only in certainties: actual cash and near-cash assets versus obligations due soon. This makes it invaluable for assessing worst-case scenarios and true financial resilience.
For investors building wealth through evidence-based strategies, the cash ratio provides critical data points for risk assessment. Companies with consistently strong ratios demonstrate financial discipline and maintain buffers against unexpected disruptions. Those with weak ratios may offer growth potential but carry elevated risk that requires careful evaluation.
For business owners and financial managers, monitoring cash ratio trends informs strategic decisions about capital allocation, debt management, and liquidity planning. The goal isn’t necessarily maximizing this metric; excessively high ratios can signal missed opportunities, but rather maintaining appropriate levels given industry norms, business models, and strategic objectives.
The math behind money reveals truth through numbers. A company can claim financial strength, project optimistic forecasts, or present compelling narratives. But the cash ratio cuts through rhetoric and shows, with mathematical precision, whether liquid resources exist to meet commitments.
Next Steps
For Investors:
- Calculate cash ratios for companies in your portfolio or watchlist
- Compare ratios against industry peers and historical trends
- Integrate cash ratio analysis with other liquidity metrics like the current ratio and quick ratio
- Examine cash flow statements to understand cash generation patterns
- Consider how cash positions affect capital allocation strategies
For Business Owners:
- Review your most recent balance sheet and calculate your current cash ratio
- Establish target ranges appropriate for your industry and business model
- Monitor trends quarterly to identify improving or deteriorating positions
- Develop action plans for strengthening weak ratios through receivables acceleration, inventory optimization, or debt restructuring
- Balance liquidity needs with productive capital deployment that drives compound growth
For Financial Learners:
- Practice calculating cash ratios using public company financial statements
- Study how different industries maintain different ratio levels
- Understand the relationship between assets and liabilities on the balance sheet
- Explore how the cash conversion cycle affects liquidity
- Build comprehensive financial literacy through understanding multiple analytical frameworks
The cash ratio is one tool among many in the financial analysis toolkit. Used thoughtfully alongside complementary metrics and qualitative assessments, it strengthens decision-making and reduces risk in both investing and business management.
Financial success ultimately derives from understanding the numbers, recognizing what they reveal, and acting on data-driven insights rather than emotions or assumptions. The cash ratio exemplifies this principle, a simple calculation that illuminates fundamental truths about financial strength and vulnerability.
Sources
[1] Financial Accounting Standards Board (FASB). “Statement of Financial Accounting Standards No. 95: Statement of Cash Flows.” FASB.org.
[2] Securities and Exchange Commission. “Beginners’ Guide to Financial Statements.” SEC.gov, Investor.gov.
[3] CFA Institute. “Corporate Finance and Portfolio Management.” CFA Program Curriculum, 2025.
[4] Palepu, Krishna G., and Paul M. Healy. “Business Analysis and Valuation: Using Financial Statements.” Cengage Learning, 5th Edition.
[5] Investopedia. “Cash Ratio: Formula, Calculation, and Example.” Investopedia.com.
[6] Federal Reserve Bank. “Financial Ratios and Industry Benchmarks.” Federal Reserve Economic Data (FRED).
About the Author
Max Fonji is a data-driven financial educator and the voice behind The Rich Guy Math. With expertise in financial analysis, valuation principles, and evidence-based investing, Max translates complex financial concepts into clear, actionable insights. His analytical approach combines rigorous mathematical frameworks with practical application, helping readers understand the cause-and-effect relationships that drive wealth building and financial success.
Educational Disclaimer
This article provides educational information about financial ratios and liquidity analysis. It does not constitute financial, investment, or business advice. Financial ratios represent analytical tools that require contextual interpretation based on industry, business model, and economic conditions. Readers should conduct thorough due diligence and consult qualified financial professionals before making investment or business decisions. Past financial performance does not guarantee future results. The Rich Guy Math assumes no liability for decisions made based on information presented in this article.
Frequently Asked Questions
What is a good cash ratio?
A good cash ratio typically falls between 0.5 and 1.5, though optimal levels vary by industry. Ratios above 1.0 indicate the company can cover all current liabilities with cash alone, demonstrating strong liquidity. Ratios between 0.5 and 1.0 represent adequate liquidity for most businesses. Below 0.5 suggests potential liquidity concerns that warrant closer examination.
How is the cash ratio different from the quick ratio?
The cash ratio is more conservative than the quick ratio. The cash ratio includes only cash and cash equivalents, while the quick ratio also includes accounts receivable. This makes the cash ratio stricter because it assumes no receivables will be collected—only immediately available liquid assets count.
Where do I find the numbers to calculate cash ratio?
All required data appears on a company’s balance sheet. Cash and cash equivalents are listed under current assets (typically the first line items). Current liabilities have their own section. Public companies publish balance sheets in quarterly 10-Q and annual 10-K filings available through the SEC’s EDGAR database or company investor relations websites.
Can a company have too much cash?
Yes. While strong cash positions provide stability, excessively high cash ratios (above 2.0 or 3.0) may indicate poor capital allocation. Cash earning minimal returns in bank accounts generates less value than productive investments in growth, research, or strategic acquisitions. The optimal balance maintains adequate liquidity while deploying excess capital productively.
What causes a cash ratio to decline?
Cash ratios decline when current liabilities grow faster than cash reserves or when cash decreases faster than liabilities. Common causes include aggressive growth investments consuming cash, increasing short-term debt, declining operating cash flow, or deliberate strategic choices to deploy cash into expansion rather than maintain high liquidity buffers.
Is the cash ratio important for all companies?
The cash ratio’s importance varies by context. It’s particularly critical for companies in volatile industries, those with irregular cash flows, or businesses facing economic uncertainty. It’s less critical (though still useful) for companies with highly predictable cash generation, such as subscription-based businesses or retailers with daily cash sales. All companies should monitor it, but the emphasis depends on business characteristics.