Picture this: A business owner sits across from a banker, hoping to secure a loan. The banker asks one simple question that determines everything: “Can you pay your bills next month?” The answer lies in a single number, the Current Ratio.
This fundamental liquidity metric reveals whether a company can meet its short-term obligations without scrambling for cash. For investors, creditors, and business owners alike, the Current Ratio serves as a financial health thermometer, measuring the temperature of a company’s immediate financial stability. Understanding this ratio transforms abstract balance sheet numbers into actionable insights about financial health and risk management.
In this comprehensive guide, we’ll break down the math behind the Current Ratio, show you exactly how to calculate and interpret it, and reveal what different ratio levels actually mean for a company’s financial future.
Key Takeaways
- The Current Ratio measures liquidity by dividing current assets by current liabilities, revealing a company’s ability to pay short-term obligations due within one year
- A ratio above 1.0 indicates financial stability, while below 1.0 signals potential liquidity problems requiring immediate attention
- The ideal range typically falls between 1.5 and 2.0, balancing sufficient liquidity with efficient capital deployment
- Industry context matters significantly—retail companies naturally maintain different ratios than technology firms due to varying business models
- Extreme ratios signal problems—too low indicates distress, too high suggests inefficient use of capital that could fuel growth
What Is the Current Ratio?
The Current Ratio represents a fundamental liquidity metric that answers one critical question: Does a company have enough resources to pay its bills over the next 12 months?
Definition: The Current Ratio measures the relationship between a company’s current assets and current liabilities, expressed as a simple numerical ratio.
This metric belongs to the family of liquidity ratios, financial measurements that assess a company’s ability to convert assets into cash quickly. Also known as the Working Capital Ratio, it provides a snapshot of short-term financial health without requiring complex analysis or multiple data points.
Why the Current Ratio Matters
Liquidity determines survival. A company might show impressive revenue growth and strong profit margins, yet still face bankruptcy if it cannot pay suppliers, employees, and creditors when bills come due.
The Current Ratio serves three critical functions:
For investors: It reveals whether a company can weather economic downturns or unexpected disruptions without requiring emergency financing that dilutes shareholder value.
For creditors: Banks and suppliers use this ratio to assess lending risk. A strong Current Ratio increases borrowing capacity and negotiating power for better terms.
For management: Leadership teams monitor this metric to maintain operational flexibility and avoid the cash crunches that force desperate decisions, selling assets at fire-sale prices or accepting unfavorable financing terms.
The beauty of the Current Ratio lies in its simplicity. Unlike complex valuation models or discounted cash flow analysis, anyone can calculate and interpret this ratio using basic balance sheet data available in quarterly financial reports.
Current Assets Explained
Current assets represent resources a company expects to convert to cash within one year or one operating cycle, whichever is longer.
Common current assets include:
- Cash and cash equivalents – The most liquid assets, immediately available for obligations
- Marketable securities – Short-term investments that can be sold quickly
- Accounts receivable – Money owed by customers for goods or services already delivered
- Inventory – Products held for sale or raw materials for production
- Prepaid expenses – Advance payments for services to be received within 12 months
Each category carries different liquidity characteristics. Cash converts instantly, while inventory might take months to sell and convert to cash. Accounts receivable typically convert within 30-90 days, depending on payment terms.
Current Liabilities Explained
Current liabilities represent obligations a company must satisfy within one year.
Common current liabilities include:
- Accounts payable – Money owed to suppliers for goods or services received
- Short-term debt – Loans and credit lines due within 12 months
- Accrued expenses – Costs incurred but not yet paid (wages, utilities, taxes)
- Unearned revenue – Customer prepayments for goods or services not yet delivered
- Current portion of long-term debt – The slice of multi-year loans due this year
Understanding accounts payable and how it differs from receivables helps clarify the timing dynamics that make the Current Ratio meaningful. Companies must manage the gap between when they pay suppliers and when customers pay them.
The Current Ratio Formula

The Current Ratio calculation requires only two numbers from a company’s balance sheet:
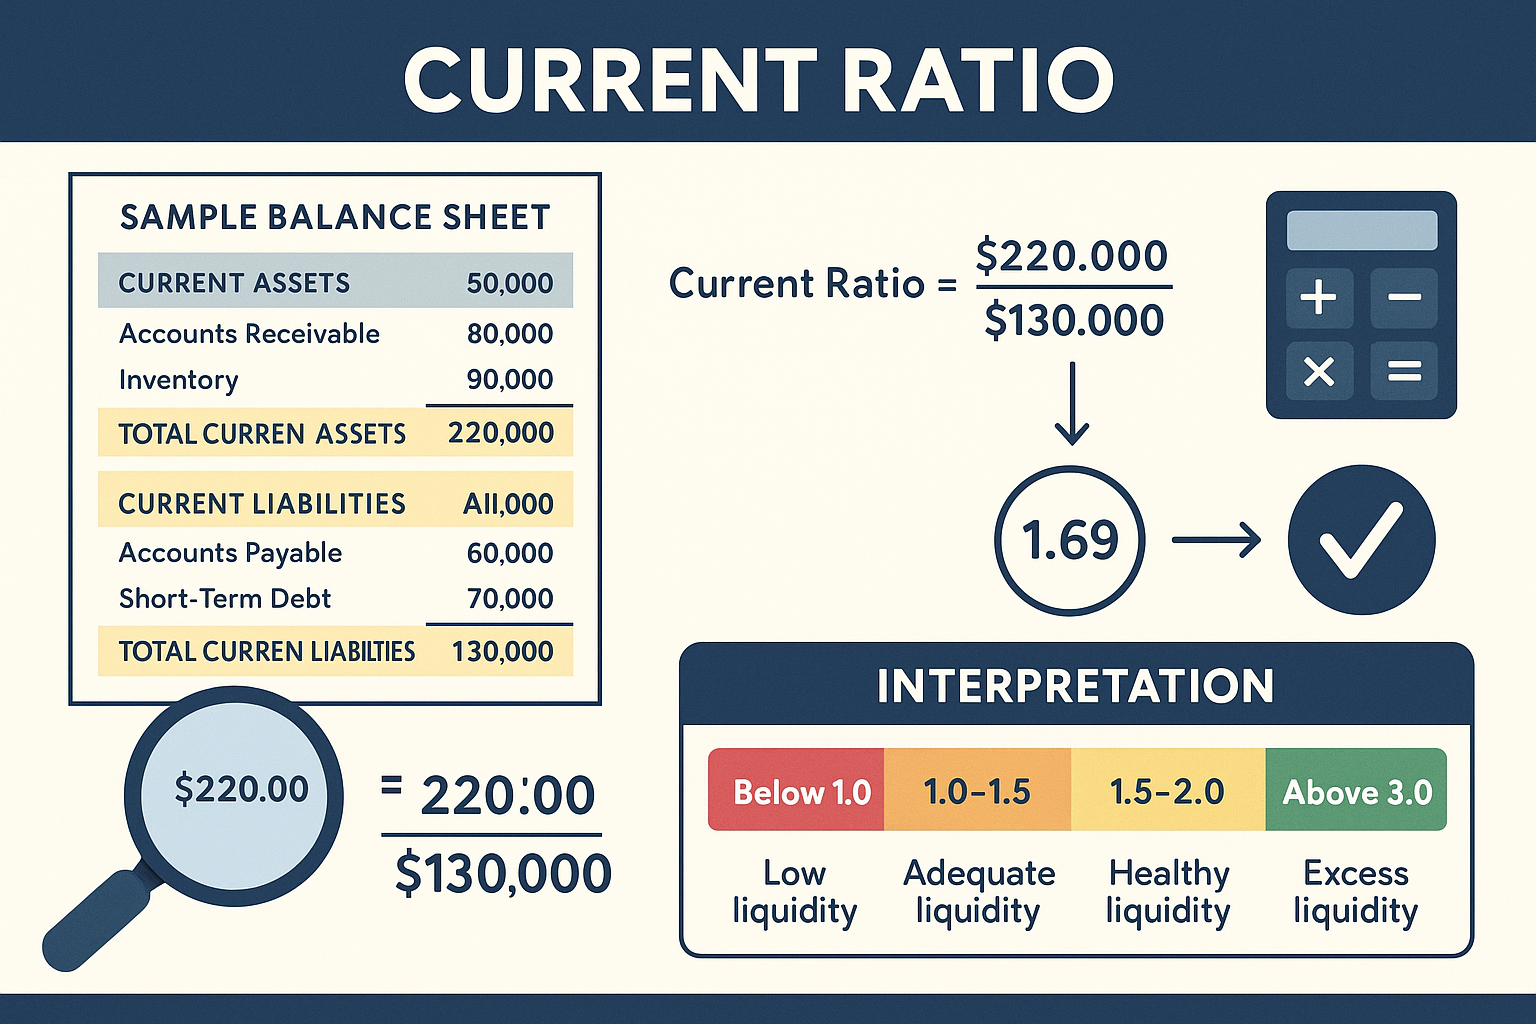
Current Ratio = Current Assets ÷ Current Liabilities
This straightforward division produces a ratio that immediately reveals liquidity position.
Step-by-Step Calculation Process
Step 1: Locate the balance sheet
Find the most recent quarterly or annual financial statement. Public companies file these with the SEC and publish them on investor relations websites.
Step 2: Identify current assets
Look for the “Current Assets” section, typically the first category on the asset side of the balance sheet. Sum all line items if they’re listed separately, or use the total current assets figure provided.
Step 3: Identify current liabilities
Find the “Current Liabilities” section under the liabilities portion of the balance sheet. Again, use the total current liabilities figure.
Step 4: Perform the division
Divide current assets by current liabilities. The result is your Current Ratio, expressed as a decimal or ratio (e.g., 1.8 or 1.8:1).
Real-World Example
Let’s analyze a hypothetical company’s balance sheet:
Company XYZ Balance Sheet (as of December 31, 2025)
Current Assets:
- Cash: $500,000
- Accounts Receivable: $300,000
- Inventory: $400,000
- Prepaid Expenses: $50,000
- Total Current Assets: $1,250,000
Current Liabilities:
- Accounts Payable: $250,000
- Short-term Debt: $150,000
- Accrued Expenses: $100,000
- Total Current Liabilities: $500,000
Calculation:
Current Ratio = $1,250,000 ÷ $500,000 = 2.5
This result means Company XYZ has $2.50 in current assets for every $1.00 of current liabilities. The company could theoretically pay off all short-term obligations and still have $750,000 in liquid assets remaining.
Formula Variations and Related Metrics
While the Current Ratio provides valuable insight, analysts often examine complementary liquidity metrics:
Quick Ratio (Acid-Test Ratio):
(Current Assets – Inventory) ÷ Current Liabilities
This more conservative measure removes inventory, which may take months to convert to cash. It reveals whether a company can meet obligations using only its most liquid assets.
Cash Ratio:
(Cash + Marketable Securities) ÷ Current Liabilities
The most stringent liquidity test shows whether a company could pay all current liabilities immediately using only cash on hand.
These variations address the Current Ratio’s limitation, treating all current assets as equally liquid when they clearly aren’t. Understanding assets versus liabilities more broadly helps contextualize these measurements.
How to Interpret the Current Ratio
Numbers mean nothing without context. A Current Ratio of 1.5 might signal strength in one industry and weakness in another. Interpretation requires understanding what different ratio levels reveal about financial health.
Current Ratio Above 1.0: Financial Stability
Meaning: The company has more current assets than current liabilities.
A ratio above 1.0 indicates the business can cover all short-term obligations using resources that will convert to cash within the year. This provides a cushion against unexpected disruptions, delayed customer payments, supply chain issues, or economic downturns.
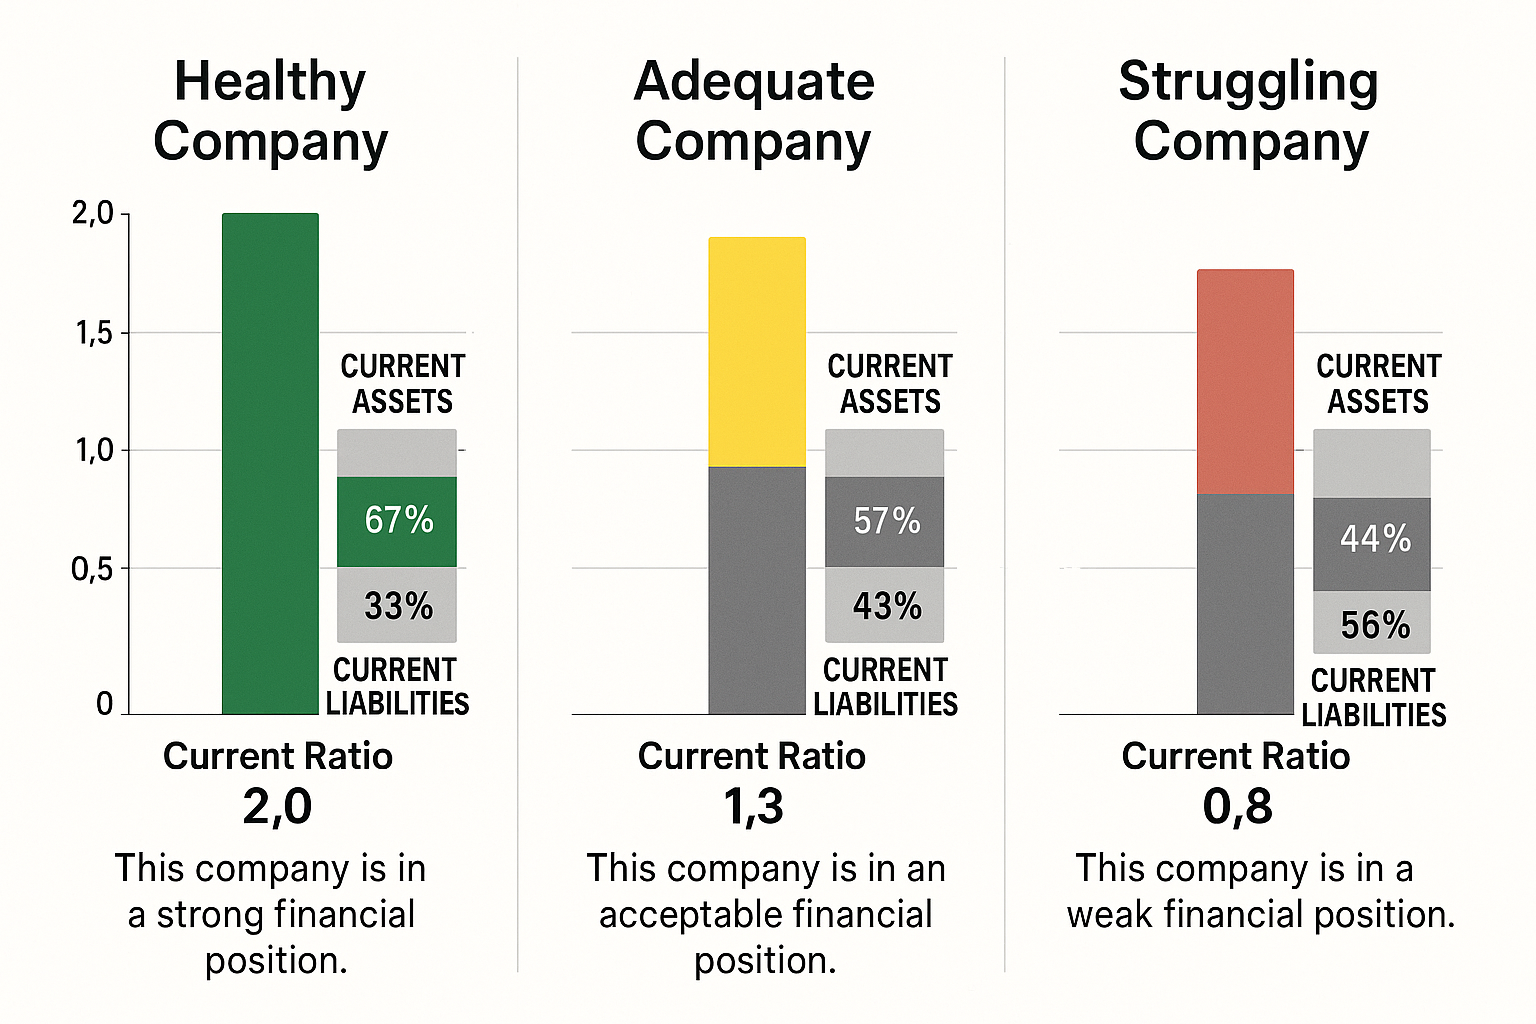
Example: A Current Ratio of 1.3 means the company has $1.30 in current assets for every $1.00 of current liabilities. After paying all bills, $0.30 per dollar remains as a safety buffer.
Current Ratio Below 1.0: Liquidity Concerns
Meaning: The company has more current liabilities than current assets.
This situation raises red flags. The business may struggle to meet obligations without securing additional financing, selling long-term assets, or generating rapid revenue growth. Creditors become nervous, suppliers may tighten payment terms, and the company loses negotiating leverage.
Example: A Current Ratio of 0.8 means the company has only $0.80 in current assets for every $1.00 owed. There’s a $0.20 gap that must be filled through borrowing, asset sales, or improved operations.
The Ideal Range: 1.5 to 2.0
Most financial analysts consider a Current Ratio between 1.5 and 2.0 optimal for healthy operations.
Why this range?
Lower bound (1.5): Provides sufficient cushion to handle normal business fluctuations without excessive idle cash. The company can weather minor disruptions while maintaining operational flexibility.
Upper bound (2.0): Avoids holding excessive current assets that could be deployed more productively. Cash sitting idle earns minimal returns compared to investments in growth, equipment, or dividend payments.
A ratio of 2.0 means the company could pay all current liabilities and still retain half its current assets. This demonstrates strong financial health without suggesting capital inefficiency.
When High Ratios Signal Problems
Counterintuitively, extremely high Current Ratios (above 3.0) may indicate problems:
Excess cash accumulation: The company may be hoarding cash rather than investing in growth opportunities that could generate higher returns.
Poor inventory management: Bloated inventory levels inflate current assets but represent capital tied up in unsold products.
Weak growth initiatives: Management might lack confidence in expansion opportunities, choosing liquidity over strategic investments.
Inefficient capital deployment: Shareholders might prefer the company return excess cash through dividends or buybacks rather than letting it sit idle.
Industry Context Changes Everything
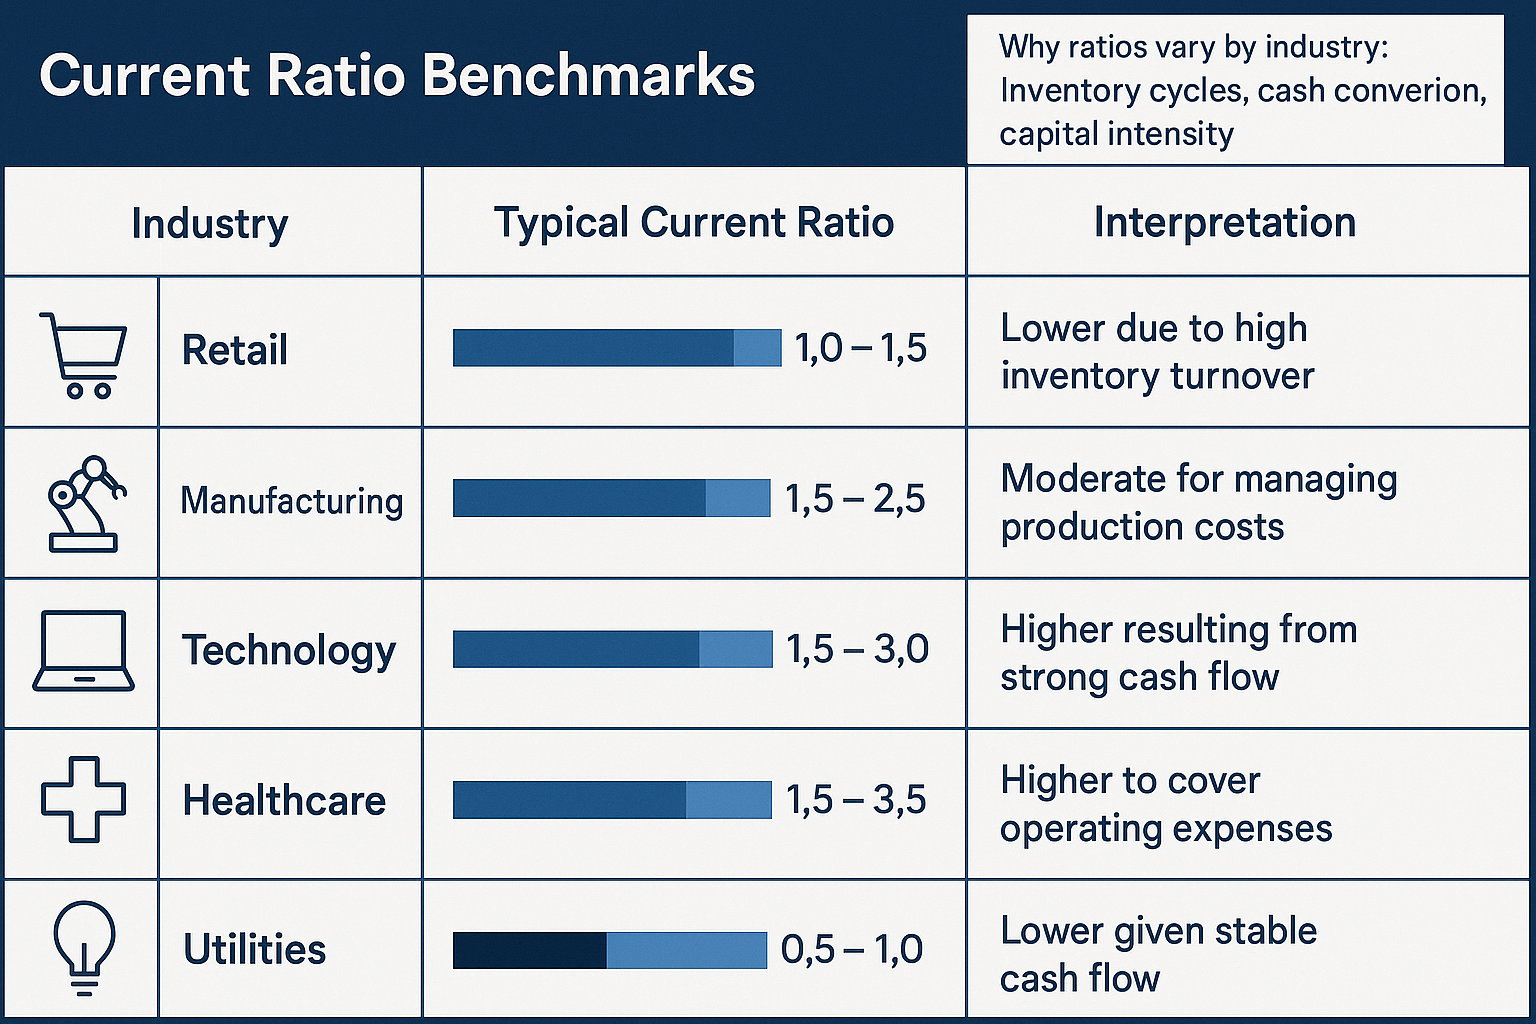
The “ideal” Current Ratio varies significantly across industries due to different business models and cash conversion cycles.
Retail companies (1.0-1.5): Fast inventory turnover and immediate cash sales allow lower ratios. Retailers convert inventory to cash quickly, reducing the need for large liquidity buffers.
Manufacturing companies (1.5-2.5): Longer production cycles and extended payment terms require higher ratios. Manufacturers must finance raw materials, work-in-progress, and finished goods before receiving customer payments.
Technology companies (2.0-3.0): Minimal inventory and subscription revenue models often produce higher ratios. Tech firms accumulate cash from recurring revenue without corresponding inventory investments.
Utilities (0.8-1.2): Stable, predictable cash flows allow operation with lower ratios. Regulated revenue streams reduce liquidity risk despite ratios below 1.0.
Comparing a retailer’s ratio to a manufacturer’s ratio produces meaningless conclusions. Always benchmark against industry peers and historical company performance.
Trend Analysis Matters More Than Single Numbers
A single Current Ratio snapshot provides limited insight. Tracking the ratio over multiple quarters reveals crucial trends:
Improving trend (0.9 → 1.2 → 1.5): Suggests strengthening financial position, better cash management, or successful growth initiatives.
Declining trend (2.5 → 2.0 → 1.5): May indicate growing obligations, slowing collections, or strategic investments that temporarily reduce liquidity.
Volatile fluctuations: Could signal seasonal business patterns, inconsistent management, or industry disruption.
Analyzing trends alongside cash flow statements provides a deeper understanding of the underlying drivers affecting liquidity.
Analyzing Current Ratio: Practical Applications
Understanding how to calculate the Current Ratio represents only the first step. Applying this knowledge to real investment decisions, business management, and financial analysis creates actual value.
For Investors: Screening and Risk Assessment
Investors use the Current Ratio to filter investment opportunities and assess downside risk.
Screening process:
- Eliminate companies with Current Ratios below 1.0 unless there’s a compelling industry-specific reason
- Flag companies with declining ratio trends for deeper investigation
- Compare ratios against industry averages to identify outliers
- Examine ratio stability across economic cycles
Risk assessment framework:
Low risk: Current Ratio between 1.5-2.5, stable or improving trend, in line with industry norms
Moderate risk: Current Ratio between 1.0-1.5 or 2.5-3.5, some volatility, slight deviation from industry
High risk: Current Ratio below 1.0 or above 4.0, declining trend, significant industry deviation
Combining Current Ratio analysis with other financial metrics like debt-to-equity ratio and EBITDA margins creates a comprehensive risk profile.
For Business Owners: Managing Liquidity
Entrepreneurs and managers monitor the Current Ratio to maintain operational health and avoid cash crises.
Improvement strategies when the ratio is too low:
Accelerate collections: Tighten credit terms, offer early payment discounts, and improve invoicing processes to convert accounts receivable faster
Reduce inventory: Implement just-in-time systems, clear slow-moving products, and improve demand forecasting to free trapped capital
Extend payables: Negotiate longer payment terms with suppliers without damaging relationships or credit standing
Secure financing: Establish credit lines before emergencies arise, providing flexibility when needed
Increase profitability: Higher margins generate cash that naturally improves the ratio over time
Optimization strategies when the ratio is too high:
Invest in growth: Deploy excess cash into equipment, marketing, or expansion that generates returns exceeding the cost of capital
Return capital to shareholders: Consider dividends or buybacks if no compelling internal investment opportunities exist
Pay down expensive debt: Reduce interest expenses by eliminating high-cost obligations
Strategic acquisitions: Use liquidity to acquire competitors or complementary businesses
The cash conversion cycle provides additional insight into how quickly a company transforms investments into cash, complementing Current Ratio analysis.
For Creditors: Lending Decisions
Banks and suppliers evaluate the Current Ratio before extending credit or setting payment terms.
Lending criteria:
Current Ratio > 1.5: Favorable terms, higher credit limits, lower interest rates
Current Ratio 1.0-1.5: Standard terms, moderate limits, market-rate pricing
Current Ratio < 1.0: Restrictive terms, lower limits, higher rates, or credit denial
Creditors often combine the Current Ratio analysis with other metrics like the Altman Z-score to predict bankruptcy risk more accurately.
Limitations and What the Current Ratio Doesn’t Tell You
Despite its usefulness, the Current Ratio has significant limitations:
Timing issues: Balance sheet snapshots may not reflect normal operations. Companies can manipulate ratios by timing asset sales or debt payments around reporting dates.
Asset quality assumptions: The ratio treats all current assets equally, but a dollar of cash differs fundamentally from a dollar of aging inventory that might sell at a discount.
Industry blind spots: Standard ratio ranges don’t account for unique business models or competitive advantages that allow successful operation outside normal parameters.
Static measurement: The ratio shows current position but reveals nothing about future cash generation capabilities or management quality.
Seasonal variations: Businesses with seasonal patterns show dramatic ratio fluctuations that don’t reflect underlying health changes.
No profitability insight: A company can maintain a healthy Current Ratio while losing money, slowly depleting assets until liquidity collapses.
These limitations explain why professional analysts never rely on a single metric. Comprehensive financial analysis examines multiple ratios, trends, and qualitative factors before reaching conclusions.
Comparing Current Ratio with Other Financial Metrics
The Current Ratio works best when analyzed alongside complementary metrics:
| Metric | What It Measures | Relationship to Current Ratio |
|---|---|---|
| Quick Ratio | Liquidity excluding inventory | More conservative; typically 30-50% lower |
| Cash Ratio | Immediate liquidity | Most conservative; shows worst-case coverage |
| Working Capital | Absolute liquidity buffer | Dollar amount vs ratio; both derived from the same components |
| Debt Ratio | Total leverage | High debt often correlates with lower Current Ratios |
| Operating Cash Flow | Cash generation ability | Strong cash flow can support lower Current Ratios |
Understanding these relationships prevents misinterpretation. A company with strong operating cash flow might safely operate with a Current Ratio of 1.2, while a company with weak cash generation needs 2.0+ for safety.
Real-World Case Study: Retail vs. Technology
Retail Company A (2025 Balance Sheet):
- Current Assets: $800 million
- Current Liabilities: $600 million
- Current Ratio: 1.33
Technology Company B (2025 Balance Sheet):
- Current Assets: $5 billion
- Current Liabilities: $2 billion
- Current Ratio: 2.50
Analysis:
Retail Company A operates with lower liquidity because its business model generates immediate cash from sales. Inventory turns over rapidly (every 30-45 days), and most transactions involve instant payment. The 1.33 ratio provides an adequate cushion given these characteristics.
Technology Company B maintains higher liquidity because it operates on subscription models with deferred revenue recognition. The company accumulates cash from annual subscriptions paid upfront but recognizes revenue monthly. This creates a natural cash surplus reflected in the higher ratio.
Neither company’s ratio indicates superior financial health; each reflects appropriate liquidity management for its specific business model.
Common Mistakes When Using the Current Ratio
Even experienced analysts make errors when interpreting this seemingly simple metric. Avoiding these pitfalls improves decision quality.
Mistake #1: Ignoring Industry Context
The error: Comparing ratios across different industries without adjusting for business model differences.
The consequence: Misidentifying healthy companies as risky or vice versa.
The solution: Always benchmark against industry peers and understand sector-specific norms. A 1.1 ratio might be excellent for a grocery chain, but concerning for a software company.
Mistake #2: Focusing Only on the Number
The error: Making decisions based solely on the current ratio without examining underlying components.
The consequence: Missing critical details like deteriorating receivables quality or obsolete inventory, inflating the ratio artificially.
The solution: Drill into balance sheet line items. Examine accounts receivable aging schedules, inventory turnover rates, and liability composition. The ratio is a starting point, not a conclusion.
Mistake #3: Neglecting Trends
The error: Evaluating a single period’s ratio without historical context.
The consequence: Failing to identify improving or deteriorating conditions that signal future opportunities or risks.
The solution: Chart the ratio over at least 12 quarters. Look for patterns, inflection points, and correlation with business events or economic conditions.
Mistake #4: Assuming Higher Is Always Better
The error: Believing that maximizing the Current Ratio represents optimal financial management.
The consequence: Praising companies that hoard cash inefficiently while criticizing those that deploy capital strategically.
The solution: Recognize that ratios above 3.0 often indicate missed opportunities. Evaluate whether excess liquidity could generate higher returns through growth investments, dividend payments, or debt reduction.
Mistake #5: Overlooking Asset Quality
The error: Treating all current assets as equally liquid and valuable.
The consequence: Overestimating a company’s ability to meet obligations when assets include slow-moving inventory or uncollectible receivables.
The solution: Supplement Current Ratio analysis with the Quick Ratio and Cash Ratio. Investigate asset composition and quality through footnotes and management discussion sections.
Mistake #6: Ignoring Off-Balance-Sheet Obligations
The error: Focusing exclusively on reported current liabilities while missing operating leases, contingent liabilities, or other commitments.
The consequence: Underestimating true short-term obligations and overestimating liquidity safety.
The solution: Read financial statement footnotes carefully. Modern accounting standards require more disclosure, but significant obligations may still hide in supplementary information.
Building Your Current Ratio Analysis Framework
Developing a systematic approach to Current Ratio analysis transforms this simple metric into a powerful decision-making tool.
Step 1: Gather Comprehensive Data
Collect at least three years of quarterly balance sheets for the target company and 3-5 competitors. This provides 12+ data points for trend analysis and meaningful peer comparisons.
Sources:
- SEC EDGAR database for public companies
- Company investor relations websites
- Financial data platforms (Yahoo Finance, Bloomberg, etc.)
- Industry association reports for sector benchmarks
Step 2: Calculate and Chart the Ratio
Compute the Current Ratio for each period and create a line chart showing the trend over time. Add the industry average as a reference line to visualize relative performance.
Include annotations for significant events, acquisitions, new product launches, and economic downturns that might explain ratio changes.
Step 3: Decompose the Components
Break down current assets and current liabilities into major categories. Calculate what percentage each component represents of the total.
Example decomposition:
Current Assets (Total: $1,000,000)
- Cash: 40% ($400,000)
- Receivables: 30% ($300,000)
- Inventory: 25% ($250,000)
- Other: 5% ($50,000)
Current Liabilities (Total: $500,000)
- Payables: 50% ($250,000)
- Short-term debt: 30% ($150,000)
- Accrued expenses: 20% ($100,000)
This reveals whether ratio changes stem from asset growth, liability reduction, or shifts in composition.
Step 4: Calculate Supplementary Ratios
Compute the Quick Ratio and Cash Ratio to understand liquidity across different scenarios:
Quick Ratio = (Current Assets – Inventory) ÷ Current Liabilities
Cash Ratio = Cash ÷ Current Liabilities
Compare all three ratios to gauge liquidity strength comprehensively.
Step 5: Benchmark Against Peers
Compare the company’s Current Ratio against industry averages and direct competitors. Identify whether the company operates above, below, or in line with sector norms.
Investigate outliers. Companies with significantly higher or lower ratios than peers either possess competitive advantages/disadvantages or face unique circumstances requiring explanation.
Step 6: Integrate with Broader Analysis
Combine Current Ratio insights with other financial metrics:
- Profitability: EBITDA margins, net profit margins
- Leverage: Debt-to-equity ratio, interest coverage
- Efficiency: Inventory turnover, receivables collection period
- Valuation: P/E ratio, price-to-book, enterprise value
A company with strong profitability and moderate leverage can safely operate with lower Current Ratios than an unprofitable, highly leveraged competitor.
Step 7: Consider Qualitative Factors
Numbers tell part of the story. Qualitative assessment completes the picture:
- Management quality: Track record of capital allocation decisions
- Industry dynamics: Competitive intensity, regulatory environment, technological disruption
- Business model: Recurring revenue, customer concentration, pricing power
- Economic sensitivity: Cyclical vs. defensive characteristics
These factors determine whether a given Current Ratio represents strength or weakness for a specific company.
Actionable Insights: Applying Current Ratio Knowledge
Knowledge becomes valuable only when applied. Here’s how different stakeholders can use Current Ratio analysis to make better decisions.
For Individual Investors
Before buying a stock:
- Verify the Current Ratio exceeds 1.0 (or industry minimum if lower)
- Confirm the ratio trend is stable or improving over the past 8 quarters
- Compare against 3-5 competitors to ensure relative strength
- Check that the ratio aligns with your risk tolerance and investment strategy
For portfolio monitoring:
- Review the Current Ratios quarterly for all holdings
- Set alerts for ratios falling below 1.2 or your personal threshold
- Investigate significant changes (>20% quarter-over-quarter)
- Consider reducing positions when ratios deteriorate without a clear explanation
For Business Owners and Managers
Monthly monitoring:
- Calculate an informal Current Ratio using your accounting system
- Track the trend to catch deterioration before it becomes critical
- Compare against your industry’s healthy range
Strategic planning:
- Set target Current Ratio ranges based on your business model and risk tolerance
- Build liquidity buffers before major investments or expansion
- Establish credit lines when ratios are strong (banks lend most readily to those who need it least)
Operational improvements:
- If the ratio is too low, focus on accelerating collections, reducing inventory, and extending payables
- If the ratio is too high, evaluate growth investments, debt reduction, or shareholder returns
For Financial Analysts
Credit analysis:
- Weight Current Ratio is 15-20% of the overall credit score
- Require minimum thresholds based on industry and loan type
- Monitor covenant compliance for existing loans
Equity research:
- Include the Current Ratio in the liquidity analysis section of research reports
- Flag unusual ratios or trends for deeper investigation
- Incorporate into financial models and scenario analysis
Due diligence:
- Verify balance sheet accuracy during acquisition evaluations
- Assess working capital requirements for leveraged buyout models
- Identify potential liquidity issues that could affect valuation
For Students and Financial Literacy Seekers
Building foundational knowledge:
- Practice calculating Current Ratios using real company financial statements
- Compare companies across different industries to understand variation
- Track a few companies over time to see how ratios evolve
Developing analytical skills:
- Ask “why” when ratios change significantly
- Connect ratio movements to business events and economic conditions
- Challenge assumptions about what constitutes a “good” ratio
Understanding the Current Ratio represents just one component of comprehensive financial literacy. Combine this knowledge with an understanding of compound interest, diversification principles, and evidence-based investing to build true financial competence.
Conclusion
The Current Ratio stands as one of finance’s most accessible yet powerful metrics. By dividing current assets by current liabilities, this simple calculation reveals whether a company can meet its short-term obligations—a fundamental requirement for survival and success.
Key principles to remember:
A Current Ratio above 1.0 indicates more assets than liabilities, suggesting financial stability. The ideal range typically falls between 1.5 and 2.0, balancing adequate liquidity with efficient capital deployment. Ratios below 1.0 signal potential distress requiring immediate attention, while ratios above 3.0 may indicate inefficient cash management.
Industry context determines what constitutes a healthy ratio. Retailers operate successfully with lower ratios than manufacturers or technology companies due to faster cash conversion cycles. Always benchmark against sector peers rather than applying universal standards.
Trend analysis matters more than single snapshots. A ratio improving from 0.9 to 1.4 over eight quarters tells a different story than one declining from 2.5 to 1.4, even though both end at the same number.
The Current Ratio works best as part of a comprehensive analysis, not as a standalone decision criterion. Combine it with the Quick Ratio, Cash Ratio, cash flow analysis, and profitability metrics to form complete conclusions.
Your next steps:
- Practice with real data: Pull balance sheets for three companies in an industry you understand and calculate their Current Ratios
- Build a tracking system: Create a simple spreadsheet to monitor Current Ratios for your investment portfolio or business
- Deepen your knowledge: Study related concepts like working capital management, financial statement analysis, and liquidity planning
- Apply the insights: Use Current Ratio analysis to inform your next investment decision or business strategy
The math behind money reveals the truth. The Current Ratio strips away complexity to answer a fundamental question: Can this company pay its bills? Master this metric, combine it with other financial tools, and you’ll make better decisions about where to invest, how to manage your business, and which companies deserve your trust.
Financial literacy builds wealth one concept at a time. Understanding the Current Ratio represents another step on that journey, a simple formula that unlocks powerful insights about financial health and risk.
📊 Current Ratio Calculator
Calculate and analyze your company’s liquidity position
References
[1] Financial Accounting Standards Board (FASB). “Accounting Standards Codification.” FASB.org, 2025.
[2] CFA Institute. “Financial Statement Analysis: Current Ratio and Liquidity Metrics.” CFA Institute Research Foundation, 2024.
[3] U.S. Securities and Exchange Commission. “Beginners’ Guide to Financial Statements.” SEC.gov, 2025.
[4] Damodaran, Aswath. “Investment Valuation: Tools and Techniques for Determining the Value of Any Asset.” Wiley Finance, 3rd Edition, 2024.
[5] Federal Reserve Bank. “Financial Ratios and Industry Benchmarks.” Federal Reserve Economic Data (FRED), 2025.
[6] Investopedia. “Current Ratio: Definition, Formula, and Analysis.” Investopedia.com, Updated 2025.
[7] Morningstar. “Understanding Financial Health Through Liquidity Ratios.” Morningstar Investment Research, 2025.
Frequently Asked Questions
What is a good Current Ratio?
A good Current Ratio typically falls between 1.5 and 2.0. This range indicates the company has sufficient current assets to cover current liabilities with a comfortable safety margin, without holding excessive idle cash. However, the ideal ratio varies by industry—retailers may operate successfully at 1.0–1.5, while manufacturers often need 1.5–2.5. Always compare against industry benchmarks rather than applying universal standards.
What does a Current Ratio below 1 mean?
A Current Ratio below 1.0 means the company has more current liabilities than current assets, signaling potential liquidity problems. The business may struggle to meet short-term obligations without securing additional financing, selling assets, or rapidly improving operations. This situation raises red flags for investors and creditors, though some companies with strong cash flow generation can operate temporarily below 1.0 during seasonal fluctuations.
How do you calculate the Current Ratio?
Calculate the Current Ratio by dividing total current assets by total current liabilities. Both figures come from the balance sheet. Current assets include cash, accounts receivable, inventory, and other resources convertible to cash within 12 months. Current liabilities include accounts payable, short-term debt, accrued expenses, and other obligations due within one year. The formula is: Current Ratio = Current Assets ÷ Current Liabilities.
What’s the difference between Current Ratio and Quick Ratio?
The Current Ratio includes all current assets, while the Quick Ratio (Acid-Test Ratio) excludes inventory, which may take months to convert to cash. The Quick Ratio formula is: (Current Assets – Inventory) ÷ Current Liabilities. This provides a more conservative liquidity measure, revealing whether a company can meet obligations using only its most liquid assets. The Quick Ratio typically runs 30–50% lower than the Current Ratio.
Can a Current Ratio be too high?
Yes, a Current Ratio above 3.0 may indicate inefficient capital deployment. While high ratios demonstrate strong liquidity, they can suggest the company is hoarding cash rather than investing in growth opportunities that could generate higher returns. Excess current assets might be better deployed through strategic investments, debt reduction, or shareholder returns via dividends or buybacks. Balance sheet efficiency matters as much as safety.
How often should you monitor the Current Ratio?
Investors should review the Current Ratio quarterly when companies release financial statements. Business owners and managers should calculate an informal Current Ratio monthly using their accounting systems to catch deterioration early. Creditors typically evaluate the ratio before extending credit and monitor it periodically for existing borrowers. Tracking trends over multiple periods provides more insight than single snapshots.
Related posts:
 What Is SmartPass? Raptor Digital Hall Pass Explained for K-12 Schools
 What Is the 3x Rent Rule & How to Calculate It (With Examples)
 Portfolio Income: Definition, Examples, Tax Rules, and Strategies
 Bookkeeping vs Accounting: What’s the Difference & Which Do You Need?
 What Is Profitability Analysis & How to Do It: Metrics, Example & Tips
 Emergency Fund vs Savings: What’s the Real Difference and Why It Matters