When a business faces an unexpected cash crunch, the difference between survival and bankruptcy often comes down to one critical factor: liquidity. Understanding the Current Ratio vs Quick Ratio debate isn’t just an academic exercise; it’s the math behind money that separates financially sound companies from those teetering on the edge. These two metrics reveal whether a business can pay its bills when they come due, but they tell dramatically different stories about the same balance sheet.
The Current Ratio vs Quick Ratio comparison forms the foundation of liquidity analysis, yet many investors and business owners misunderstand which metric to trust in different situations. One ratio offers a broad view of short-term financial health, while the other strips away assumptions to reveal the harsh truth about immediate cash availability.
This guide breaks down the formulas, applications, and strategic implications of both ratios with data-driven precision. By understanding the cause-and-effect relationships between assets and liabilities, readers gain the financial literacy needed to evaluate companies, manage business operations, and make evidence-based investing decisions.
Key Takeaways
- Current Ratio measures all current assets against current liabilities (2:1 benchmark), while Quick Ratio excludes inventory and prepaid expenses (1:1 benchmark) for a more conservative liquidity assessment
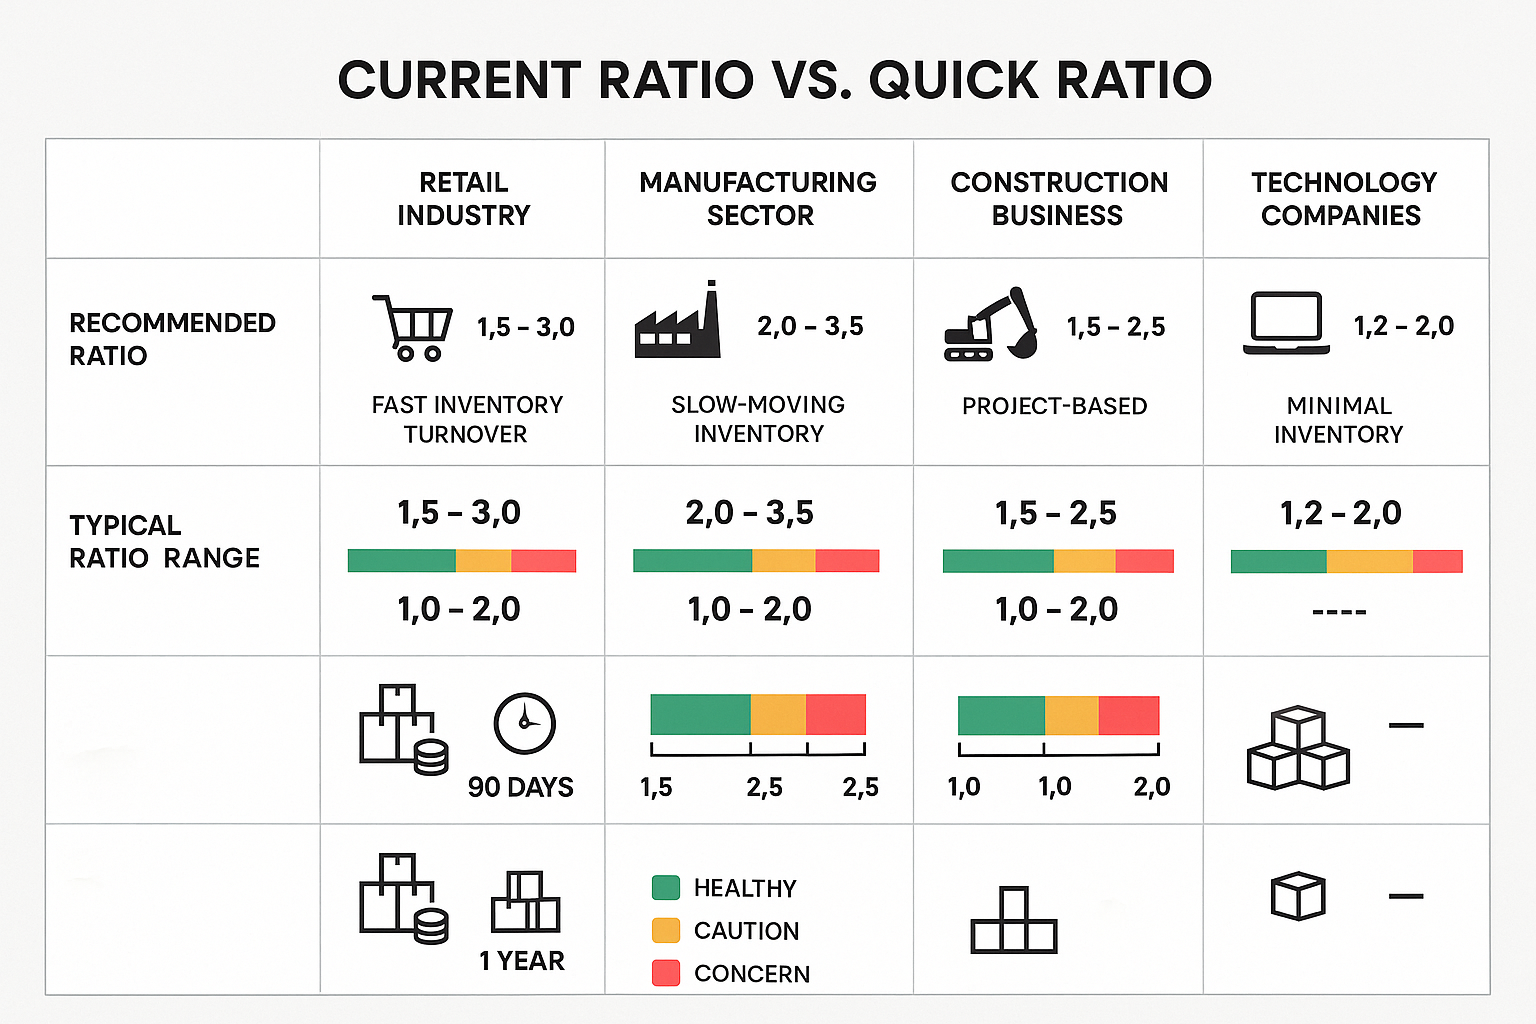
- Quick Ratio provides superior analysis for manufacturing, construction, and heavy industry, where inventory moves slowly, while Current Ratio works better for retail businesses with fast inventory turnover
- Both ratios assess short-term debt repayment capacity, but the Quick Ratio reveals worst-case scenario readiness by focusing only on assets convertible to cash within 90 days
- Current Ratio can overstate liquidity when companies hold obsolete or slow-moving inventory, making Quick Ratio more reliable for creditworthiness checks
- Investors and lenders should analyze both metrics together alongside industry benchmarks to gain a complete understanding of a company’s true financial position
Understanding the Current Ratio: The Broad Liquidity Measure
The Current Ratio represents the most widely used liquidity metric in financial analysis. It measures a company’s ability to pay short-term obligations using all assets expected to convert to cash within one year.
The Current Ratio Formula and Components
The calculation follows a straightforward formula:
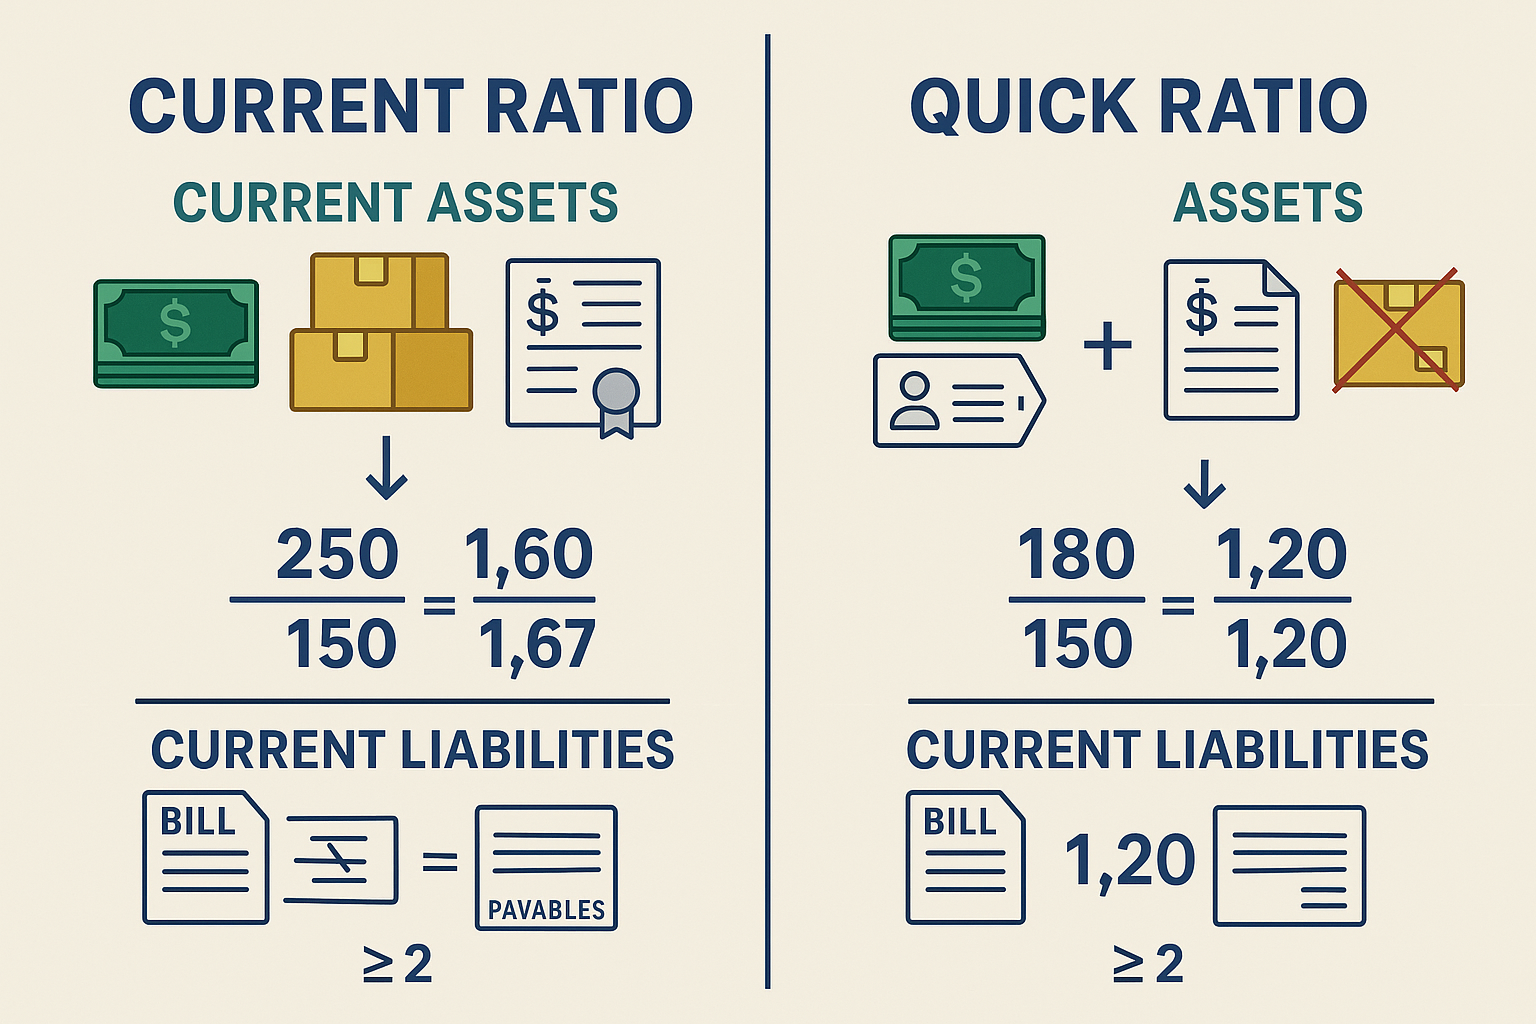
Current Ratio = Current Assets ÷ Current Liabilities
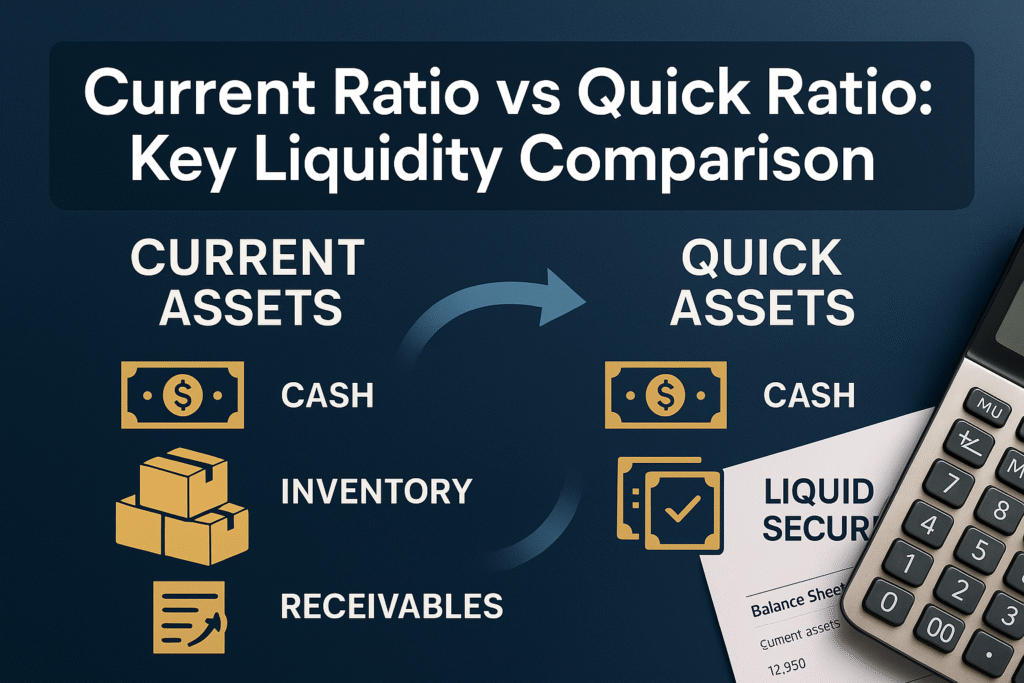
Current assets include every resource convertible to cash within 12 months:
- Cash and cash equivalents
- Marketable securities
- Accounts receivable
- Inventory
- Prepaid expenses
Current liabilities encompass all obligations due within one year:
- Accounts payable
- Short-term debt
- Accrued expenses
- Deferred revenue
A Current Ratio of 2.0 means the company holds $2 in current assets for every $1 of current liabilities. This 2:1 benchmark has become the gold standard, though any ratio above 1.0 indicates the company can theoretically cover its short-term debts.
Why the Current Ratio Matters for Financial Health
The Current Ratio provides a snapshot of operational efficiency and financial stability. Companies with healthy ratios demonstrate:
Working capital sufficiency — The difference between current assets and current liabilities (working capital) funds daily operations without external financing.
Creditor confidence — Suppliers and lenders view strong Current Ratios as evidence of payment reliability, often resulting in better credit terms.
Investment appeal — Investors interpret adequate liquidity as reduced bankruptcy risk and operational competence.
The ratio’s inclusive approach makes it valuable for businesses where inventory converts quickly to cash. Retail companies, for example, benefit from this broader view because their inventory represents genuine near-term liquidity.[2]
Current Ratio Limitations and Blind Spots
Despite widespread use, the Current Ratio contains inherent weaknesses that can mislead analysts:
Inventory valuation assumptions: The ratio treats all inventory as equally liquid, regardless of actual saleability. A warehouse full of obsolete products counts the same as high-demand merchandise.
Timing mismatches: Current assets may take 12 months to convert, while current liabilities could be due in 30 days, creating cash flow gaps despite a healthy ratio.
Industry variation: Manufacturing firms naturally carry more inventory than service businesses, making cross-industry comparisons unreliable without context.
Quality blindness: The metric ignores accounts receivable quality. Receivables from bankrupt customers still inflate the ratio despite being uncollectible.
These limitations explain why sophisticated analysts never rely on the Current Ratio alone. The math behind money requires multiple perspectives to reveal financial truth.
Understanding the Quick Ratio: The Conservative Liquidity Test
The Quick Ratio, also called the Acid-Test Ratio, applies a more stringent standard to liquidity analysis. It answers a critical question: Can this company survive if it must pay all short-term debts immediately without selling inventory?
The Quick Ratio Formula and What It Excludes
The Quick Ratio calculation removes less liquid assets from consideration:
Quick Ratio = (Current Assets – Inventory – Prepaid Expenses) ÷ Current Liabilities
Alternatively expressed as:
Quick Ratio = (Cash + Marketable Securities + Accounts Receivable) ÷ Current Liabilities
This formula focuses exclusively on assets convertible to cash within 90 days or less. The deliberate exclusion of inventory and prepaid expenses creates a worst-case scenario analysis.
The 1:1 benchmark means the company holds $1 in highly liquid assets for every $1 of current liabilities. Unlike the Current Ratio’s 2:1 standard, a Quick Ratio of 1.0 represents ideal liquidity because it proves the company can meet obligations without depending on inventory sales.
Why the Quick Ratio Provides Superior Crisis Analysis
The Quick Ratio’s conservative approach reveals financial resilience during stress periods:
Inventory risk elimination — By excluding inventory, the ratio acknowledges that selling stock quickly often requires steep discounts or may prove impossible during market downturns.
True liquidity focus — The metric concentrates on cash and near-cash assets, providing a realistic assessment of immediate payment capacity.
Lender preference — Banks and creditors favor Quick Ratio analysis when evaluating loan applications because it shows genuine ability to service debt without operational disruption.
Project-based business accuracy — Construction and manufacturing companies with long production cycles benefit from this conservative view, as their inventory may remain tied up for months.
Consider a construction company with a Current Ratio of 2.0 but a Quick Ratio of 0.8. The Current Ratio suggests healthy liquidity, but the Quick Ratio reveals dangerous dependence on selling inventory (equipment, materials, work-in-progress) to meet obligations—a scenario that could force fire sales at substantial losses.
When Quick Ratio Analysis Becomes Essential
Certain situations demand Quick Ratio scrutiny over Current Ratio reliance:
Economic downturns — When consumer demand drops, inventory values plummet. The Quick Ratio shows whether companies can weather reduced sales.
Credit evaluations — Lenders conducting risk management assessments prioritize the Quick Ratio because it reveals borrower resilience.
Slow inventory turnover industries — Manufacturing, heavy industry, and specialized retail sectors, where inventory sits for extended periods, require Quick Ratio analysis for accuracy.
Acquisition due diligence — Buyers evaluating acquisition targets use the Quick Ratio to identify hidden liquidity problems that the Current Ratio might mask.
The Quick Ratio’s stringent approach aligns with evidence-based investing principles by removing optimistic assumptions about asset convertibility.
Current Ratio vs Quick Ratio: Direct Comparison and Key Differences
Understanding the Current Ratio vs Quick Ratio distinction requires examining how each metric approaches the same fundamental question from different angles.
Formula Differences and Calculation Impact
| Metric | Formula | Assets Included | Time Horizon | Benchmark |
|---|---|---|---|---|
| Current Ratio | Current Assets ÷ Current Liabilities | Cash, securities, receivables, inventory, prepaid expenses | 12 months | 2:1 |
| Quick Ratio | (Current Assets – Inventory – Prepaid) ÷ Current Liabilities | Cash, securities, receivables only | 90 days | 1:1 |
The mathematical difference creates dramatically different results. A company with $500,000 in current assets (including $200,000 in inventory) and $200,000 in current liabilities shows:
Current Ratio = $500,000 ÷ $200,000 = 2.5 (excellent)
Quick Ratio = ($500,000 – $200,000) ÷ $200,000 = 1.5 (strong)
Both ratios indicate health, but the Quick Ratio reveals 40% of apparent liquidity depends on converting inventory to cash, a critical insight for risk management.
Philosophical Approach: Relaxed vs Stringent Assessment
The Current Ratio vs Quick Ratio debate fundamentally reflects different analytical philosophies:
Current Ratio adopts a relaxed approach — It assumes normal business operations continue, inventory sells at expected rates, and receivables are collected on schedule. This optimistic view works well for stable companies in predictable industries.
Quick Ratio employs a stringent approach — It assumes crisis conditions where inventory may become worthless or require deep discounts. This pessimistic view protects against worst-case scenarios.
Neither approach is inherently superior. The choice depends on the analysis purpose and business context. Investors building long-term positions might emphasize the Current Ratio, while lenders extending short-term credit prioritize the Quick Ratio.
Industry-Specific Applications and Benchmarks
Different industries require different ratios of emphasis based on inventory characteristics:
Retail and E-commerce — Fast inventory turnover makes the Current Ratio more relevant. Companies like grocery stores convert inventory to cash within days, validating the inclusion of stock in liquidity calculations.
Manufacturing and Heavy Industry — Slow production cycles and specialized inventory make the Quick Ratio essential. A manufacturer holding $10 million in custom machinery parts cannot quickly liquidate that inventory without massive losses.
Construction — Project-based revenue and long completion timelines favor Quick Ratio analysis. Construction Financial Management Association (CFMA) benchmarks show average Current Ratios of 1.9 (range 1.5-2.0+) and Quick Ratios of 1.6 (range 1.0-1.3+) for healthy firms.
Technology and Services — Minimal inventory makes both ratios converge. Software companies with negligible physical inventory show nearly identical Current and Quick Ratios.
Financial Services — Unique asset structures require modified ratio interpretations, as traditional inventory doesn’t apply.
This industry variation explains why valuation principles demand contextual analysis rather than universal ratio application.
Complementary Analysis: Using Both Ratios Together
The most sophisticated financial analysis employs both metrics simultaneously to triangulate truth:
Ratio gap analysis — Large differences between Current and Quick Ratios signal heavy inventory dependence. A Current Ratio of 3.0 paired with a Quick Ratio of 0.9 reveals dangerous reliance on inventory conversion.
Trend analysis — Tracking both ratios over time reveals operational changes. Declining Quick Ratio despite stable Current Ratio indicates growing inventory accumulation—potentially signaling demand problems.
Peer comparison — Comparing both ratios against industry competitors identifies relative strengths and weaknesses. A company with a below-average Current Ratio but an above-average Quick Ratio demonstrates superior inventory management.
Scenario planning — Using the Current Ratio for base-case projections and the Quick Ratio for stress-testing creates comprehensive risk management frameworks.
The relationship between accounts receivable and accounts payable further influences both ratios, as collection timing affects actual liquidity regardless of ratio strength.
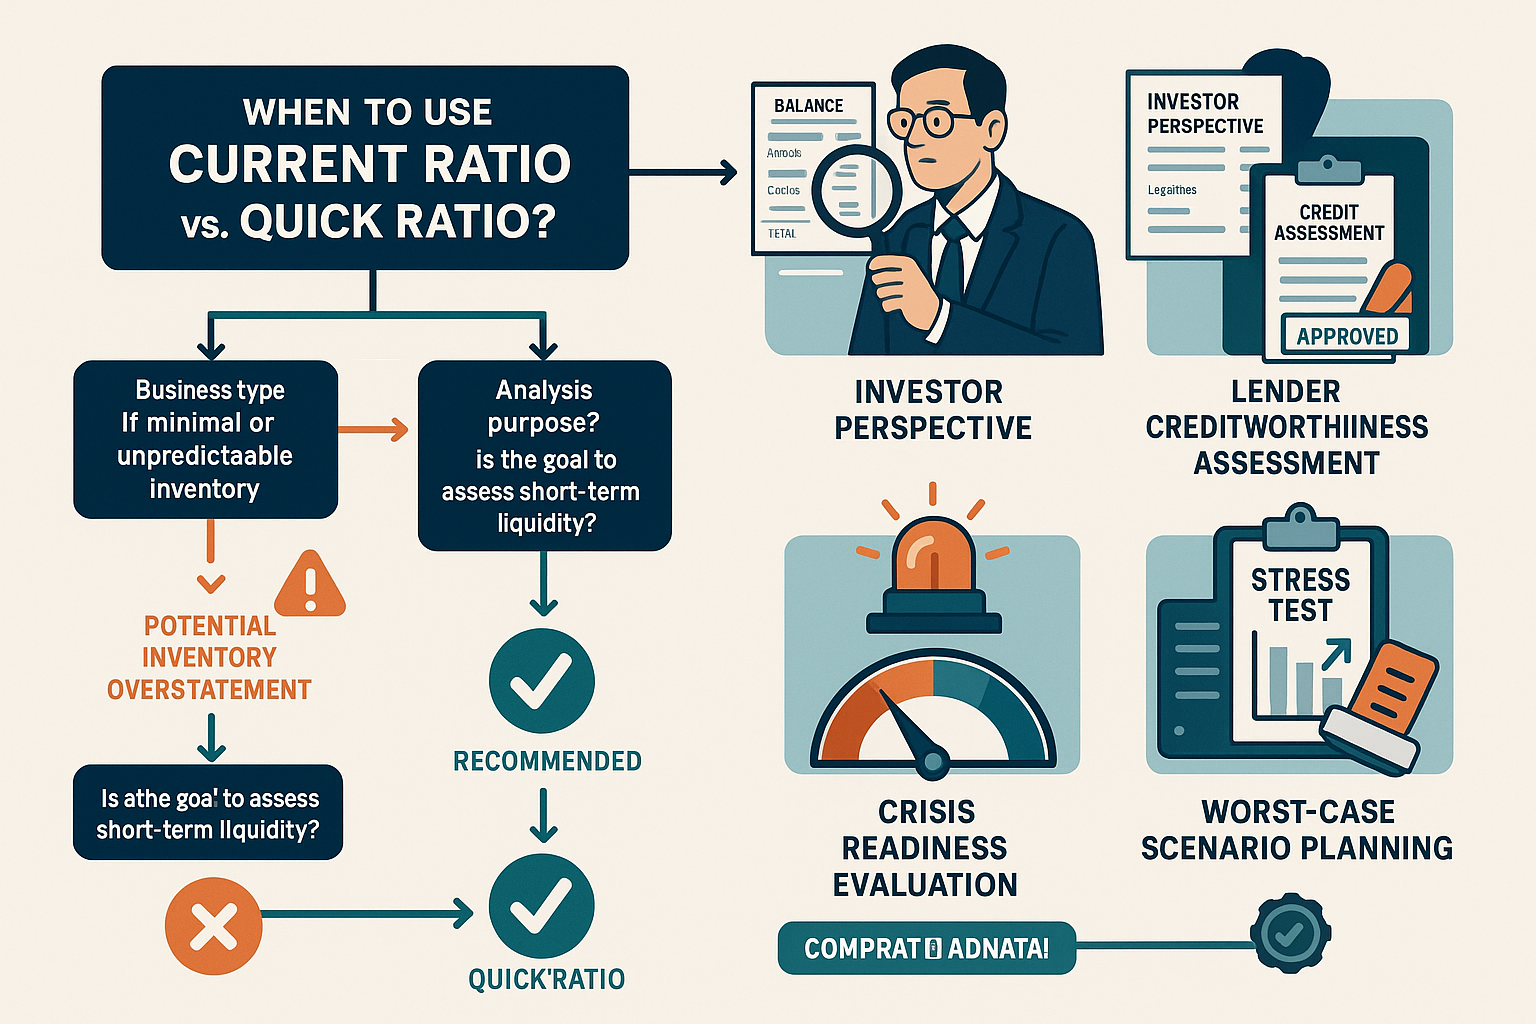
Practical Applications: When to Use Each Ratio
The Current Ratio vs Quick Ratio decision depends on specific analytical objectives and stakeholder perspectives.
For Business Owners and Managers
Operational planning — Current Ratio guides working capital management and inventory purchasing decisions. Maintaining the 2:1 benchmark ensures sufficient buffer for operational fluctuations.
Cash flow forecasting — Quick Ratio reveals immediate liquidity for unexpected expenses or opportunities. Managers facing equipment failure or sudden contract opportunities need Quick Ratio clarity on available resources.
Inventory optimization — Monitoring the gap between ratios identifies inventory efficiency. Widening gaps suggest excess stock accumulation requiring management attention.
Seasonal adjustments — Businesses with seasonal patterns should track both ratios monthly. Retailers building holiday inventory naturally see the Current Ratio rise while the Quick Ratio falls—expected behavior requiring recognition rather than alarm.
Effective managers integrate these metrics with balance sheet basics and cash flow statement analysis for comprehensive financial oversight.
For Investors and Analysts
Stock screening — Investors can filter companies by minimum ratio thresholds. Conservative investors might require a Quick Ratio above 1.0 to ensure crisis resilience.
Credit risk assessment — Bond investors and lenders prioritize the Quick Ratio when evaluating default risk. Companies with Quick Ratios below 1.0 face higher refinancing costs and credit restrictions.
Valuation adjustments — Weak liquidity ratios justify valuation discounts. A company trading at an attractive price-to-earnings multiple but showing a Quick Ratio below 0.5 carries hidden risk requiring premium compensation.
Turnaround identification — Improving Quick Ratio trends signals successful restructuring. Companies emerging from distress often show Quick Ratio recovery before Current Ratio improvement.
Combining ratio analysis with dividend investing strategies helps identify sustainable payout companies versus those borrowing to maintain distributions.
For Lenders and Credit Analysts
Loan approval criteria — Banks establish minimum ratio requirements for different loan types. Short-term working capital lines might require a Quick Ratio above 1.2, while longer-term loans accept lower thresholds.
Covenant structuring — Loan agreements include ratio maintenance covenants. Borrowers must maintain specified Current or Quick Ratios or face default provisions.
Early warning systems — Declining ratios trigger enhanced monitoring. A borrower whose Quick Ratio drops below covenant levels receives increased scrutiny and potential intervention.
Industry-adjusted standards — Sophisticated lenders apply industry-specific benchmarks rather than universal standards, recognizing that construction company ratios differ fundamentally from software company metrics.
The debt-to-equity ratio and debt ratio provide complementary leverage analysis alongside liquidity metrics for complete credit evaluation.
Improving Your Liquidity Ratios: Actionable Strategies
Understanding ratios enables improvement. The math behind money reveals specific actions that strengthen both Current and Quick Ratios.
Strategies to Improve Current Ratio
Accelerate receivables collection — Reducing days sales outstanding converts receivables to cash faster. Offering early payment discounts (2/10 net 30 terms) incentivizes faster customer payment.
Optimize inventory levels — Just-in-time inventory management reduces excess stock while maintaining operational capacity. Lower inventory investment frees capital for other uses.
Extend payables strategically — Negotiating longer payment terms with suppliers (without damaging relationships) reduces current liabilities. Moving from net 30 to net 60 terms immediately improves the ratio.
Refinance short-term debt — Converting current liabilities to long-term debt removes obligations from the denominator. A company refinancing a one-year note into a five-year term loan instantly improves the Current Ratio.
Increase profitability — Retained earnings accumulate as current assets (cash) without creating liabilities, organically strengthening the ratio over time.
These strategies align with budgeting principles that emphasize sustainable financial management over short-term manipulation.
Strategies to Improve Quick Ratio
Build cash reserves — Establishing an emergency fund for business operations directly strengthens the Quick Ratio by increasing the most liquid asset.
Reduce inventory dependence — Transitioning to drop-shipping, consignment, or made-to-order models minimizes inventory investment while maintaining revenue capacity.
Improve receivables quality — Tightening credit standards and eliminating slow-paying customers improves the reliability of receivables as quick assets.
Liquidate excess inventory — Selling obsolete or slow-moving inventory (even at discounts) converts uncertain assets into cash, strengthening the Quick Ratio despite potential losses.
Invest in marketable securities — Placing excess cash in liquid, short-term securities maintains Quick Ratio strength while generating returns superior to checking accounts.
The cash conversion cycle directly impacts both ratios by determining how quickly operations generate cash.
Warning: Ratio Manipulation and Financial Engineering
Not all ratio improvements reflect genuine financial health. Managers facing pressure may employ questionable tactics:
Window dressing — Timing asset sales or debt payments around reporting dates creates artificially strong ratios that don’t represent normal operations.
Channel stuffing — Shipping excess inventory to distributors inflates receivables while reducing inventory, temporarily improving the Quick Ratio before inevitable returns.
Aggressive revenue recognition — Recording revenue prematurely inflates receivables without corresponding cash collection, creating phantom liquidity.
Sale-leaseback transactions — Selling assets and leasing them back generates cash that improves ratios but creates long-term obligations not captured in current liabilities.
Sophisticated investors recognize these tactics by analyzing cash flow statements alongside balance sheet ratios. Divergence between reported profits and actual cash generation signals potential manipulation.
Real-World Examples: Current Ratio vs Quick Ratio in Action
Examining actual scenarios illustrates how the Current Ratio vs Quick Ratio comparison reveals different financial realities.
Example 1: Retail Company with Fast Inventory Turnover
Company A operates a grocery chain with the following balance sheet position:
- Cash: $500,000
- Marketable securities: $200,000
- Accounts receivable: $300,000
- Inventory: $1,000,000
- Current liabilities: $800,000
Current Ratio = $2,000,000 ÷ $800,000 = 2.5
Quick Ratio = $1,000,000 ÷ $800,000 = 1.25
Analysis: Both ratios indicate strong liquidity. The grocery business converts inventory to cash within days, making the inclusion in the Current Ratio appropriate. The Quick Ratio confirms the company can meet obligations even without inventory sales, demonstrating genuine financial strength.
Investor takeaway: This company represents low liquidity risk suitable for conservative portfolios focused on dividend stocks with sustainable payouts.
Example 2: Manufacturing Company with Slow Inventory Turnover
Company B manufactures specialized industrial equipment:
- Cash: $300,000
- Marketable securities: $100,000
- Accounts receivable: $500,000
- Inventory: $2,000,000 (custom parts, work-in-progress)
- Current liabilities: $1,200,000
Current Ratio = $2,900,000 ÷ $1,200,000 = 2.42
Quick Ratio = $900,000 ÷ $1,200,000 = 0.75
Analysis: The Current Ratio suggests adequate liquidity, but the Quick Ratio reveals dangerous dependence on inventory conversion. With $2 million in specialized inventory that may take months to sell (potentially at discounts), the company cannot meet immediate obligations without external financing.
Investor takeaway: This company carries hidden liquidity risk. Credit analysts would flag this for enhanced monitoring, and equity investors should demand higher returns to compensate for increased risk.
Example 3: Technology Company with Minimal Inventory
Company C operates a software-as-a-service business:
- Cash: $1,500,000
- Marketable securities: $500,000
- Accounts receivable: $800,000
- Inventory: $50,000 (servers, equipment)
- Prepaid expenses: $100,000
- Current liabilities: $1,000,000
Current Ratio = $2,950,000 ÷ $1,000,000 = 2.95
Quick Ratio = $2,800,000 ÷ $1,000,000 = 2.80
Analysis: Both ratios show exceptional liquidity with minimal divergence. The service-based business model requires little inventory, making both metrics equally reliable. The company holds nearly three times its obligations in liquid assets.
Investor takeaway: This represents ideal liquidity positioning. The company can pursue growth opportunities, weather economic downturns, and maintain operations without liquidity concerns, characteristics favored in growth stock investing.
Example 4: Construction Company with Project-Based Revenue
Company D operates a commercial construction business:
- Cash: $400,000
- Marketable securities: $0
- Accounts receivable: $1,200,000 (retention receivables, progress billings)
- Inventory: $800,000 (materials, equipment)
- Current liabilities: $1,000,000
Current Ratio = $2,400,000 ÷ $1,000,000 = 2.4
Quick Ratio = $1,600,000 ÷ $1,000,000 = 1.6
Analysis: Both ratios exceed industry benchmarks (CFMA standards: Current Ratio 1.5-2.0+, Quick Ratio 1.0-1.3+). However, the receivables quality requires scrutiny, retention receivables may not convert to cash for months, and progress billings depend on project completion.
Investor takeaway: While ratios appear healthy, construction-specific risks (project delays, client disputes, retention holdbacks) mean actual liquidity may be weaker than ratios suggest. This demonstrates why industry knowledge enhances ratio interpretation.
These examples illustrate how the Current Ratio vs Quick Ratio comparison provides different insights depending on business model and industry characteristics.
Common Mistakes in Liquidity Ratio Analysis
Even experienced analysts make errors when interpreting these metrics. Avoiding common pitfalls improves decision quality.
Mistake 1: Ignoring Industry Context
Comparing ratios across different industries produces meaningless conclusions. A software company with a Current Ratio of 1.5 may be stronger than a retailer with 2.5 because their business models demand different working capital structures.
Solution: Always compare companies within the same industry and reference industry-specific benchmarks published by trade associations or financial data providers.
Mistake 2: Focusing on Ratios While Ignoring Absolute Values
A company with $10,000 in current assets and $5,000 in current liabilities shows a Current Ratio of 2.0—but lacks sufficient scale to operate effectively. Ratios measure relationships, not magnitude.
Solution: Analyze absolute dollar values alongside ratios. A $10 million company with a 1.5 ratio demonstrates more financial capacity than a $100,000 company with a 2.5 ratio.
Mistake 3: Treating Ratios as Static Snapshots
Balance sheet ratios represent a single moment in time. A company photographed on December 31 may show different ratios on January 15 due to normal business cycles.
Solution: Track ratio trends over multiple periods (quarterly and annually). Consistent patterns matter more than individual data points. Seasonal businesses require year-over-year comparisons rather than sequential quarter analysis.
Mistake 4: Accepting Inventory at Face Value
Balance sheet inventory values may not reflect the actual liquidation value. Obsolete inventory, damaged goods, and slow-moving stock inflate assets without providing real liquidity.
Solution: Review inventory turnover ratios and days inventory outstanding metrics. Declining turnover with rising inventory values signals potential obsolescence that overstates both Current and Quick Ratios.
Mistake 5: Overlooking Receivables Quality
Not all receivables convert to cash. Accounts from bankrupt customers, disputed invoices, and aged receivables (over 90 days) provide questionable liquidity despite appearing as current assets.
Solution: Examine accounts receivable aging reports and bad debt expense trends. Companies with high percentages of aged receivables or rising bad debt provisions carry weaker liquidity than ratios suggest.
Mistake 6: Confusing Liquidity with Solvency
Liquidity measures short-term payment capacity while solvency measures long-term viability. A company can be liquid but insolvent (able to pay current bills but carrying unsustainable long-term debt) or illiquid but solvent (temporarily cash-poor but fundamentally sound).
Solution: Analyze liquidity ratios alongside solvency metrics like debt-to-equity ratio, equity ratio, and interest coverage ratios for a complete financial assessment.
Understanding these common errors elevates analysis from mechanical calculation to genuine financial insight, the foundation of financial literacy that drives wealth building.
Advanced Liquidity Analysis: Beyond Basic Ratios
Sophisticated investors and analysts extend basic ratio analysis with additional metrics and techniques.
The Cash Ratio: The Ultimate Conservative Measure
The Cash Ratio represents the most stringent liquidity test:
Cash Ratio = (Cash + Marketable Securities) ÷ Current Liabilities
This metric excludes even receivables, focusing exclusively on immediately available funds. While rarely used as a primary metric, it reveals absolute worst-case liquidity. Companies with Cash Ratios above 0.5 demonstrate exceptional financial resilience.[7]
Operating Cash Flow Ratio: The Dynamic Perspective
Static balance sheet ratios miss operational cash generation. The Operating Cash Flow Ratio adds this dimension:
Operating Cash Flow Ratio = Operating Cash Flow ÷ Current Liabilities
This metric shows whether normal operations generate sufficient cash to cover short-term obligations without relying on asset liquidation. Ratios above 1.0 indicate self-sustaining operations—a powerful signal of financial health.
Working Capital Analysis
Absolute working capital (Current Assets – Current Liabilities) provides context that ratios alone cannot:
Positive working capital indicates a liquidity cushion, but the amount matters. A company with $10 million in working capital operates more comfortably than one with $100,000, even if ratios match.
Working capital trends reveal operational efficiency. Declining working capital despite revenue growth signals deteriorating collection or inventory management.
Working capital turnover (Revenue ÷ Working Capital) measures how efficiently companies convert working capital into sales. Higher turnover indicates superior capital efficiency.
Days Working Capital Metrics
Converting ratios into time-based metrics provides an intuitive understanding:
Days Sales Outstanding (DSO) = (Accounts Receivable ÷ Revenue) × 365
Measures average collection time. Lower is better.
Days Inventory Outstanding (DIO) = (Inventory ÷ Cost of Goods Sold) × 365
Measures how long inventory sits before sale. Lower indicates efficiency.
Days Payables Outstanding (DPO) = (Accounts Payable ÷ Cost of Goods Sold) × 365
Measures payment timing to suppliers. Higher provides a cash flow benefit.
The cash conversion cycle (DSO + DIO – DPO) combines these metrics to show how long cash remains tied up in operations. Shorter cycles indicate superior liquidity management.
Altman Z-Score: Comprehensive Distress Prediction
The Altman Z-Score incorporates liquidity ratios with profitability and leverage metrics to predict bankruptcy probability. This multi-factor model provides more reliable distress prediction than any single ratio.
Companies with Z-Scores above 2.99 demonstrate financial safety, while scores below 1.81 signal distress zones. Investors can use this framework for risk management in portfolio construction.
Conclusion: Mastering Liquidity Analysis for Financial Success
The Current Ratio vs Quick Ratio comparison represents more than an academic distinction—it provides the analytical framework for evaluating financial resilience, managing business operations, and making evidence-based investing decisions. Understanding both metrics reveals the complete liquidity picture that single-ratio analysis cannot provide.
The math behind money shows that the Current Ratio offers a broad assessment of short-term financial health, including all assets convertible within one year. This relaxed approach works well for stable companies in industries with fast inventory turnover. The 2:1 benchmark provides a comfortable margin for operational fluctuations and unexpected challenges.
Quick Ratio applies stringent standards by excluding inventory and prepaid expenses, focusing exclusively on assets convertible to cash within 90 days. This conservative approach reveals worst-case scenario readiness—critical information for lenders, investors, and managers planning for uncertainty. The 1:1 benchmark ensures companies can meet obligations without depending on inventory sales.
Neither ratio provides complete truth in isolation. Manufacturing companies with slow inventory turnover require a Quick Ratio emphasis to avoid overestimating liquidity. Retail businesses with fast-moving inventory benefit from Current Ratio’s inclusive view. Technology and service companies with minimal inventory find that both ratios converge, making either metric reliable.
The strategic application of both ratios together enables:
Investors are to identify hidden liquidity risks that might threaten dividend sustainability or operational stability
Business owners need to optimize working capital management and maintain adequate liquidity cushions
Lenders to assess creditworthiness and structure appropriate loan covenants
Analysts to compare companies within industries using contextually appropriate benchmarks
Financial literacy demands understanding not just formulas but the cause-and-effect relationships they reveal. Companies with wide gaps between Current and Quick Ratios signal inventory dependence. Declining Quick Ratios, despite stable Current Ratios, indicate growing liquidity pressure. Improving trends in both metrics demonstrate operational improvements and strengthening financial position.
The journey to wealth building requires mastering these fundamental metrics alongside complementary analysis of balance sheet basics, cash flow statements, and leverage ratios. Together, these tools provide the data-driven insights that separate successful investors from those who rely on hope and speculation.
Next Steps: Applying Liquidity Analysis
For investors: Screen your current portfolio holdings for both Current and Quick Ratios. Identify companies with Quick Ratios below 1.0 and investigate whether inventory dependence creates unrecognized risk. Consider rebalancing toward companies with stronger liquidity positions.
For business owners: Calculate both ratios monthly and track trends over time. If the Quick Ratio falls below industry benchmarks, implement strategies to reduce inventory levels, accelerate receivables collection, or build cash reserves.
For financial learners: Practice calculating both ratios using real company financial statements from SEC filings. Compare companies within the same industry to understand how business models affect liquidity requirements.
The principles of risk management apply equally to personal finance and business operations. Just as individuals need emergency funds covering 3-6 months of expenses, businesses require adequate liquidity cushions to weather unexpected challenges. The Current Ratio vs Quick Ratio framework provides the measurement tools to ensure that a cushion exists.
Financial success emerges from understanding the numbers, recognizing patterns, and making decisions based on evidence rather than emotion. These liquidity ratios represent fundamental building blocks in that analytical foundation—tools that transform raw financial data into actionable insight and confident decision-making.
References
[1] Corporate Finance Institute. “Current Ratio.” CFI Education. https://corporatefinanceinstitute.com/resources/accounting/current-ratio-formula/
[2] CFA Institute. “Financial Analysis Techniques.” CFA Program Curriculum. https://www.cfainstitute.org/
[3] Investopedia. “Quick Ratio (Acid-Test Ratio).” Financial Ratios. https://www.investopedia.com/terms/q/quickratio.asp
[4] Construction Financial Management Association. “Financial Benchmarks.” CFMA Resources. https://www.cfma.org/
[5] U.S. Securities and Exchange Commission. “Beginners’ Guide to Financial Statements.” Investor Publications. https://www.sec.gov/
[6] Construction Financial Management Association. “Industry Financial Ratios and Benchmarks.” 2025 Annual Report.
[7] Federal Reserve. “Financial Ratios and Business Analysis.” Federal Reserve Education. https://www.federalreserve.gov/
About the Author
Max Fonji is a data-driven financial educator and the voice behind The Rich Guy Math. With expertise in financial analysis, valuation principles, and evidence-based investing, Max translates complex financial concepts into clear, actionable insights. His analytical approach combines rigorous mathematical frameworks with practical application, helping readers understand the cause-and-effect relationships that drive wealth building and financial success.
Educational Disclaimer
This article provides educational information about financial ratios and liquidity analysis. It does not constitute financial, investment, or business advice. Financial ratios represent analytical tools that require contextual interpretation based on industry, business model, and economic conditions. Readers should conduct thorough due diligence and consult qualified financial professionals before making investment or business decisions. Past financial performance does not guarantee future results. The Rich Guy Math assumes no liability for decisions made based on information presented in this article.
Frequently Asked Questions (FAQ)
What is the main difference between Current Ratio and Quick Ratio?
The Current Ratio includes all current assets (cash, securities, receivables, and inventory) divided by current liabilities, while the Quick Ratio excludes inventory and prepaid expenses to focus only on highly liquid assets. This makes Quick Ratio a more conservative measure that reveals whether a company can meet obligations without selling inventory.
Which ratio is more important for investors?
Neither ratio is universally more important—the choice depends on the industry and analysis purpose. Quick Ratio provides better insight for manufacturing and construction companies with slow inventory turnover, while Current Ratio works well for retail businesses with fast-moving inventory. Sophisticated investors analyze both ratios together to gain complete understanding.
What is a good Current Ratio?
The ideal Current Ratio benchmark is 2:1, meaning $2 in current assets for every $1 of current liabilities. However, any ratio above 1.0 indicates the company can theoretically cover short-term debts. Industry context matters significantly—technology companies often operate successfully with lower ratios while manufacturing firms may need higher ratios.
What is a good Quick Ratio?
A Quick Ratio of 1:1 represents the ideal benchmark, indicating the company holds $1 in liquid assets for every $1 of current liabilities. Ratios above 1.0 demonstrate strong liquidity, while ratios below 1.0 suggest potential cash flow challenges. Construction industry standards accept Quick Ratios in the 1.0–1.3+ range as healthy.
Can a company have a good Current Ratio but poor Quick Ratio?
Yes, this common scenario occurs when companies hold excessive inventory. A manufacturer might show a Current Ratio of 2.5 but a Quick Ratio of 0.8, indicating dangerous dependence on inventory conversion to meet obligations. This divergence signals potential liquidity problems that Current Ratio alone would miss.
How often should businesses calculate these ratios?
Public companies report quarterly, but internal management should monitor both ratios monthly. Seasonal businesses benefit from weekly tracking during peak periods. Trend analysis requires consistent measurement intervals—monthly tracking over 12+ months reveals patterns that quarterly snapshots might miss.
Do service companies need to worry about these ratios?
Yes, though the ratios typically converge for service businesses. With minimal inventory, service companies show similar Current and Quick Ratios. However, receivables quality becomes more critical—consulting firms with large unbilled services or disputed invoices may face liquidity challenges despite apparently strong ratios.
What causes Quick Ratio to be higher than Current Ratio?
This unusual situation occurs when companies carry negative inventory values (rare) or when prepaid expenses are substantial. More commonly, it signals data errors. Under normal circumstances, Quick Ratio should always be lower than Current Ratio because it excludes assets included in the Current Ratio calculation.
Related posts:
 What Is SmartPass? Raptor Digital Hall Pass Explained for K-12 Schools
 What Is the 3x Rent Rule & How to Calculate It (With Examples)
 Portfolio Income: Definition, Examples, Tax Rules, and Strategies
 Bookkeeping vs Accounting: What’s the Difference & Which Do You Need?
 What Is Profitability Analysis & How to Do It: Metrics, Example & Tips
 Emergency Fund vs Savings: What’s the Real Difference and Why It Matters