
In 2008, the global financial system nearly collapsed under the weight of excessive debt. Banks, households, and governments had borrowed beyond their means, creating a house of cards that eventually toppled. What followed was one of the largest deleveraging cycles in modern history, a painful but necessary process of reducing debt to restore financial stability.
Deleveraging is the systematic reduction of total debt obligations through strategic financial actions. Whether you’re analyzing a corporation’s balance sheet, managing personal finances, or studying macroeconomic trends, understanding deleveraging reveals the math behind financial risk management and long-term stability.
This guide explains the mechanics, strategies, and real-world implications of deleveraging, from the formulas that measure leverage to the economic consequences of debt reduction at scale.
Key Takeaways
- Deleveraging reduces absolute debt levels through cash flow repayment, asset sales, equity raises, or expenditure cuts, fundamentally different from refinancing, which only restructures existing obligations
- Financial health improves measurably as debt-to-equity ratios decline, return on assets stabilizes, and balance sheet risk decreases
- Short-term economic pain often precedes long-term stability because reduced borrowing and spending temporarily slow economic growth
- Multiple deleveraging strategies exist, each with distinct risk profiles, timelines, and suitability depending on financial position and market conditions
- Failure to deleverage when overleveraged significantly increases default probability and bankruptcy risk
What Is Deleveraging? The Core Definition
Deleveraging is the process by which an entity, whether a company, household, or government, reduces its total debt burden relative to its assets or equity.
In plain terms, deleveraging means owing less money.
The mathematical relationship is straightforward:
Leverage Ratio = Total Debt ÷ Total Equity
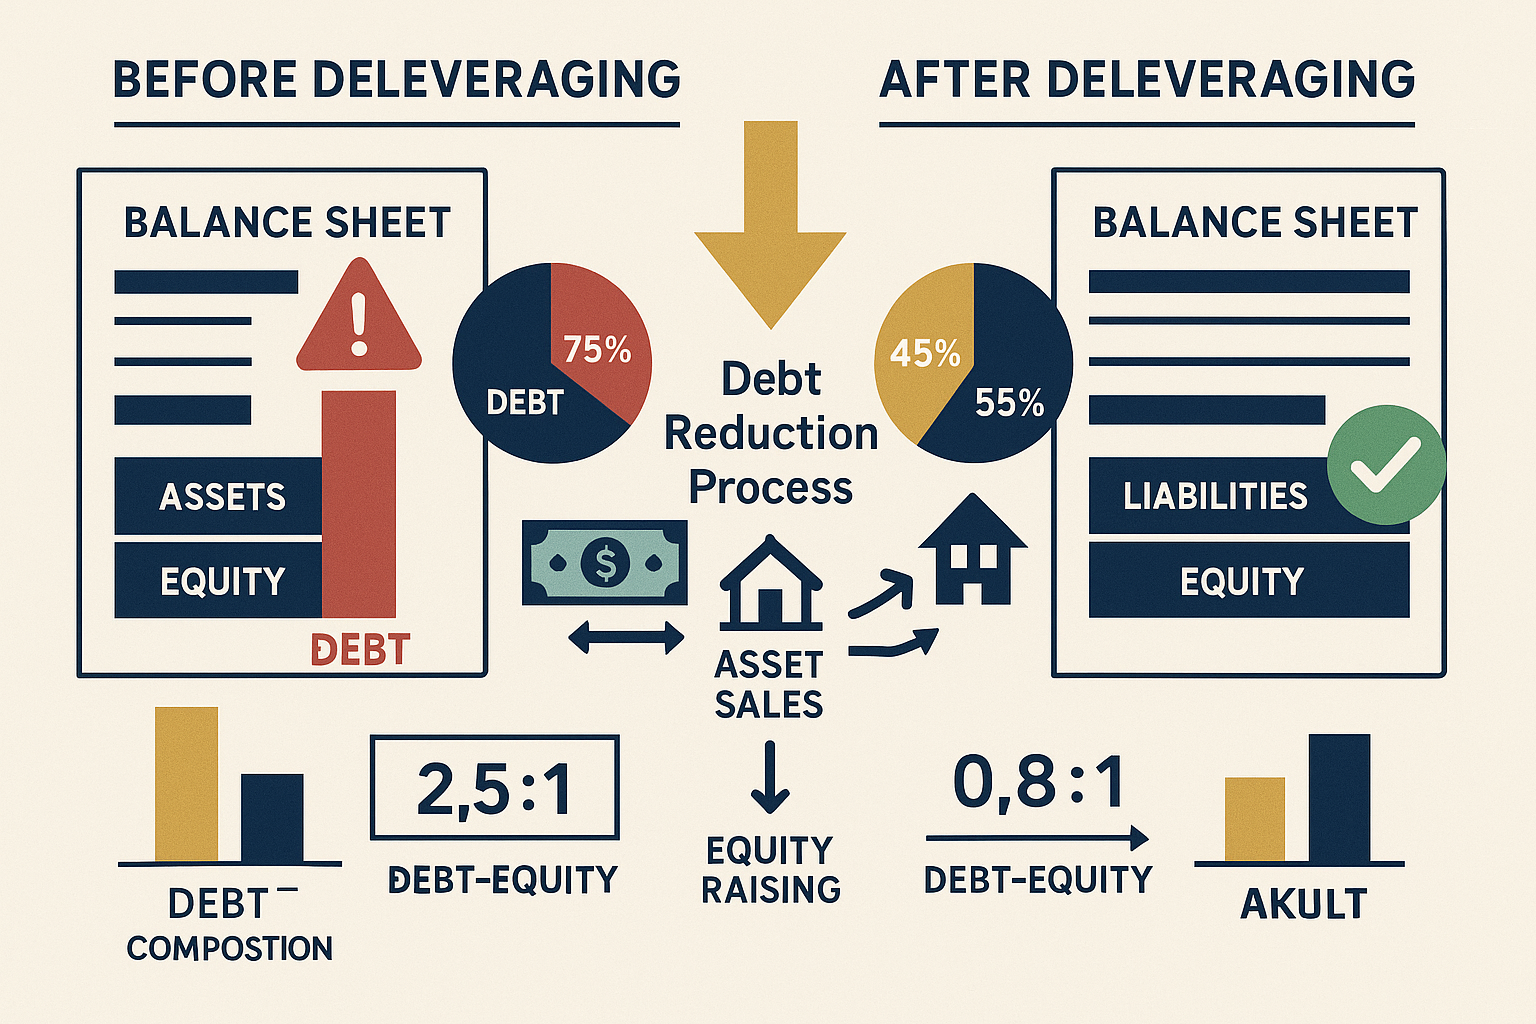
When this ratio decreases, deleveraging has occurred. A company with $500 million in debt and $250 million in equity has a debt-to-equity ratio of 2.0. If that company pays down $200 million in debt, the new ratio becomes 1.2, a significant deleveraging.
Why Leverage Exists in the First Place
Leverage amplifies returns. Borrowing money to invest in productive assets can generate returns exceeding the cost of debt, creating value for equity holders. This principle drives corporate expansion, real estate investment, and economic growth.
But leverage cuts both ways. When asset values decline or cash flows weaken, debt obligations remain fixed. The same leverage that amplified gains now amplifies losses, threatening solvency.
Deleveraging becomes necessary when debt levels exceed an entity’s capacity to service obligations comfortably.
Deleveraging vs. Refinancing: A Critical Distinction
Many confuse deleveraging with refinancing. The difference matters:
- Refinancing restructures existing debt, changing interest rates, maturity dates, or terms, without reducing the principal amount owed
- Deleveraging reduces the absolute dollar amount of outstanding debt
A homeowner who refinances a $300,000 mortgage at a lower interest rate still owes $300,000. A homeowner who pays down the balance to $250,000 has deleveraged by $50,000.
Both strategies improve financial position, but through different mechanisms. Refinancing optimizes debt structure; deleveraging eliminates debt exposure.
The Math Behind Deleveraging: Key Financial Ratios
Deleveraging success is measured through specific financial metrics that reveal balance sheet health and risk exposure.
Debt-to-Equity Ratio (D/E)
Formula: Total Liabilities ÷ Shareholders’ Equity
This ratio shows how much debt finances operations relative to equity. A ratio above 2.0 indicates high leverage; below 1.0 suggests conservative financing.
Example: A company with $800 million in debt and $400 million in equity has a D/E ratio of 2.0. After selling non-core assets for $300 million and using proceeds to retire debt, the new ratio becomes 1.25 ($500M ÷ $400M), a successful deleveraging.
Debt-to-Asset Ratio
Formula: Total Debt ÷ Total Assets
This metric reveals what percentage of assets are financed through borrowing. Lower percentages indicate stronger financial stability and greater cushion against asset value declines.
Understanding your assets vs liabilities relationship provides the foundation for evaluating leverage positions.
Interest Coverage Ratio
Formula: EBITDA ÷ Interest Expense
This ratio measures how easily a company can meet interest obligations from operating earnings. A ratio below 2.0 signals potential debt servicing difficulties; above 5.0 indicates comfortable coverage.
Deleveraging directly improves this ratio by reducing total interest expense, even if operating earnings remain constant.
Return on Equity (ROE) and Return on Assets (ROA)
Deleveraging affects these profitability metrics in complex ways:
- ROE often declines initially because reducing debt decreases financial leverage, which amplifies equity returns
- ROA typically improves because the denominator (assets) decreases while operating performance stabilizes
The trade-off reflects a fundamental principle: deleveraging sacrifices amplified returns for reduced risk.
For a deeper understanding of profitability metrics, explore accounting profit and its relationship to leverage decisions.
Why Deleveraging Matters: The Risk-Return Trade-Off
Financial leverage exists on a spectrum. Too little leverage means missed growth opportunities; too much leverage creates existential risk.
The Overleveraging Problem
Excessive debt creates multiple vulnerabilities:
- Cash flow strain: Fixed debt payments consume operating cash flow, leaving insufficient resources for operations, investment, or unexpected challenges
- Reduced financial flexibility: Overleveraged entities cannot access additional credit when opportunities or emergencies arise
- Amplified downside risk: Small revenue declines or asset value decreases become magnified, threatening solvency
- Covenant violations: Debt agreements typically include financial covenants; breaching these triggers default provisions
The 2008 financial crisis demonstrated these risks at scale. Banks with leverage ratios exceeding 30:1 faced insolvency when asset values declined just 3-4%. The math is unforgiving: a 30:1 leverage ratio means a 3.3% asset decline eliminates 100% of equity.
When Deleveraging Becomes Necessary
Several triggers typically initiate deleveraging:
Economic downturns: Declining revenues and asset values make existing debt loads unsustainable
Credit market tightening: When lenders restrict credit availability, refinancing becomes difficult or impossible
Regulatory pressure: Banking regulators may mandate capital increases and debt reductions after identifying systemic risks
Strategic repositioning: Management may voluntarily deleverage to strengthen competitive position and operational flexibility
Covenant violations: Breaching debt agreement terms often requires immediate deleveraging actions
The decision to deleverage reflects a fundamental reassessment of appropriate risk levels given current and expected future conditions.
Deleveraging Strategies: Four Primary Approaches
Entities facing excessive debt have four main pathways to reduce leverage. Each approach carries distinct advantages, costs, and implementation challenges.
1. Cash Flow Debt Repayment
Method: Use operating cash flow to pay down principal balances systematically
This approach represents the most sustainable deleveraging path. Companies generate cash through operations, allocate a portion to debt reduction, and gradually strengthen the balance sheet.
Advantages:
- No asset sales or equity dilution required
- Demonstrates operational strength to creditors and investors
- Maintains strategic assets and growth potential
Disadvantages:
- Slow process requiring years of disciplined execution
- Diverts cash from growth investments and shareholder returns
- It may not be feasible if cash flows are insufficient
Example: A manufacturing company generates $100 million annual free cash flow. By allocating $60 million yearly to debt reduction instead of dividends or acquisitions, it retires $300 million in debt over five years.
For personal finance applications, this mirrors the discipline required in budgeting strategies that prioritize debt reduction.
2. Asset Sales
Method: Sell non-core or underperforming assets and use proceeds to retire debt
This strategy accelerates deleveraging by converting illiquid assets into cash for immediate debt paydown.
Advantages:
- Rapid debt reduction without waiting for cash flow accumulation
- Eliminates underperforming or non-strategic assets
- Can improve operational focus and efficiency
Disadvantages:
- May require selling assets below fair value in distressed situations
- Reduces future earning potential from divested assets
- Can signal financial distress to markets, depressing valuations
Example: A retail conglomerate sells its underperforming international division for $500 million and uses proceeds to retire high-interest bonds, reducing annual interest expense by $40 million.
The quality and timing of asset sales significantly impact outcomes. Forced sales during market downturns typically realize lower values than strategic divestitures during favorable conditions.
3. Equity Raises
Method: Issue new equity shares and use proceeds to pay down debt
This approach swaps debt obligations for equity ownership, directly improving leverage ratios.
Advantages:
- Immediate balance sheet improvement
- Reduces fixed debt service obligations
- Strengthens financial flexibility and covenant compliance
Disadvantages:
- Dilutes existing shareholders’ ownership percentage
- It may be difficult or expensive if equity markets are unfavorable
- Signals potential distress, potentially depressing share prices
Example: A technology company issues 10 million new shares at $50 per share, raising $500 million. Using these proceeds to retire debt reduces the debt-to-equity ratio from 1.8 to 0.9.
Understanding equity fundamentals helps evaluate when this strategy makes sense versus alternatives.
4. Expenditure Cuts and Operational Restructuring
Method: Reduce operating expenses and capital expenditures to free cash flow for debt reduction
This approach combines cost discipline with cash flow optimization.
Advantages:
- Improves operational efficiency permanently
- Generates cash without asset sales or equity dilution
- Can be implemented quickly through management action
Disadvantages:
- May damage long-term competitiveness if cuts are too deep
- Can reduce employee morale and organizational capability
- Provides limited relief if the debt burden is extremely high
Example: A telecommunications company reduces annual operating expenses by $200 million through workforce reductions, vendor renegotiations, and facility consolidations. The savings fund accelerated debt repayment over three years.
The effectiveness of expenditure cuts depends on distinguishing productive investments from wasteful spending. Cutting muscle along with fat weakens future competitive position.
Combining Strategies for Maximum Effect
Most successful deleveraging programs employ multiple approaches simultaneously. A comprehensive strategy might include:
- Immediate expenditure reductions to stabilize cash flow
- Strategic asset sales of non-core businesses
- Operational cash flow allocation to debt repayment
- Selective equity raises if market conditions are favorable
The optimal combination depends on debt severity, asset quality, market conditions, and strategic priorities.
The Economic Impact of Deleveraging: Macro Perspectives
When deleveraging occurs at scale, across many households, companies, or governments simultaneously, he economic consequences extend far beyond individual balance sheets.
The Deleveraging Paradox
Individual deleveraging improves personal financial health. But when everyone deleverages simultaneously, collective economic activity contracts.
This paradox operates through several mechanisms:
Reduced consumption: Households paying down debt spend less on goods and services
Decreased investment: Companies reducing leverage cut capital expenditures and hiring
Credit contraction: Banks’ deleveraging reduces lending to businesses and consumers
Asset price deflation: Forced asset sales depress prices, reducing collateral values and tightening credit further
The result: a self-reinforcing cycle where deleveraging begets economic weakness, which necessitates further deleveraging.
Historical Deleveraging Episodes
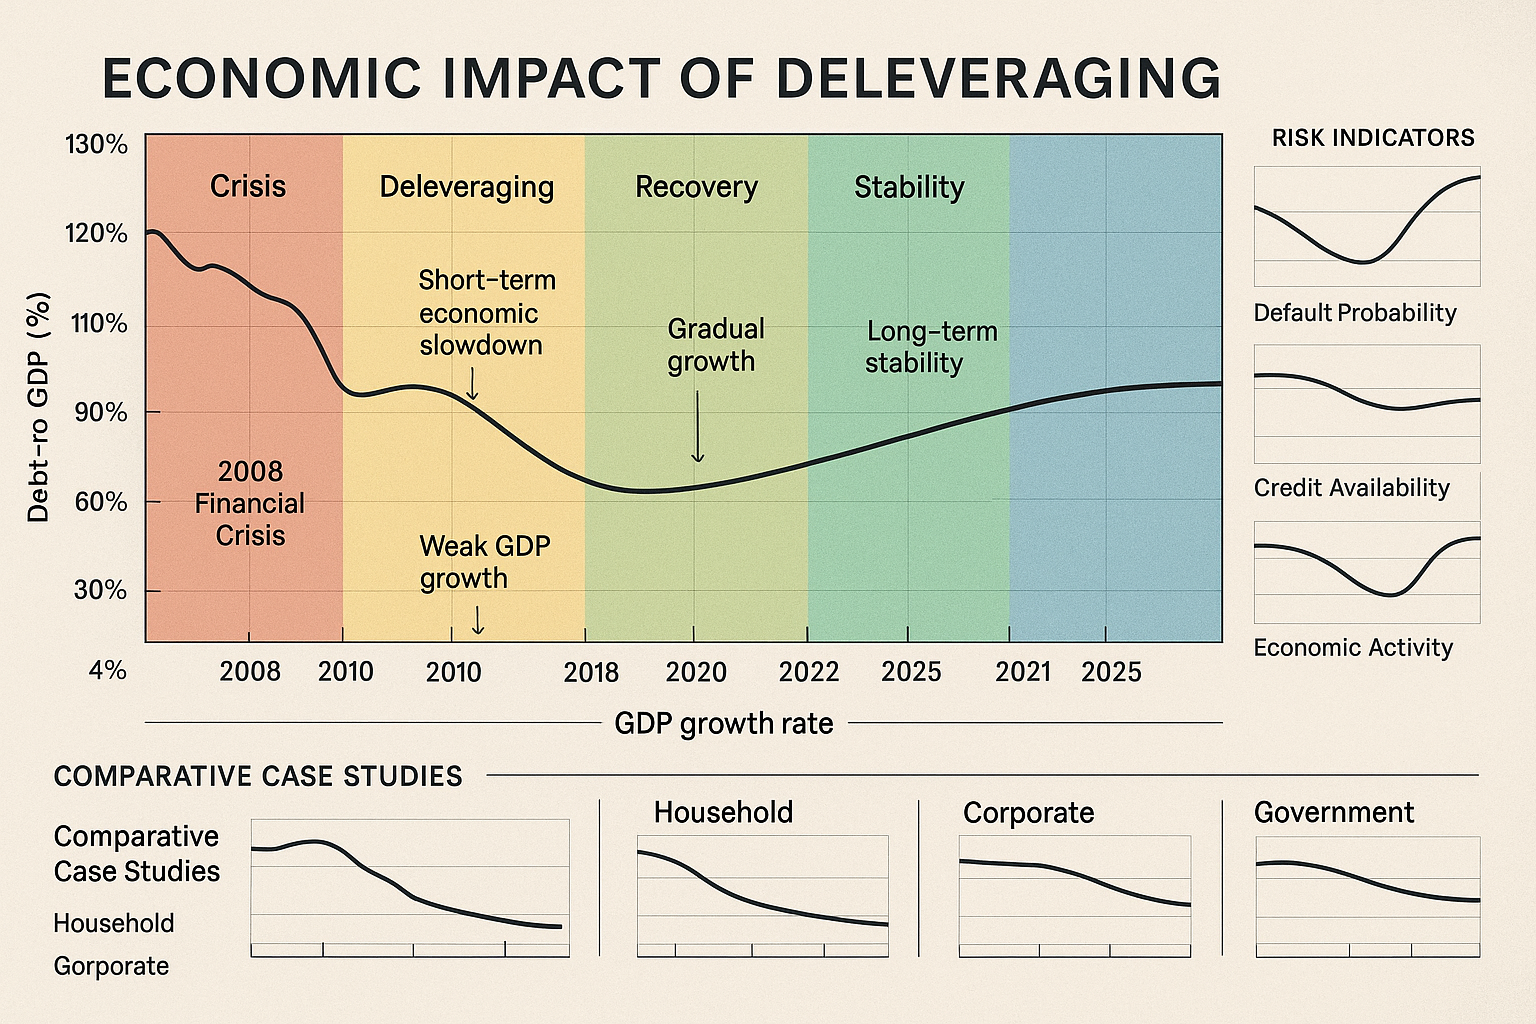
The 2008-2012 period provides the most recent large-scale deleveraging example:
U.S. household debt declined from 98% of GDP in 2008 to 87% by 2012, a reduction exceeding $1 trillion. This deleveraging contributed to the slowest economic recovery since the Great Depression.
European sovereign debt crisis forced peripheral countries into painful deleveraging. Greece, Spain, Portugal, and Ireland reduced government deficits while households and banks simultaneously deleveraged, producing deep recessions.
Japanese experience in the 1990s demonstrated that deleveraging following an asset bubble can create decades of economic stagnation. Corporate Japan spent years paying down debt accumulated during the 1980s bubble, contributing to the “Lost Decade.”
Research by McKinsey Global Institute found that major deleveraging episodes historically last 6-7 years and involve debt-to-GDP reductions averaging 25 percentage points.
The Speed-Impact Relationship
Deleveraging speed critically affects economic outcomes:
Gradual deleveraging allows economic adjustment without severe disruption. Modest annual debt reductions spread over many years permit continued growth while improving financial stability.
Rapid deleveraging creates severe economic contraction. When debt reduction must occur quickly, due to credit market closure or regulatory mandates, the economic pain intensifies dramatically.
The optimal deleveraging path balances financial stability restoration against economic growth preservation. Too slow, and risks accumulate; too fast, and economic collapse becomes self-fulfilling.
Policy Responses to Deleveraging
Governments and central banks employ several tools to mitigate the deleveraging’s economic impact:
Monetary policy: Central banks reduce interest rates and implement quantitative easing to offset credit contraction
Fiscal policy: Government spending increases to compensate for private sector demand reduction
Debt restructuring: Organized debt forgiveness or modification programs reduce debt burdens without full repayment
Regulatory forbearance: Temporary relaxation of capital requirements allows gradual rather than forced deleveraging
The effectiveness of these interventions varies. Monetary policy loses potency when interest rates approach zero. Fiscal policy faces political constraints and debt sustainability concerns. The challenge lies in supporting economic activity while allowing necessary balance sheet repair.
Understanding broader economic cycles helps contextualize individual deleveraging decisions within the market emotion cycle.
Deleveraging in Different Contexts: Applications Across Finance
Deleveraging principles apply across financial domains, though implementation details vary significantly.
Corporate Deleveraging
Companies deleverage for strategic and survival reasons. The process typically follows this sequence:
- Assessment: Analyze current leverage ratios, debt maturity schedules, and covenant compliance
- Strategy selection: Choose among cash flow allocation, asset sales, equity raises, or combinations
- Implementation: Execute chosen strategies while maintaining operational continuity
- Monitoring: Track leverage metrics and adjust tactics as conditions evolve
Case example: After acquiring Whole Foods in 2017, Amazon carried minimal debt relative to its size. This conservative leverage provided flexibility to invest aggressively in logistics, technology, and new ventures without financial constraint, demonstrating how voluntary deleveraging creates strategic optionality.
Companies evaluate leverage through multiple lenses, including the debt-to-equity ratio and current ratio, to assess financial health comprehensively.
Household Deleveraging
Personal deleveraging follows similar principles but with different constraints:
Mortgage debt: The largest household liability for most families. Deleveraging occurs through regular amortization, extra principal payments, or downsizing to less expensive housing.
Consumer debt: Credit cards, auto loans, and personal loans represent high-cost debt requiring priority reduction. The avalanche method (highest interest first) or snowball method (smallest balance first) provides a systematic approach.
Student loans: Educational debt presents unique challenges given the limited discharge options. Income-driven repayment plans and refinancing offer paths to manage the burden.
Household deleveraging improves financial resilience and reduces stress, though it requires discipline and often lifestyle adjustments. The 50/30/20 budgeting rule provides a framework for allocating income toward debt reduction.
Managing credit utilization strategically supports both deleveraging goals and credit score maintenance.
Bank Deleveraging
Financial institutions face unique deleveraging challenges given their role as credit intermediaries and regulatory capital requirements.
Banks can deleverage through:
Shrinking assets: Allowing loans to mature without replacement, selling securities portfolios, or divesting business lines
Raising capital: Issuing new equity to increase the denominator in leverage calculations
Reducing off-balance-sheet exposures: Absorbing structured investment vehicles and special purpose entities back onto the balance sheet, then winding them down
Operational restructuring: Cutting expenses to preserve capital through retained earnings
The 2008 crisis forced massive bank deleveraging globally. U.S. banks raised over $400 billion in new equity between 2008-2010 while simultaneously reducing assets by trillions through portfolio runoff and sales.
Bank deleveraging directly impacts credit availability throughout the economy, affecting business investment and household borrowing capacity.
Government Deleveraging (Fiscal Consolidation)
Sovereign deleveraging, often called fiscal consolidation or austerity, involves reducing government debt-to-GDP ratios through:
Revenue increases: Tax hikes to generate additional government income
Expenditure reductions: Cutting government programs, services, and employment
Economic growth: Expanding the GDP denominator faster than debt accumulation
Government deleveraging proves politically challenging because spending cuts and tax increases both impose immediate pain while benefits accrue gradually over the years.
The European debt crisis demonstrated these difficulties. Countries like Greece implemented severe austerity programs that successfully reduced deficits but triggered deep recessions that increased debt-to-GDP ratios initially; the opposite of the intended effect.
Deleveraging Risks and Challenges: What Can Go Wrong
While deleveraging improves financial health long-term, the process carries significant risks requiring careful management.
Economic Contraction Risk
Aggressive deleveraging reduces economic activity through multiple channels:
- Reduced spending by entities prioritizing debt repayment over consumption or investment
- Credit unavailability as lenders tighten standards and reduce loan volumes
- Asset deflation from forced sales is depressing market values
- Negative feedback loops where economic weakness necessitates further deleveraging
The severity depends on how many entities deleverage simultaneously and how quickly the process unfolds.
Operational Damage from Excessive Cuts
Companies deleveraging through expenditure reductions risk cutting too deeply, damaging long-term competitiveness:
- Deferred maintenance creates future operational problems and safety risks
- R&D cuts reduce innovation capacity and product pipeline strength
- Talent loss through layoffs eliminates institutional knowledge and capability
- Customer service degradation damages brand reputation and market position
The challenge lies in distinguishing essential investments from discretionary spending. Indiscriminate cost-cutting often proves counterproductive.
Asset Sale Timing and Valuation
Deleveraging through asset sales works best when markets are strong and buyers are plentiful. Unfortunately, deleveraging often becomes necessary precisely when conditions are unfavorable:
- Distressed pricing: Forced sellers accept below-market values
- Limited buyer pool: Credit constraints reduce potential acquirers
- Information asymmetry: Buyers assume assets are being sold due to quality problems
- Strategic disadvantage: Competitors recognize desperation and negotiate aggressively
These dynamics can create situations where asset sales destroy more value than the debt reduction provides.
Equity Dilution and Shareholder Conflict
Deleveraging through equity issuance creates tension between existing shareholders and creditors:
Existing shareholders suffer ownership dilution and may oppose equity raises even when financially necessary
Creditors prefer equity raises that reduce default risk and improve debt recovery prospects
Management must navigate these competing interests while maintaining company viability
In distressed situations, this conflict can delay necessary actions until options narrow and costs increase.
Default and Bankruptcy Risk
Entities unable to deleverage successfully through voluntary means face involuntary alternatives:
Technical default: Covenant violations trigger lender rights even if payments continue
Payment default: Inability to meet scheduled debt service obligations
Bankruptcy filing: Legal protection from creditors while restructuring or liquidating
These outcomes destroy value for all stakeholders and should be avoided through proactive deleveraging when possible.
Understanding financial health metrics like the Altman Z-Score helps identify bankruptcy risk before it becomes acute.
Measuring Deleveraging Success: Tracking Progress
Effective deleveraging requires clear metrics and regular monitoring to assess progress and adjust strategies.
Primary Leverage Metrics
Debt-to-Equity Ratio Trend
- Track quarterly changes in total debt relative to equity
- Target: Declining ratio moving toward industry benchmarks or internal targets
- Warning sign: Ratio increasing despite deleveraging efforts
Debt-to-EBITDA Multiple
- Measures debt burden relative to operating cash flow generation
- Target: Below 3.0x for most industries; below 2.0x for conservative positioning
- Warning sign: Multiple above 5.0x indicates potential servicing difficulties
Interest Coverage Ratio
- EBITDA divided by interest expense
- Target: Above 5.0x provides a comfortable cushion
- Warning sign: Below 2.0x suggests vulnerability to earnings volatility
Secondary Financial Health Indicators
Free Cash Flow Margin
- Percentage of revenue converting to free cash flow after debt service
- Improving margins indicates successful deleveraging, creating financial flexibility
Credit Rating Changes
- Rating agency upgrades validate deleveraging success
- Downgrades signal insufficient progress or deteriorating conditions
Cost of Debt
- Interest rates on new borrowings decline as leverage improves
- Widening spreads indicate market skepticism about deleveraging efforts
Operational Performance Metrics
Deleveraging shouldn’t destroy operational capability. Monitor:
- Revenue growth rates: Ensure deleveraging doesn’t sacrifice market position
- Operating margins: Verify cost cuts improve efficiency rather than damage operations
- Customer retention: Track whether service quality remains adequate
- Employee turnover: Monitor whether workforce reductions exceed natural attrition
Balanced deleveraging improves financial metrics while maintaining or enhancing operational performance.
Deleveraging Best Practices: Strategic Implementation
Successful deleveraging programs share common characteristics that maximize benefits while minimizing risks.
1. Start Early, Act Proactively
The best time to deleverage is before a crisis forces action. Voluntary deleveraging from a position of strength allows:
- Better asset sale pricing through patient marketing
- Equity raises at favorable valuations
- Gradual expenditure adjustments minimizing operational disruption
- Negotiating leverage from financial stability
Waiting until distress eliminates options and increases costs dramatically.
2. Develop Comprehensive Plans with Multiple Scenarios
Effective deleveraging requires detailed planning:
- Baseline scenario: Expected path under normal conditions
- Stress scenario: Actions required if conditions deteriorate
- Opportunity scenario: Accelerated deleveraging if conditions improve
Plans should specify:
- Target leverage ratios and timeline
- Specific actions with assigned responsibilities
- Decision triggers for scenario shifts
- Contingency options if primary strategies fail
3. Communicate Transparently with Stakeholders
Deleveraging affects multiple constituencies, requiring clear communication:
Investors: Explain strategic rationale, expected timeline, and anticipated impacts on returns
Creditors: Demonstrate commitment to debt service and provide regular progress updates
Employees: Clarify how operational changes affect workforce and organizational priorities
Customers: Reassure them that service quality and product support will continue
Regulators: Provide required reporting and demonstrate compliance with mandates
Transparency builds trust and support for difficult decisions.
4. Balance Financial and Strategic Objectives
Pure financial optimization may sacrifice long-term strategic positioning. Consider:
- Retaining strategic assets even if a sale would accelerate deleveraging
- Maintaining essential R&D and innovation investments
- Preserving key talent and organizational capabilities
- Protecting brand reputation and customer relationships
The goal is sustainable financial health supporting long-term value creation, not just rapid debt reduction.
5. Monitor, Measure, and Adjust
Deleveraging rarely proceeds exactly as planned. Establish:
- Monthly financial metric reviews
- Quarterly strategy reassessment
- Clear decision criteria for tactical adjustments
- Flexibility to accelerate or moderate pace based on conditions
Rigid adherence to initial plans despite changing circumstances often produces suboptimal outcomes.
Real-World Deleveraging Examples: Case Studies
Examining actual deleveraging episodes illustrates principles in practice and reveals common patterns.
General Electric (2017-2021)
Situation: GE entered 2017 with over $130 billion in debt across diverse businesses, including power, aviation, healthcare, and financial services. The conglomerate structure and high leverage created financial fragility.
Deleveraging strategy:
- Sold GE Capital assets for $23 billion
- Divested Baker Hughes stake for $3 billion
- Spun off the healthcare business
- Reduced dividend from $0.96 to $0.01 annually
- Cut operational expenses by billions
Results: By 2021, GE reduced debt to approximately $75 billion, a $55 billion reduction. The company split into three focused entities (aerospace, healthcare, energy) with stronger balance sheets.
Lessons: Comprehensive deleveraging required multiple strategies over the years, significant shareholder pain through dividend cuts, and fundamental business restructuring beyond simple debt paydown.
U.S. Household Sector (2008-2013)
Situation: American households entered the financial crisis with record debt levels—mortgage, credit card, auto loans, and student debt totaling 98% of GDP.
Deleveraging drivers:
- Home foreclosures eliminated mortgage debt involuntarily
- Credit card defaults and charge-offs
- Voluntary debt paydown from reduced consumption
- Bankruptcy filings
- Refinancing at lower rates (not pure deleveraging but improved debt service)
Results: Household debt-to-GDP fell to 87% by 2013, representing over $1 trillion in debt reduction. The process contributed to slow economic recovery as reduced consumer spending dampened growth.
Lessons: Large-scale deleveraging creates macroeconomic headwinds even as individual financial health improves. The process required years and involved both voluntary and involuntary debt reduction.
European Banks (2011-2016)
Situation: European banks entered the sovereign debt crisis with leverage ratios often exceeding 30:1, holding significant exposure to troubled government bonds.
Deleveraging requirements:
- Regulatory mandates for higher capital ratios
- Market pressure to reduce risk exposure
- Sovereign debt concerns require balance sheet strengthening
Deleveraging actions:
- Raised over €200 billion in new equity
- Reduced assets by €3.2 trillion through portfolio sales and runoff
- Exited non-core markets and business lines
- Cut operational expenses and headcount
Results: European bank leverage ratios improved from 30:1 to approximately 15:1 by 2016. However, reduced lending capacity contributed to weak European economic growth during this period.
Lessons: Regulatory-driven deleveraging can occur rapidly when mandated, but creates high economic costs through reduced credit availability.
Deleveraging and Personal Finance: Practical Applications
The principles governing corporate deleveraging apply equally to personal financial management, though the specific tactics differ.
Assessing Personal Leverage
Calculate personal leverage using these metrics:
Debt-to-Income Ratio: Total monthly debt payments ÷ gross monthly income
- Target: Below 36% (including mortgage)
- Warning: Above 43% indicates potential overleverage
Debt-to-Net Worth Ratio: Total liabilities ÷ total assets
- Target: Below 0.5 for financial stability
- Warning: Above 1.0 means negative net worth
Emergency Fund Coverage: Months of expenses covered by liquid savings
- Target: 6 months for financial security
- Warning: Less than 3 months creates vulnerability
Understanding your emergency fund requirements provides context for appropriate debt levels.
Personal Deleveraging Strategies
Debt Avalanche Method: Pay minimums on all debts, direct extra payments to the highest-interest debt first
- Mathematically optimal
- Saves maximum interest
- Requires discipline to maintain motivation
Debt Snowball Method: Pay minimums on all debts, direct extra payments to the smallest balance first
- Psychologically motivating through quick wins
- Slightly less mathematically efficient
- Often, more sustainable behaviorally
Balance Transfer Strategy: Move high-interest credit card debt to 0% promotional offers
- Reduces interest burden during paydown period
- Requires discipline to avoid new charges
- Watch for transfer fees and promotional period end dates
Debt Consolidation: Combine multiple debts into a single, lower-interest loan
- Simplifies payments and reduces interest
- May extend the repayment period
- Requires addressing spending behaviors that created debt
Learn more about debt consolidation approaches and their effectiveness.
Balancing Deleveraging with Other Financial Goals
Personal deleveraging must balance against competing priorities:
Retirement savings: Don’t completely sacrifice tax-advantaged retirement contributions to pay low-interest debt
Emergency fund: Maintain basic liquidity even while deleveraging to avoid new debt from unexpected expenses
Investment opportunities: Consider the opportunity cost of debt paydown versus investment returns
Quality of life: Extreme austerity often proves unsustainable; build in modest discretionary spending
The optimal approach depends on:
- Interest rates on various debts
- Tax implications of different strategies
- Personal risk tolerance and financial stability
- Behavioral factors affecting sustainability
When Personal Deleveraging Becomes Urgent
Certain warning signs indicate that deleveraging should become the top financial priority:
- Missing payments or paying late regularly
- Using new debt to service existing debt
- Receiving collection calls or notices
- Approaching or exceeding credit limits
- Experiencing constant financial stress and anxiety
These symptoms indicate overleveraging, requiring immediate corrective action before the situation deteriorates further.
The Future of Deleveraging: Trends and Considerations
As we move through 2025, several trends shape deleveraging dynamics across economies and sectors.
Rising Interest Rate Environment Impact
After years of near-zero rates, higher interest costs make debt more expensive to service:
- Refinancing challenges: Entities replacing low-rate debt with higher-rate debt face increased cash flow pressure
- Deleveraging incentives: Higher debt costs increase the value of debt reduction
- Credit tightening: Lenders become more selective, limiting refinancing options
This environment favors proactive deleveraging before refinancing becomes necessary at unfavorable terms.
Corporate Debt Maturity Wall
Significant corporate debt issued during the low-rate period of 2020-2021 matures between 2025-2028:
- Over $2 trillion in U.S. corporate debt requires refinancing
- Many companies face substantially higher interest rates
- Weaker credits may struggle to refinance, forcing deleveraging
This maturity concentration creates systematic deleveraging pressure across corporate sectors.
Government Debt Sustainability Questions
Major economies carry historically high government debt-to-GDP ratios:
- U.S. federal debt exceeds 120% of GDP
- Japan approaches 260% of GDP
- European nations range from 60% to 180%
Higher interest rates increase debt service costs, potentially forcing fiscal consolidation (government deleveraging) in coming years. The economic and political challenges of sovereign deleveraging will likely dominate policy discussions.
Household Financial Resilience Focus
Post-pandemic household balance sheets vary dramatically:
- Some households used pandemic savings to deleverage successfully
- Others accumulated new debt or depleted savings
- Student loan resumption after forbearance creates renewed debt service pressure
Financial literacy and proactive debt management become increasingly important as economic uncertainty continues.
Climate Transition and Stranded Assets
The shift toward renewable energy and climate adaptation creates potential deleveraging triggers:
- Fossil fuel companies may face asset impairments requiring balance sheet repair
- Real estate in climate-vulnerable locations could lose value
- Transition costs may strain corporate and government finances
These long-term structural changes add complexity to leverage and deleveraging decisions.
💰 Deleveraging Impact Calculator
Calculate how debt reduction improves your financial ratios
📊 Deleveraging Impact
Conclusion: The Math Behind Financial Stability
Deleveraging represents one of finance’s most important yet challenging processes—the systematic reduction of debt to restore balance sheet health and reduce risk exposure.
The mathematics are straightforward: lower debt-to-equity ratios, improved interest coverage, and reduced financial vulnerability. The implementation proves far more complex, requiring strategic choices among competing priorities, stakeholder management, and sustained execution over the years.
Several principles emerge from examining deleveraging across contexts:
Start early, act proactively. Voluntary deleveraging from financial strength provides far more options and better outcomes than forced deleveraging during distress.
Balance financial and strategic objectives. Pure optimization of leverage ratios may sacrifice long-term competitive position and value creation capacity.
Recognize macroeconomic context. Individual deleveraging improves personal financial health, but widespread deleveraging creates economic headwinds affecting everyone.
Monitor, measure, adjust. Successful deleveraging requires clear metrics, regular assessment, and tactical flexibility as conditions evolve.
Understand the trade-offs. Deleveraging sacrifices the amplified returns of leverage for reduced risk and improved stability—a trade-off that becomes increasingly attractive as debt levels rise.
For investors, understanding deleveraging dynamics provides insight into corporate financial health, economic cycles, and risk management. Companies successfully executing deleveraging programs often emerge stronger and more resilient.
For individuals, applying deleveraging principles to personal finances builds wealth through reduced interest expense, improved credit access, and decreased financial stress.
The path from overleveraged fragility to conservative stability requires discipline, strategy, and time. But the math is clear: reducing debt reduces risk, improves financial flexibility, and creates a sustainable foundation for long-term prosperity.
Next Steps: Applying Deleveraging Principles
Assess your current leverage position using debt-to-equity, debt-to-income, and interest coverage metrics
Identify which deleveraging strategy best fits your circumstances—cash flow allocation, asset sales, expenditure cuts, or combinations
Create a specific plan with target ratios, timeline, and concrete action steps
Monitor progress monthly and adjust tactics based on results and changing conditions
Balance deleveraging with other financial priorities to maintain a sustainable approach
The journey from excessive leverage to financial stability follows mathematical principles. Understanding and applying these principles transforms abstract concepts into concrete financial improvement.
References
[1] McKinsey Global Institute. (2012). “Debt and deleveraging: Uneven progress on the growth path.” McKinsey & Company.
[2] Federal Reserve Board. (2010). “The Supervisory Capital Assessment Program: Overview of Results.” Board of Governors of the Federal Reserve System.
Author Bio
Max Fonji is the founder of The Rich Guy Math, a data-driven financial education platform that explains the mathematical principles behind wealth building, investing, and risk management. With expertise in economic analysis and valuation, Max translates complex financial concepts into clear, evidence-based guidance for investors seeking to understand how money truly works. His approach combines rigorous quantitative analysis with accessible teaching to foster financial literacy through the use of numbers, logic, and proven principles.
Educational Disclaimer
This article provides educational information about deleveraging concepts, strategies, and financial principles. It does not constitute financial, investment, tax, or legal advice. Financial decisions should be based on individual circumstances, risk tolerance, and professional consultation. Deleveraging strategies carry varying risks and suitability depending on specific situations. Past performance and historical examples do not guarantee future results. Readers should conduct thorough research and consult qualified financial professionals before making significant financial decisions. The Rich Guy Math and its authors assume no liability for financial decisions made based on this educational content.
Frequently Asked Questions About Deleveraging
What is deleveraging in simple terms?
Deleveraging is the process of reducing the total amount of debt you owe. For companies, this means lowering the debt-to-equity ratio by paying down loans, selling assets, or raising new equity capital. For individuals, it means paying off mortgages, credit cards, student loans, or other borrowed money to improve financial stability and reduce risk.
How is deleveraging different from refinancing?
Deleveraging reduces the absolute dollar amount of debt you owe, while refinancing restructures existing debt without changing the principal balance. Paying $300,000 down to $250,000 is deleveraging; refinancing that same $300,000 simply changes loan terms. Both improve financial position, but in different ways.
What are the main strategies for deleveraging?
The four main deleveraging strategies are: (1) using income or cash flow to pay down principal, (2) selling assets to retire debt, (3) raising equity capital to pay off obligations, and (4) cutting expenditures to redirect cash toward debt reduction. Most effective deleveraging uses a combination of these approaches.
Why does deleveraging sometimes hurt the economy?
When many households, companies, and banks deleverage at the same time, borrowing and spending drop sharply. Lower consumption and investment slow economic activity, sometimes causing a self-reinforcing downturn known as the deleveraging paradox, where economic weakness forces even more deleveraging.
How long does deleveraging typically take?
Timelines vary widely. Individuals may deleverage in 2–3 years; companies often take 3–7 years; and economies deleveraging after major crises typically take 6–7 years. In extreme cases, such as Japan in the 1990s, deleveraging can last decades.
What financial ratios measure deleveraging progress?
Key metrics include debt-to-equity ratio, debt-to-asset ratio, debt-to-EBITDA, and interest coverage ratio. Falling leverage ratios and rising interest coverage indicate successful deleveraging and improving financial strength.
Can deleveraging ever be bad for a company or individual?
Yes. Aggressive deleveraging can weaken long-term performance if essential investments are cut. Individuals who adopt extreme austerity may not sustain it. The best deleveraging balances debt reduction with maintaining operational or lifestyle stability.
What happens if deleveraging fails?
If voluntary deleveraging fails, consequences can include covenant violations, payment default, credit downgrades, or bankruptcy. These outcomes destroy value and limit future financial options, making proactive deleveraging essential.
Related posts:
 What Is SmartPass? Raptor Digital Hall Pass Explained for K-12 Schools
 What Is the 3x Rent Rule & How to Calculate It (With Examples)
 Portfolio Income: Definition, Examples, Tax Rules, and Strategies
 Bookkeeping vs Accounting: What’s the Difference & Which Do You Need?
 What Is Profitability Analysis & How to Do It: Metrics, Example & Tips
 Emergency Fund vs Savings: What’s the Real Difference and Why It Matters