Imagine standing at a crossroads with two investment paths ahead of you. One promises steady, reliable growth. The other dangles the possibility of explosive gains, but also the risk of significant losses. How do you choose? The answer lies in understanding expected return, the single most important number that separates hopeful investing from strategic wealth-building.
In simple terms, expected return is the anticipated profit or loss an investor can expect from an investment over a specific period, based on historical data, probabilities, and market conditions. It’s the compass that guides every smart investment decision, from choosing individual stocks to building a diversified portfolio. Investopedia
Whether you’re just starting your investment journey or looking to refine your strategy, mastering expected return calculations will transform how you evaluate opportunities and manage risk. This guide breaks down everything you need to know, from basic formulas to real-world applications, in plain English that anyone can understand.
TL;DR Summary
Expected return is the weighted average of all possible returns an investment might generate, calculated using probabilities and potential outcomes.
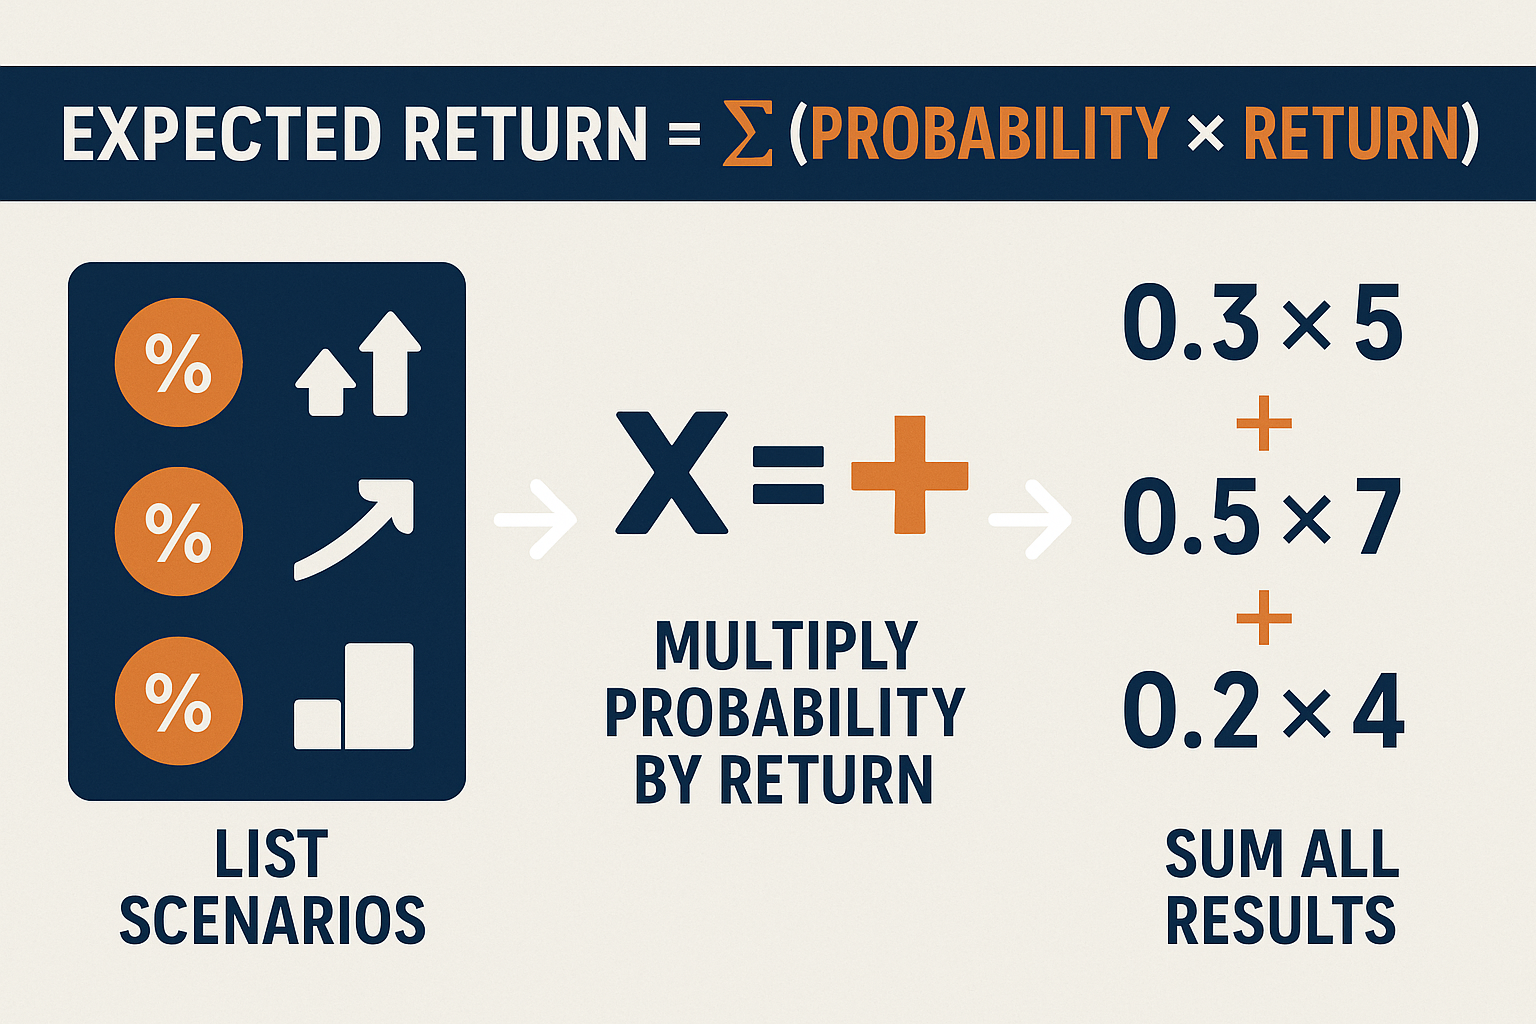
The basic formula is: Expected Return = Σ (Probability × Return), where you multiply each possible return by its probability and sum the results.
Investors use expected return to compare different investment options, build portfolios, and make data-driven decisions rather than emotional ones.
Higher expected returns typically come with higher risk; understanding this tradeoff is essential for successful long-term investing.
Expected return is a forward-looking estimate, not a guarantee; actual results will vary based on market conditions and unforeseen events.
What Is Expected Return?
Expected return represents the mean value of the probability distribution of possible returns on an investment. Think of it as your best educated guess about what an investment will earn, based on analyzing all the potential scenarios and their likelihood of occurring.
Unlike a simple average of past returns, expected return accounts for the probability of different outcomes. This makes it far more useful for decision-making because it acknowledges that not all scenarios are equally likely to happen.
Why Expected Return Matters
For investors, expected return serves several critical functions:
- Comparison tool: Evaluate multiple investment opportunities side-by-side
- Portfolio construction: Allocate capital efficiently across different assets
- Risk assessment: Understand potential rewards relative to risks taken
- Goal setting: Determine if an investment aligns with your financial objectives
- Performance benchmark: Measure actual results against predictions
According to the CFA Institute, expected return forms the foundation of Modern Portfolio Theory, developed by Nobel laureate Harry Markowitz. This framework has shaped how both individual and institutional investors approach portfolio management since the 1950s.
“Expected return is not about predicting the future with certainty; it’s about making probabilistic assessments that improve your odds of investment success.” Modern Portfolio Theory
The Expected Return Formula
The mathematical formula for expected return is surprisingly straightforward:
Expected Return (ER) = Σ (Pᵢ × Rᵢ)
Where:
- Σ = Sum of all scenarios
- Pᵢ = Probability of scenario i occurring
- Rᵢ = Return in scenario i
How to Calculate Expected Return Step-by-Step
Let’s break this down into manageable steps:
Step 1: Identify all possible scenarios or outcomes for your investment
Step 2: Assign a probability to each scenario (all probabilities must sum to 100% or 1.0)
Step 3: Determine the expected return for each scenario
Step 4: Multiply each scenario’s probability by its return
Step 5: Add all the results together to get your expected return
Simple Example: Coin Flip Investment
Imagine an investment based on a coin flip:
- Heads (50% probability): You gain $100 (100% return)
- Tails (50% probability): You lose $50 (-50% return)
Expected Return = (0.50 × 100%) + (0.50 × -50%) = 50% – 25% = 25%
Even though you might lose money in any single flip, the expected return over many trials is positive 25%.
Realistic Stock Market Example
Let’s examine a more practical scenario with a stock investment:
| Economic Scenario | Probability | Expected Return |
|---|---|---|
| Strong Growth | 25% | +30% |
| Moderate Growth | 50% | +10% |
| Recession | 20% | -15% |
| Severe Recession | 5% | -40% |
Calculation:
- Strong Growth: 0.25 × 30% = 7.5%
- Moderate Growth: 0.50 × 10% = 5.0%
- Recession: 0.20 × -15% = -3.0%
- Severe Recession: 0.05 × -40% = -2.0%
Expected Return = 7.5% + 5.0% – 3.0% – 2.0% = 7.5%
This stock has an expected return of 7.5%, but notice how the actual outcome could range from +30% to -40%. This spread illustrates the concept of risk or volatility around the expected return. Financial Dictionary
Expected Return vs Historical Returns: Understanding the Difference
Many beginner investors confuse expected return with historical average returns, but they’re fundamentally different concepts.
Historical Average Return
This simply takes past performance and calculates the mean:
Historical Average = Sum of Past Returns ÷ Number of Periods
For example, if a stock returned 10%, 15%, -5%, and 20% over four years:
Historical Average = (10 + 15 – 5 + 20) ÷ 4 = 10%
Expected Return (Forward-Looking)
Expected return uses historical data as a guide, but adjusts for:
- Current market conditions
- Changed company fundamentals
- Economic outlook
- Probability-weighted scenarios
As the SEC emphasizes in investor education materials: “Past performance does not guarantee future results.” Historical returns tell you what happened; expected returns help you estimate what might happen next.
When to Use Each Metric
Use Historical Returns when:
- Analyzing past performance
- Comparing actual results to benchmarks
- Studying market behavior patterns
Use Expected Returns when:
- Making forward-looking investment decisions
- Building portfolios
- Comparing future investment opportunities
- Setting realistic return expectations
How Investors Use Expected Return in Real-World Decisions
Understanding the theory is one thing; applying it is where the magic happens. Here’s how savvy investors put expected return calculations to work:
1. Comparing Investment Opportunities
Sarah has $10,000 to invest and is considering three options:
Option A (Corporate Bonds): Expected Return = 4%
Option B (Dividend Stocks): Expected Return = 8%
Option C (Growth Stocks): Expected Return = 12%
At first glance, Option C looks best. But Sarah also needs to consider:
- Her risk tolerance
- Time horizon
- The volatility (standard deviation) of returns
- Tax implications
This is where expected return works alongside other metrics. Option C might have higher expected returns but also higher risk, which might not suit Sarah’s conservative investment profile.
For investors interested in steady income, understanding how to start earning passive income through dividend investing can help balance growth and stability.
2. Portfolio Optimization
Expected return plays a central role in building diversified portfolios. The goal is to maximize expected return for a given level of risk, or minimize risk for a desired return level.
Modern Portfolio Theory suggests combining assets with different expected returns and correlations to achieve optimal risk-adjusted returns. For instance:
- 60% stocks (Expected Return: 10%, High Risk)
- 30% bonds (Expected Return: 4%, Low Risk)
- 10% real estate (Expected Return: 7%, Moderate Risk)
Portfolio Expected Return = (0.60 × 10%) + (0.30 × 4%) + (0.10 × 7%) = 6% + 1.2% + 0.7% = 7.9%
This portfolio balances growth potential with stability—a strategy that has helped countless investors weather market emotional cycles successfully.
3. Evaluating Risk-Adjusted Returns
Expected return alone doesn’t tell the whole story. Two investments might have the same expected return but vastly different risk profiles.
This is where the Sharpe Ratio comes in:
Sharpe Ratio = (Expected Return – Risk-Free Rate) ÷ Standard Deviation
A higher Sharpe Ratio indicates better risk-adjusted returns. According to Morningstar, this metric helps investors understand how much extra return they’re receiving for the additional volatility they endure.
4. Setting Realistic Financial Goals
Expected return calculations help answer crucial questions:
- “Can I retire at 55 with my current savings rate?”
- “Will my portfolio generate enough income to cover expenses?”
- “How long until I reach my $1 million goal?”
For parents planning, understanding expected returns is essential when learning how to make your kid a millionaire through strategic investing.
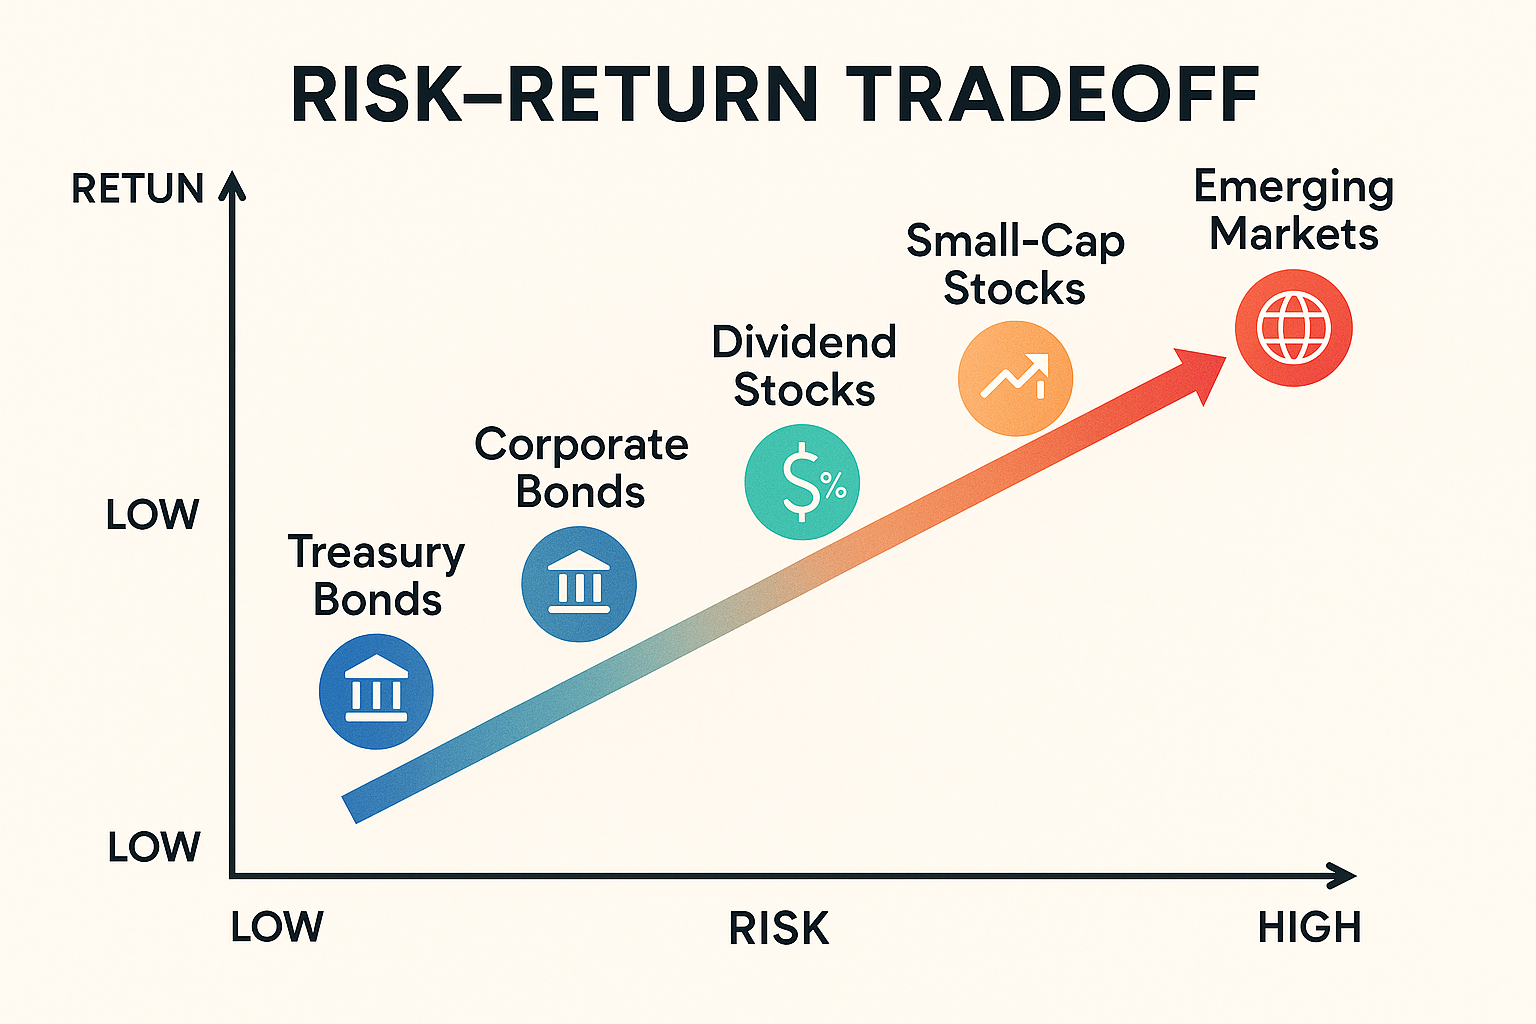
The Relationship Between Expected Return and Risk
Here’s a fundamental truth about investing: higher expected returns generally require accepting higher risk. This relationship is so important it has its own name, the risk-return tradeoff.
Understanding Investment Risk
Risk in investing refers to the uncertainty of returns and the possibility of losing money. It’s typically measured by:
- Standard Deviation: How much returns fluctuate around the average
- Beta: How much an investment moves relative to the overall market
- Maximum Drawdown: The largest peak-to-trough decline
The Risk Spectrum
| Asset Class | Typical Expected Return | Risk Level |
|---|---|---|
| U.S. Treasury Bonds | 3-4% | Very Low |
| Investment-Grade Corporate Bonds | 4-6% | Low |
| Dividend Stocks | 7-9% | Moderate |
| Large-Cap Stocks | 9-11% | Moderate-High |
| Small-Cap Stocks | 11-14% | High |
| Emerging Markets | 12-16% | Very High |
These ranges come from historical data compiled by sources like Morningstar and the Federal Reserve, though actual returns vary significantly over different time periods.
Why This Tradeoff Exists
The risk-return relationship exists because:
- Compensation for uncertainty: Investors demand higher potential returns to accept greater uncertainty
- Market efficiency: If low-risk investments offered high returns, everyone would buy them, driving prices up and returns down
- Economic reality: Higher-risk ventures (like startups) must promise greater rewards to attract capital
Many investors lose money not because they took risks, but because they didn’t understand the risks they were taking. Learning why people lose money in the stock market can help you avoid common pitfalls.
Advanced Expected Return Calculations
Once you’ve mastered the basics, you can explore more sophisticated approaches to calculating expected return.
Capital Asset Pricing Model (CAPM)
The CAPM provides a formula for calculating expected return based on systematic risk:
Expected Return = Risk-Free Rate + Beta × (Market Return – Risk-Free Rate)
Where:
- Risk-Free Rate = Return on government bonds (typically 10-year Treasury)
- Beta = Measure of a stock’s volatility relative to the market
- Market Return = Expected return of the overall stock market
CAPM Example
Let’s calculate the expected return for a stock with these characteristics:
- Risk-Free Rate: 3%
- Stock Beta: 1.5
- Expected Market Return: 10%
Expected Return = 3% + 1.5 × (10% – 3%)
Expected Return = 3% + 1.5 × 7%
Expected Return = 3% + 10.5% = 13.5%
This stock’s higher beta (1.5) means it’s 50% more volatile than the market, so investors expect a higher return (13.5%) to compensate for that additional risk.
Dividend Discount Model (DDM)
For dividend-paying stocks, the DDM calculates expected return based on future dividend payments:
Expected Return = (Next Year’s Dividend ÷ Current Price) + Dividend Growth Rate
DDM Example
A stock trading at $100 is expected to pay a $3 dividend next year, with dividends growing at 5% annually:
Expected Return = ($3 ÷ $100) + 5% = 3% + 5% = 8%
This approach works particularly well for analyzing high dividend stocks with stable, predictable payouts.
Multi-Factor Models
Professional investors often use multi-factor models that consider:
- Company size (market capitalization)
- Value vs. growth characteristics
- Momentum
- Quality metrics
- Profitability
The Fama-French Three-Factor Model is one popular framework that extends beyond simple CAPM calculations.
Common Mistakes When Calculating Expected Return
Even experienced investors sometimes stumble when working with expected returns. Here are the most frequent errors and how to avoid them:
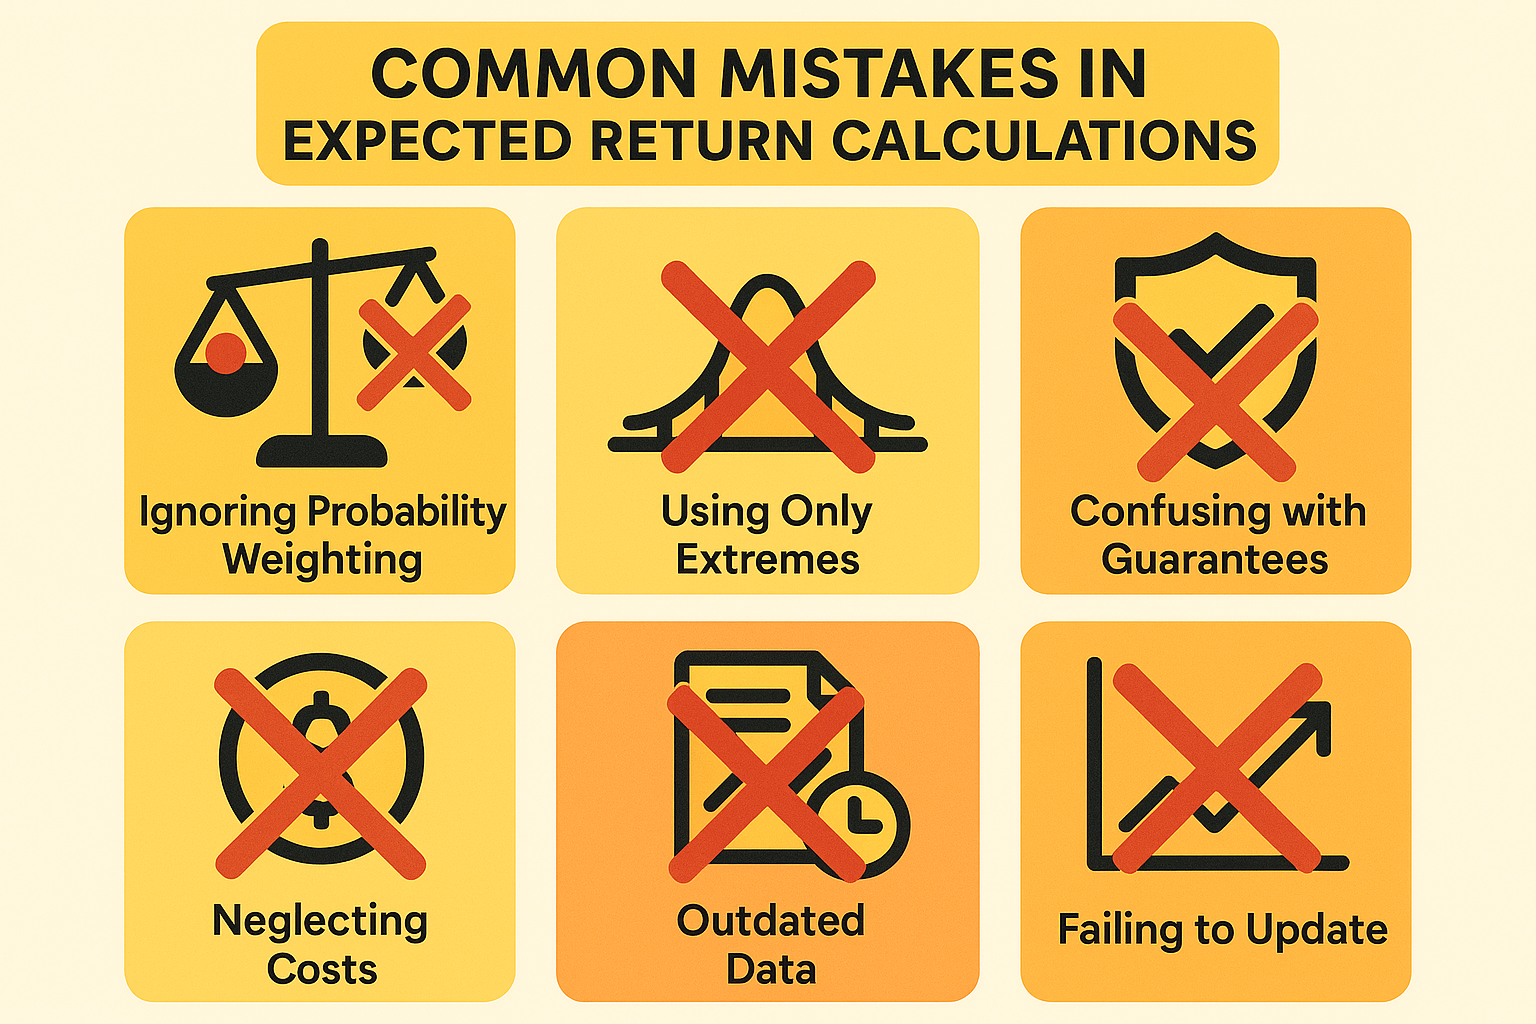
1: Ignoring Probability Weighting
Wrong approach: Simply averaging all possible outcomes
Right approach: Weighting each outcome by its probability
If you have five scenarios but one is much more likely than the others, it should have a bigger impact on your expected return calculation.
2: Using Only Best-Case and Worst-Case Scenarios
Wrong approach: Only considering extreme outcomes
Right approach: Including a full range of realistic scenarios
Most of the time, investments deliver somewhere in the middle. Focusing only on extremes gives a distorted picture.
3: Confusing Expected Return with Guaranteed Return
Wrong approach: Treating expected return as a promise
Right approach: Understanding it’s a probability-weighted estimate
An 8% expected return doesn’t mean you’ll earn exactly 8%. Actual results will vary—sometimes significantly.
4: Neglecting Costs and Taxes
Wrong approach: Calculating returns before expenses
Right approach: Factoring in fees, commissions, and tax implications
A 10% expected return becomes 8.5% after a 1% management fee and 0.5% in trading costs. Taxes can reduce it further.
5: Using Outdated Historical Data
Wrong approach: Relying on 30-year-old market conditions
Right approach: Adjusting for current economic realities
The market environment of the 1990s differs substantially from today’s landscape. Interest rates, inflation expectations, and market structure have all changed.
6: Failing to Update Probabilities
Wrong approach: Setting probabilities once and never revisiting them
Right approach: Regularly updating your assumptions as conditions change
Economic forecasts, company performance, and market sentiment all evolve. Your expected return calculations should evolve, too.
Understanding why the stock market goes up over time can help you set more realistic probability assumptions for different scenarios.
Expected Return in Different Asset Classes
Expected return calculations vary across investment types. Let’s explore how to approach different asset classes:
Stocks (Equities)
Calculation methods:
- Historical average returns adjusted for current valuations
- CAPM based on beta
- Dividend Discount Model for dividend payers
- Analyst consensus estimates
Typical expected returns (2025): 8-12% annually for diversified portfolios
Key factors affecting expected return:
- Economic growth prospects
- Corporate earnings trends
- Interest rate environment
- Market valuation levels (P/E ratios)
Understanding how the stock market works provides crucial context for setting realistic equity return expectations.
Bonds (Fixed Income)
Calculation methods:
- Yield to Maturity (YTM) for individual bonds
- Current yield plus expected price appreciation
- Credit spread analysis for corporate bonds
Typical expected returns (2025): 3-6% annually, depending on credit quality and duration
Key factors affecting expected return:
- Interest rate direction
- Credit quality of the issuer
- Time to maturity
- Inflation expectations
Real Estate
Calculation methods:
- Cap rate (Net Operating Income ÷ Property Value)
- Total return = Rental yield + Property appreciation
- REIT dividend yield + growth rate
Typical expected returns (2025): 6-10% annually for diversified real estate exposure
Key factors affecting expected return:
- Location and property type
- Rental market conditions
- Property management quality
- Economic growth in the area
Alternative Investments
Categories include:
- Private equity
- Hedge funds
- Commodities
- Cryptocurrency
- Collectibles
Expected returns: Highly variable, ranging from -50% to +100%+ in extreme cases
Important note: Alternative investments often have less reliable historical data, making expected return calculations more speculative. They’re generally suitable only for sophisticated investors who understand the unique risks involved.
Building a Portfolio Using Expected Return
Now let’s put everything together and see how expected return guides portfolio construction.
Step 1: Define Your Investment Goals
Before calculating anything, clarify:
- Time horizon: When will you need this money?
- Return target: What return do you need to achieve your goals?
- Risk tolerance: How much volatility can you handle emotionally and financially?
Step 2: Determine Asset Allocation
Based on your goals, decide what percentage to allocate to different asset classes.
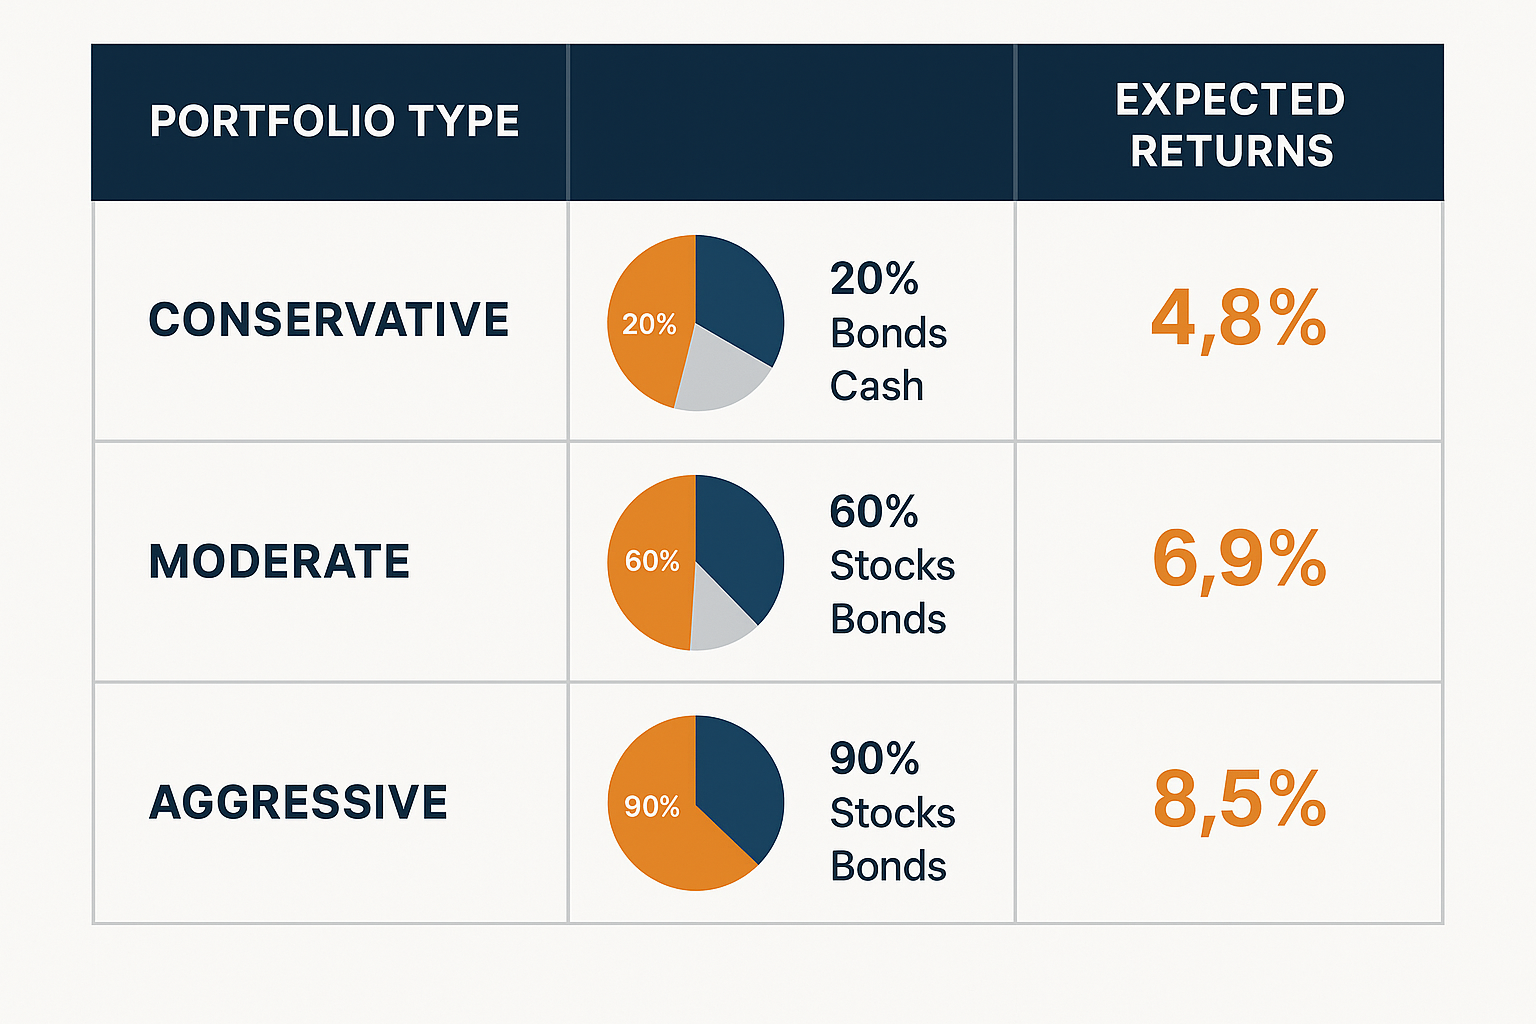
Conservative Portfolio (Low Risk, Lower Return):
- 20% Stocks (Expected Return: 9%)
- 70% Bonds (Expected Return: 4%)
- 10% Cash (Expected Return: 2%)
Portfolio Expected Return = (0.20 × 9%) + (0.70 × 4%) + (0.10 × 2%) = 1.8% + 2.8% + 0.2% = 4.8%
Moderate Portfolio (Balanced Risk/Return):
- 60% Stocks (Expected Return: 9%)
- 35% Bonds (Expected Return: 4%)
- 5% Cash (Expected Return: 2%)
Portfolio Expected Return = (0.60 × 9%) + (0.35 × 4%) + (0.05 × 2%) = 5.4% + 1.4% + 0.1% = 6.9%
Aggressive Portfolio (Higher Risk, Higher Return):
- 90% Stocks (Expected Return: 9%)
- 10% Bonds (Expected Return: 4%)
- 0% Cash
Portfolio Expected Return = (0.90 × 9%) + (0.10 × 4%) = 8.1% + 0.4% = 8.5%
Step 3: Select Specific Investments
Within each asset class, choose individual securities or funds based on:
- Expected returns relative to risk
- Correlation with other holdings
- Costs and tax efficiency
- Your conviction in the investment thesis
Exploring smart ways to make passive income can help diversify your return sources beyond traditional stocks and bonds.
Step 4: Monitor and Rebalance
Expected returns change as market conditions evolve. Review your portfolio regularly (quarterly or annually) and:
- Recalculate expected returns based on current data
- Rebalance back to target allocations
- Adjust strategy if your goals or circumstances change
The Limitations of Expected Return
While expected return is incredibly useful, it’s not perfect. Understanding its limitations helps you use it more effectively:
1: Garbage In, Garbage Out
Expected return calculations are only as good as your inputs. If your probability estimates or return scenarios are unrealistic, your expected return will be too.
Solution: Use multiple methods, seek diverse perspectives, and remain humble about forecasting ability.
2: Doesn’t Capture Tail Risk
Standard expected return calculations can underestimate the probability and impact of extreme events (market crashes, financial crises).
Solution: Conduct stress tests and scenario analysis for worst-case outcomes. Don’t just focus on the average.
3: Assumes Rational Markets
Expected return models often assume markets are efficient and rational. In reality, market emotions drive significant short-term price movements.
Solution: Maintain a long-term perspective and don’t panic when actual returns deviate from expectations.
4: Static vs. Dynamic Reality
Most expected return calculations are static snapshots. The real world is dynamic; probabilities and outcomes shift constantly.
Solution: Treat expected return as a starting point, not a final answer. Update your assumptions regularly.
5: Ignores Behavioral Factors
Expected return assumes you’ll stick to your plan. In reality, fear and greed often cause investors to buy high and sell low.
Solution: Build a strategy you can actually follow through both bull and bear markets. The best expected return means nothing if you abandon ship at the first sign of trouble.
Expected Return and Your Investment Strategy
So how do you actually incorporate expected return into your day-to-day investment decisions? Here are practical applications:
For Stock Selection
When evaluating individual stocks:
- Calculate expected return using CAPM or analyst estimates
- Compare to the required return based on your risk tolerance
- Look for positive “alpha” (expected return exceeding what the risk level justifies)
- Consider qualitative factors that might not be captured in quantitative models
For Portfolio Rebalancing
Expected return helps you decide when to rebalance:
- If one asset class becomes overvalued, its expected return falls
- Lower expected returns signal it’s time to trim that position
- Shift capital to undervalued assets with higher expected returns
For Retirement Planning
Use expected return to:
- Project portfolio growth over your working years
- Estimate sustainable withdrawal rates in retirement
- Determine the required savings rate to meet your goals
- Stress test plans against lower-than-expected returns
For Risk Management
Expected return informs risk decisions:
- Position sizing: Allocate more to higher expected return opportunities (within risk limits)
- Stop-loss levels: Set based on expected return vs. potential loss
- Diversification: Combine assets with different expected returns and correlations
Making smart moves with your money means thinking probabilistically, not emotionally.
Real-World Case Study: Applying Expected Return
Let’s follow Jake, a 35-year-old software engineer, as he uses expected return to make an investment decision.
Jake’s Situation
- Current savings: $50,000
- Investment timeline: 25 years until retirement
- Goal: Maximize growth while managing risk
- Options under consideration:
- Index fund tracking the S&P 500
- Dividend-focused portfolio
- Aggressive small-cap growth fund
Step 1: Calculate Expected Returns
S&P 500 Index Fund:
- Historical return: 10% annually
- Current market valuation: Slightly above average
- Jake’s expected return estimate: 8%
- Risk (standard deviation): 15%
Dividend Portfolio:
- Dividend yield: 3.5%
- Expected dividend growth: 4% annually
- Expected return: 3.5% + 4% = 7.5%
- Risk (standard deviation): 12%
Small-Cap Growth Fund:
- Historical return: 12% annually
- Higher volatility in the current market
- Jake’s expected return estimate: 10%
- Risk (standard deviation): 22%
Step 2: Project Long-Term Outcomes
Using the formula: Future Value = Present Value × (1 + Return)^Years
S&P 500 Index Fund:
$50,000 × (1.08)^25 = $342,316
Dividend Portfolio:
$50,000 × (1.075)^25 = $310,594
Small-Cap Growth Fund:
$50,000 × (1.10)^25 = $541,735
Step 3: Consider Risk-Adjusted Returns
The small-cap fund has the highest expected return, but also the highest risk. Jake calculates the Sharpe Ratio (assuming a 3% risk-free rate):
S&P 500: (8% – 3%) ÷ 15% = 0.33
Dividend Portfolio: (7.5% – 3%) ÷ 12% = 0.38
Small-Cap Growth: (10% – 3%) ÷ 22% = 0.32
Interestingly, the dividend portfolio has the best risk-adjusted return!
Step 4: Jake’s Decision
Jake decides to split his investment:
- 60% S&P 500 Index Fund (balance of growth and stability)
- 30% Dividend Portfolio (best risk-adjusted returns, income potential)
- 10% Small-Cap Growth (small allocation to the highest growth potential)
Portfolio Expected Return = (0.60 × 8%) + (0.30 × 7.5%) + (0.10 × 10%) = 4.8% + 2.25% + 1.0% = 8.05%
Projected 25-year value: $50,000 × (1.0805)^25 = $348,921
This diversified approach gives Jake exposure to multiple return sources while managing overall portfolio risk, a perfect example of expected return in action.
Frequently Asked Questions About Expected Return
A “good” expected return depends on your risk tolerance and time horizon. Generally:
Conservative investors: 4-6% annually
Moderate investors: 6-8% annually
Aggressive investors: 8-12% annually
These ranges reflect typical long-term expectations for diversified portfolios. Remember, higher expected returns require accepting higher risk
For individual stocks, you can calculate expected return using:
Probability-weighted scenarios: Multiply each possible return by its probability and sum the results
CAPM formula: Risk-Free Rate + Beta × (Market Return – Risk-Free Rate)
Dividend Discount Model: (Next Dividend ÷ Current Price) + Dividend Growth Rate
The best method depends on the stock type and available data
No. Average return is a simple mean of past returns. Expected return is a probability-weighted estimate of future returns. Expected return uses historical data as a guide but adjusts for current conditions and the likelihood of different scenarios.
Yes, absolutely. If the probability-weighted scenarios indicate more downside than upside, the expected return will be negative. This signals an investment that’s likely to lose money and should generally be avoided (unless you have specific reasons for holding it, such as portfolio diversification benefits).
For most investors, reviewing and recalculating expected returns on a quarterly or semi-annual basis is sufficient. However, you should recalculate immediately if:
Major market events occur
Company fundamentals change significantly
Economic outlook shifts dramatically
Your personal financial situation changes
Expected return is what you estimate an investment will deliver. Required return is the minimum return you need to justify the risk you’re taking. You should only invest when expected return exceeds required return; this difference is called “alpha.”
Standard expected return calculations are usually in nominal terms (not adjusted for inflation). To get the real expected return, subtract expected inflation:
Real Return = Nominal Return – Inflation
For example, an 8% nominal expected return with 3% inflation equals a 5% real expected return.
Expected return is one of two key inputs for portfolio diversification (the other being correlation). By combining assets with different expected returns and low correlation, you can build portfolios that maximize expected return for a given risk level, the core principle of Modern Portfolio Theory.
Tools and Resources for Calculating Expected Return
Want to calculate expected returns for your own investments? Here are helpful resources:
Online Calculators
- Morningstar: Provides expected return estimates for mutual funds and ETFs
- Portfolio Visualizer: Allows you to model different asset allocations and expected returns
- FINRA Fund Analyzer: Helps compare fund costs and returns
Educational Resources
- Investopedia: Comprehensive articles on expected return and related concepts
- CFA Institute: Professional-level materials on portfolio management
- SEC Investor Education: Government resources on investment basics
Investment Apps
Many modern investment platforms include expected return projections:
- Robo-advisors typically show projected portfolio growth
- Brokerage research tools often provide analyst expected return estimates
- Financial planning software models future returns based on historical data
Recommended Reading
- “A Random Walk Down Wall Street” by Burton Malkiel
- “The Intelligent Investor” by Benjamin Graham
- “Common Sense on Mutual Funds” by John Bogle
These classics provide context for understanding expected returns within broader investment philosophy.
Conclusion: Putting Expected Return to Work
Expected return isn’t just an abstract mathematical concept; it’s a practical tool that transforms how you approach investing. By understanding how to calculate and interpret expected return, you’ve gained a powerful advantage in building wealth.
Here’s what we’ve covered:
Expected return represents the probability-weighted average of potential investment outcomes
The basic formula—Σ (Probability × Return)—applies across all investment types
Higher expected returns generally come with higher risk, creating the fundamental risk-return tradeoff
Multiple calculation methods exist, from simple scenario analysis to sophisticated models like CAPM
Expected return guides critical decisions: asset allocation, stock selection, portfolio rebalancing, and retirement planning
Understanding limitations prevents overconfidence and improves decision-making
Your Next Steps
Ready to apply the expected return in your own investment journey? Here’s what to do:
- Calculate expected returns for your current investments using the methods outlined in this guide
- Assess your portfolio to see if your actual allocation matches your risk tolerance and return goals
- Set realistic expectations for long-term performance based on probability-weighted scenarios, not best-case fantasies
- Build a diversified strategy that balances expected return with acceptable risk levels
- Review and adjust regularly as market conditions and your personal circumstances evolve
- Keep learning about portfolio management, risk assessment, and investment strategy
Remember: expected return is a tool for better decision-making, not a crystal ball. Markets will always surprise us. The goal isn’t to predict the future perfectly—it’s to make probabilistic assessments that improve your odds of investment success over time.
The difference between investors who build lasting wealth and those who don’t often comes down to one thing: disciplined, data-driven decision-making. Expected return calculations provide the framework for that discipline.
Start small, stay consistent, and let the power of expected return guide you toward your financial goals. The journey of a thousand miles, and a million dollars, begins with a single, well-calculated step.
Disclaimer: This article is for educational purposes only and does not constitute financial advice. Expected return calculations involve assumptions and estimates that may not reflect actual future performance. Investment returns are not guaranteed, and you may lose money. Consult with a qualified financial advisor before making investment decisions. Past performance does not guarantee future results.
Written by Max Fonji — With a decade of experience in financial analysis and investing education, Max has helped thousands of readers understand complex financial concepts through clear, actionable guidance. As the founder of TheRichGuyMath.com, Max’s mission is to democratize financial knowledge and help everyday people build lasting wealth through informed decision-making
Interactive Expected Return Calculator
📊 Expected Return Calculator
Calculate the probability-weighted expected return for your investment by entering different scenarios and their likelihood