Picture this: You’re running a lemonade stand on a hot summer day. You sell 50 cups at $2 each, making $100. But wait, you spent $30 on lemons, sugar, and cups. That $70 difference? That’s your gross profit, and it’s one of the most important numbers in business and investing. Whether you’re analyzing high dividend stocks or evaluating your own side hustle, understanding gross profit is your ticket to smarter financial decisions.
Gross profit isn’t just accounting jargon; it’s the heartbeat of every profitable business. It tells you whether a company can actually make money from what it sells, before all the other bills come due. And here’s the kicker: many beginner investors skip right over this metric, focusing only on net profit or revenue, and miss critical warning signs hiding in plain sight.
In this comprehensive guide, we’ll break down everything you need to know about gross profit, from the basic definition to advanced analysis techniques that professional investors use every day. By the end, you’ll be able to read financial statements like a pro and make smarter investment decisions.
Key Takeaways
Gross profit is the money left after subtracting the direct costs of producing goods from total revenue; it shows if a business model is fundamentally profitable
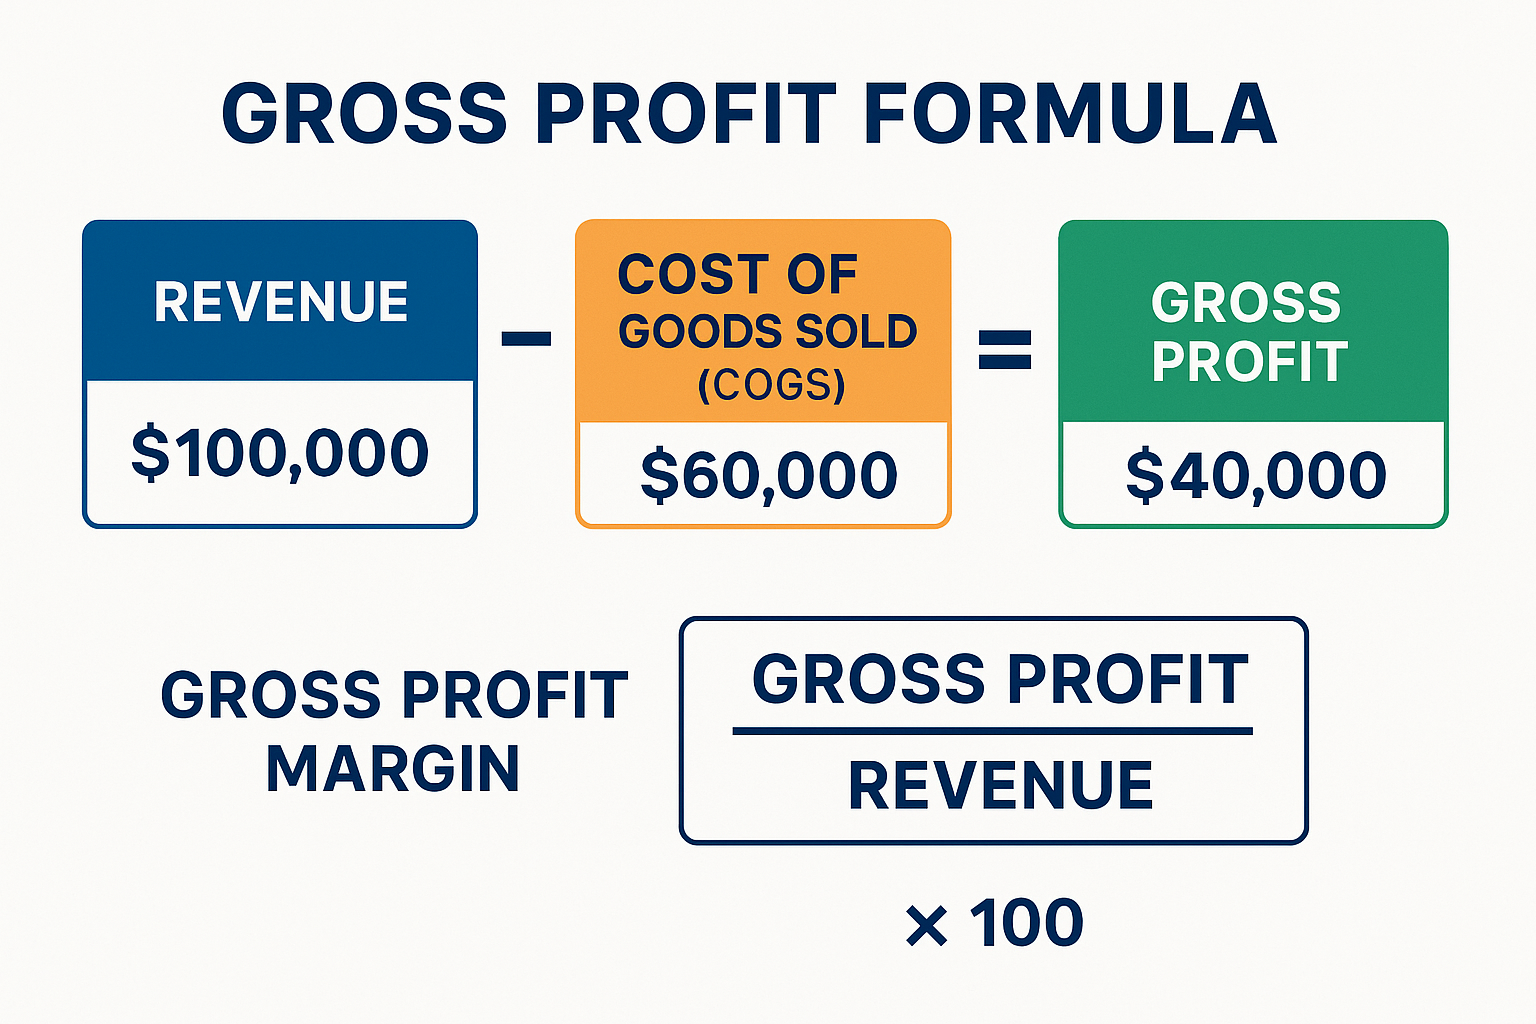
The gross profit formula is simple: Revenue minus Cost of Goods Sold (COGS) = Gross Profit
Gross profit margin (expressed as a percentage) reveals how efficiently a company converts sales into profit and allows for easy comparison across companies
Higher gross margins typically indicate stronger pricing power, better efficiency, or competitive advantages that protect profitability
Understanding gross profit helps investors identify quality companies and avoid businesses with unsustainable economics
What is Gross Profit? The Foundation of Business Profitability
Gross profit is the profit a company makes after deducting the costs directly associated with producing and selling its products or services. Think of it as the “first level” of profitability, before paying for marketing, rent, salaries, taxes, and all those other expenses.
Here’s a simple way to understand it: Gross profit answers the question, “Does this business make money on each sale, or does it lose money every time someone buys something?”
Why Gross Profit Matters
Gross profit is crucial because it reveals the fundamental health of a business model. A company can have impressive revenue numbers, but if its gross profit is razor-thin or negative, that business is in trouble.
Consider two companies, both with $10 million in revenue:
- Company A has a gross profit of $7 million (70% margin)
- Company B has a gross profit of $1 million (10% margin)
Which one would you rather own? Company A has much more cushion to cover operating expenses, invest in growth, and weather economic storms. Company B is walking a tightrope; one small increase in production costs could wipe out profitability entirely.
When you’re learning why you should invest, understanding these fundamental metrics becomes essential for picking winners.
The Gross Profit Formula: Simple Math, Powerful Insights
The gross profit formula is beautifully straightforward:
Gross Profit = Revenue – Cost of Goods Sold (COGS)
Let’s break down each component:
Revenue (Sales)
Revenue is the total money coming in from selling products or services. If you sell 1,000 widgets at $50 each, your revenue is $50,000. Simple enough!
Cost of Goods Sold (COGS)
COGS includes all the direct costs of producing what you sell:
- Raw materials
- Manufacturing labor
- Packaging
- Shipping costs are directly tied to products
- Manufacturing overhead
What COGS does NOT include:
- Marketing and advertising
- Administrative salaries
- Rent for office space
- Research and development
- Interest on loans
- Taxes
Real-World Example: Coffee Shop Edition
Sarah owns a coffee shop. In January:
- Revenue: $25,000 (from selling coffee, pastries, etc.)
- COGS: $8,000 (coffee beans, milk, cups, pastries from supplier)
Gross Profit = $25,000 – $8,000 = $17,000
That $17,000 is what Sarah has left to pay rent, employees, utilities, and hopefully take home some profit. If her gross profit were only $2,000, she’d be in serious trouble, even before paying a single bill.
Gross Profit Margin: The Percentage That Tells the Real Story
While gross profit gives you a dollar amount, gross profit margin expresses profitability as a percentage, making it easier to compare companies of different sizes.
Gross Profit Margin Formula
Gross Profit Margin = (Gross Profit ÷ Revenue) × 100
Or, combining with the previous formula:
Gross Profit Margin = [(Revenue – COGS) ÷ Revenue] × 100
Why Percentages Matter
A $1 million gross profit sounds impressive, but is it?
- If revenue was $2 million, that’s a 50% margin (excellent!)
- If revenue was $50 million, that’s only a 2% margin (terrible!)
The percentage reveals efficiency and profitability independent of company size.
Industry Benchmark: What’s a “Good” Gross Margin?
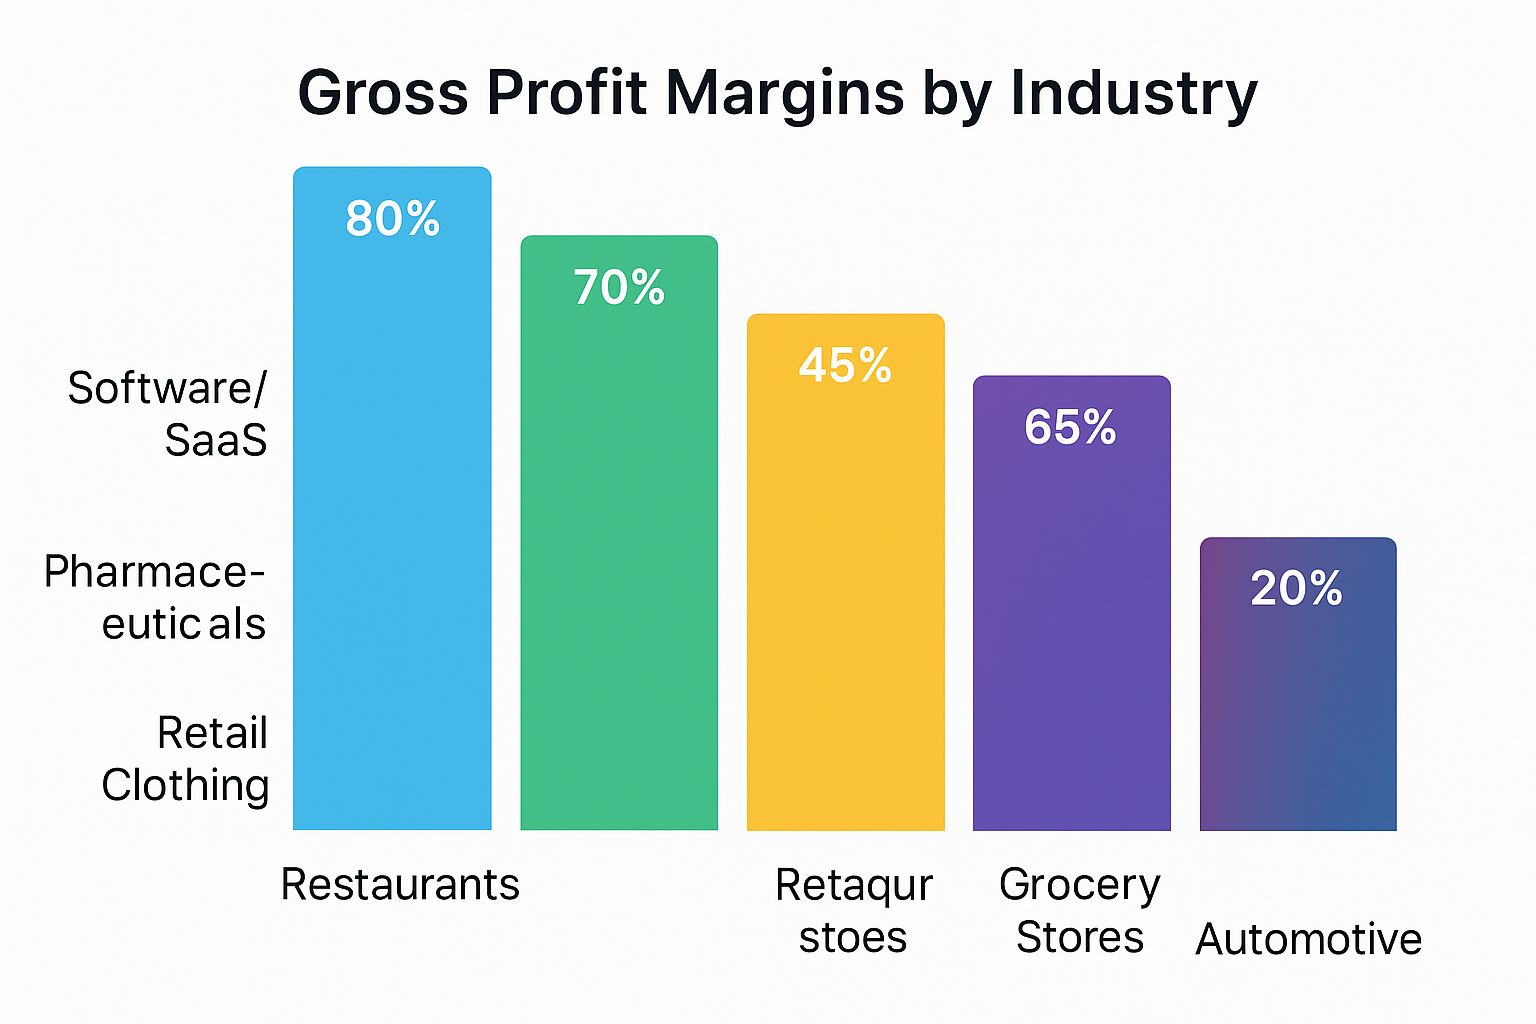
Gross profit margins vary dramatically by industry:
| Industry | Typical Gross Margin |
|---|---|
| Software/SaaS | 70-90% |
| Pharmaceuticals | 60-80% |
| Retail (clothing) | 40-50% |
| Restaurants | 60-70% (food only) |
| Grocery Stores | 20-30% |
| Automotive Manufacturing | 15-25% |
| Airlines | 10-20% |
The takeaway? Don’t compare a grocery store’s 25% margin to a software company’s 85% margin and conclude the software company is “better.” Instead, compare companies within the same industry and track how margins change over time.
How to Calculate Gross Profit: Step-by-Step Guide
Let’s walk through a complete calculation using a real-world scenario.
Example: Tech Gadget Company
XYZ Electronics sells smartwatches. Here’s their quarterly data:
Step 1: Identify Revenue
- Sold 10,000 smartwatches at $200 each
- Total Revenue = $2,000,000
Step 2: Calculate COGS
- Manufacturing cost per watch: $80
- Packaging per watch: $5
- Shipping to warehouse per watch: $3
- Total COGS per watch = $88
- Total COGS = $88 × 10,000 = $880,000
Step 3: Calculate Gross Profit
- Gross Profit = $2,000,000 – $880,000 = $1,120,000
Step 4: Calculate Gross Profit Margin
- Gross Profit Margin = ($1,120,000 ÷ $2,000,000) × 100 = 56%
What This Tells Us
XYZ Electronics keeps 56 cents of every dollar in sales after covering production costs. That’s a healthy margin for consumer electronics, suggesting:
- Good pricing power
- Efficient manufacturing
- Room to cover operating expenses and generate net profit
This kind of analysis is exactly what you need when evaluating stocks for your portfolio.
Gross Profit vs Net Profit: Understanding the Difference
Many beginners confuse gross profit with net profit. Let’s clear that up once and for all.
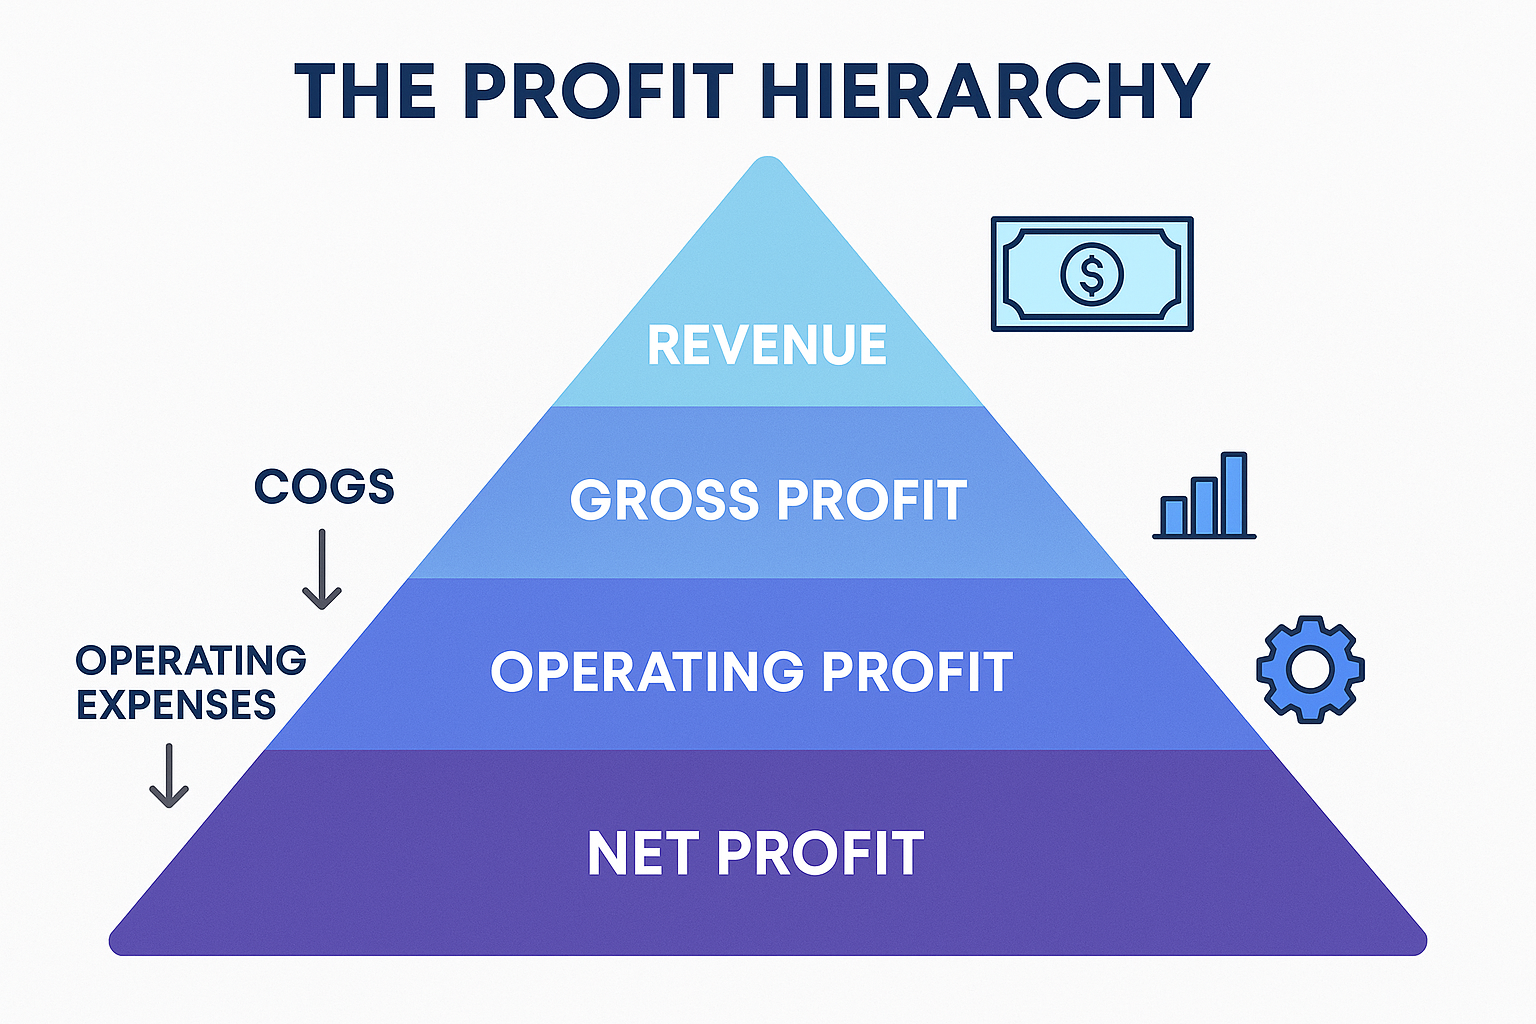
The Profit Hierarchy
Think of profitability as a staircase:
- Revenue (Top Line) – All money coming in
- Gross Profit – Revenue minus COGS
- Operating Profit (EBIT) – Gross profit minus operating expenses
- Net Profit (Bottom Line) – Operating profit minus interest, taxes, and other expenses
Key Differences
| Aspect | Gross Profit | Net Profit |
|---|---|---|
| What it measures | Profitability of core product/service | Overall company profitability |
| Expenses included | Only direct production costs | All expenses |
| Usefulness | Shows product economics | Shows total business health |
| Can it be negative? | Yes (selling below cost) | Yes (company losing money) |
See our full guide on gross profit vs net profit
Example: The Full Picture
Let’s continue with XYZ Electronics:
- Revenue: $2,000,000
- COGS: $880,000
- Gross Profit: $1,120,000 (56% margin)
Now add operating expenses:
- Marketing: $300,000
- Salaries: $400,000
- Rent & utilities: $100,000
- R&D: $150,000
- Operating Profit: $170,000
Finally, other expenses:
- Interest on debt: $30,000
- Taxes (25%): $35,000
- Net Profit: $105,000 (5.25% net margin)
Notice how the company went from a 56% gross margin to a 5.25% net margin. That’s normal! The gross profit must be high enough to cover all those other expenses and still leave something for shareholders.
Analyzing Gross Profit: What Investors Look For
Professional investors don’t just calculate gross profit; they analyze trends and compare metrics to uncover insights. Here’s how to think like a pro.
1. Trend Analysis: Is It Getting Better or Worse?
A single quarter’s gross margin is interesting, but the trend is what matters. Look at gross profit margin over time:
Improving margins suggests:
- Better operational efficiency
- Successful price increases
- Economies of scale kicking in
- Shift to higher-margin products
Declining margins warn of:
- Increasing competition
- Rising input costs
- Pricing pressure
- Operational problems
2. Competitive Comparison
Compare a company’s gross margin to its competitors. If Company A has a 45% margin while competitors average 30%, that’s a competitive advantage worth investigating.
Possible reasons for superior margins:
- Brand power (think Apple vs. generic smartphones)
- Proprietary technology
- Superior efficiency
- Vertical integration
3. Warning Signs
Watch out for these red flags:
- Shrinking gross margins over multiple quarters
- Margins are well below the industry average without a clear explanation
- Volatile margins that swing wildly quarter to quarter
- Negative gross profit (losing money on each sale)
Understanding these patterns helps you avoid losing money in the stock market by steering clear of fundamentally flawed businesses.
4. The Quality Indicator
Higher gross margins often indicate higher-quality businesses. Companies with 70%+ margins typically have:
- Strong competitive moats
- Pricing power
- Loyal customer bases
- Sustainable business models
These are exactly the kinds of companies that make great dividend investments because they generate plenty of cash flow.
How to Improve Gross Profit: Strategies That Work
Whether you’re running a business or analyzing investments, understanding how to improve gross profit is valuable knowledge.
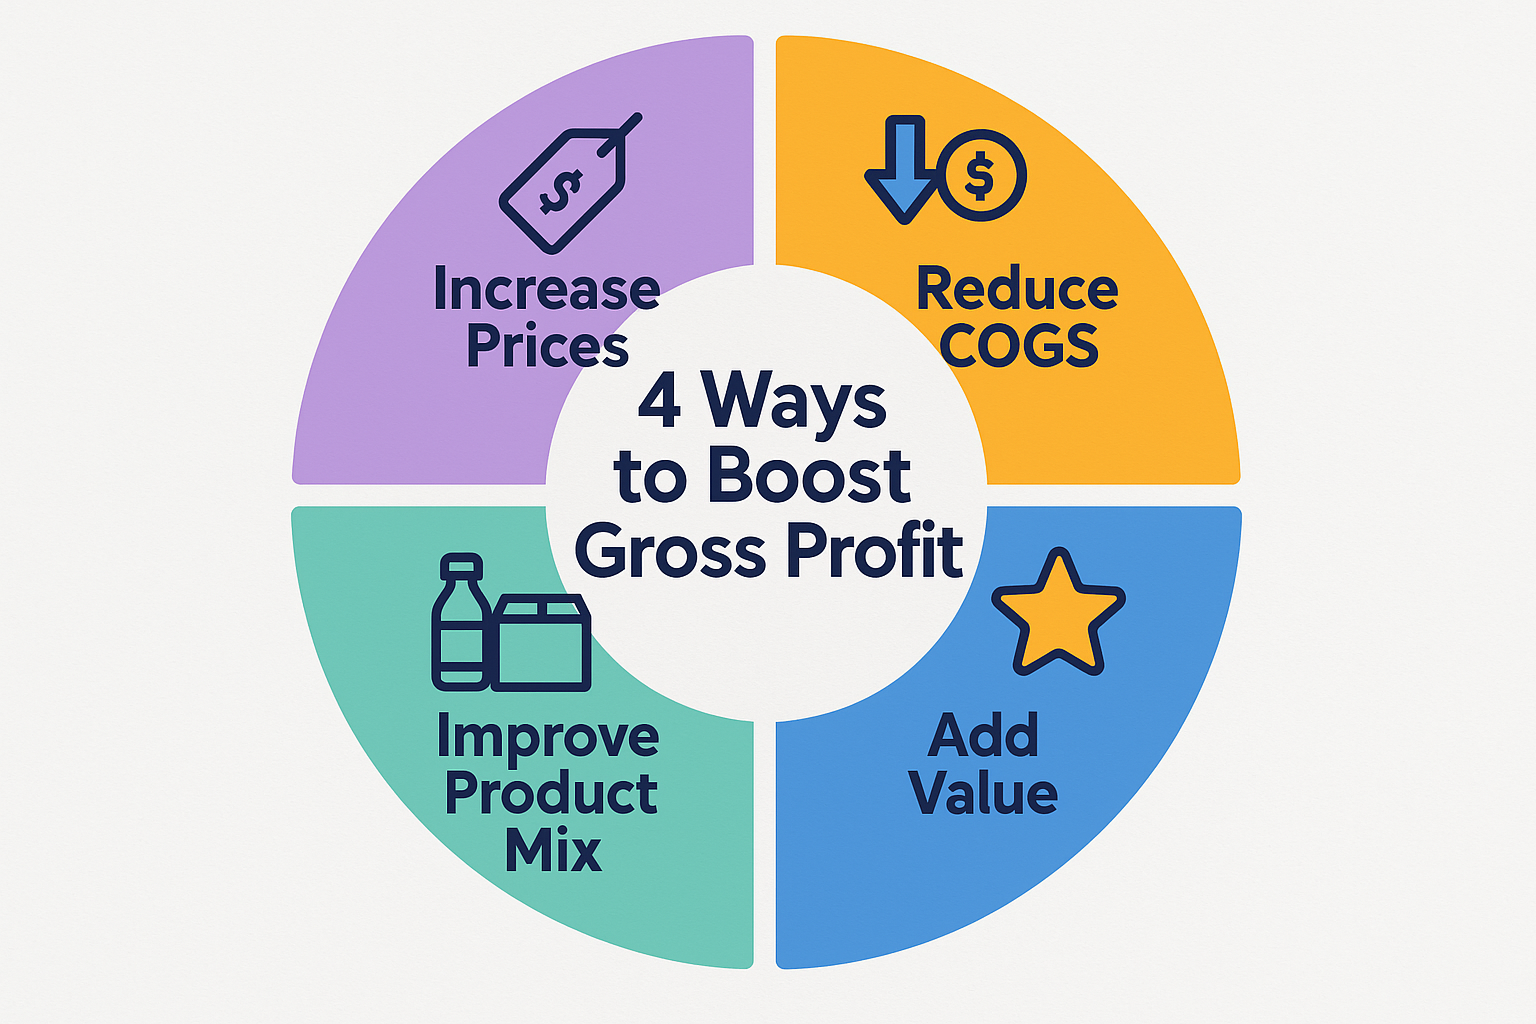
Strategy 1: Increase Prices
The most direct route to higher gross profit. If you can raise prices without losing customers, gross profit increases immediately.
Example: Raising smartwatch prices from $200 to $210 (5% increase) while COGS stays at $88:
- Old gross profit per unit: $112
- New gross profit per unit: $122
- Improvement: 8.9% increase in gross profit per unit
Strategy 2: Reduce COGS
Find ways to lower production costs without sacrificing quality:
- Negotiate better supplier contracts
- Improve manufacturing efficiency
- Reduce waste
- Automate production processes
- Buy materials in larger quantities (volume discounts)
Strategy 3: Shift Product Mix
Focus on selling more high-margin products and fewer low-margin ones.
Example: A retailer sells both:
- T-shirts (40% gross margin)
- Jackets (60% gross margin)
Promoting jackets more aggressively can boost overall gross profit margin without changing individual product margins.
Strategy 4: Add Value, Not Just Volume
Instead of competing on price, add features or services that justify premium pricing:
- Better customer service
- Extended warranties
- Faster shipping
- Superior quality
This is why Apple maintains 38-40% gross margins while many competitors struggle with 15-20%.
Gross Profit in Different Business Models
Not all businesses calculate or use gross profit the same way. Let’s explore variations.
Service Businesses
For service companies (consulting, landscaping, etc.), COGS includes:
- Direct labor costs
- Materials used in service delivery
- Subcontractor costs
Example: A landscaping company:
- Revenue: $5,000 for a project
- COGS: $1,500 (labor) + $500 (plants/materials) = $2,000
- Gross Profit: $3,000 (60% margin)
Manufacturing Companies
Manufacturers have more complex COGS:
- Raw materials
- Factory labor
- Manufacturing overhead (factory rent, equipment depreciation)
- Utilities for production facilities
Retail Businesses
Retailers’ COGS is primarily the wholesale cost of inventory:
- Purchase price from suppliers
- Shipping to the store
- Import duties (if applicable)
Not included: Store rent, sales staff salaries (these are operating expenses)
SaaS and Digital Businesses
Software companies have unique economics with very low COGS:
- Server/hosting costs
- Customer support is directly tied to delivery
- Payment processing fees
This is why software companies often have 75-90% gross margins—there’s almost no “cost” to serve one more customer.
Common Mistakes When Analyzing Gross Profit
Even experienced investors sometimes misinterpret gross profit. Avoid these pitfalls:
1: Ignoring One-Time Events
A company might have unusual COGS in one quarter due to:
- Inventory write-downs
- Factory closures
- Supply chain disruptions
Always check if margins are temporarily distorted by special events.
2: Not Adjusting for Accounting Changes
Companies sometimes change how they classify expenses. What was once COGS might become an operating expense (or vice versa), artificially changing gross margin.
3: Comparing Apples to Oranges
Don’t compare gross margins across wildly different industries. A 15% margin might be excellent for a grocery store but disastrous for a software company.
4: Focusing Only on Margin Percentage
A company with a 90% gross margin but only $100,000 in revenue isn’t necessarily better than one with a 30% margin and $100 million in revenue. Consider both percentage AND absolute dollars.
5: Forgetting About Scale
Some businesses have low margins but make it up in volume (Walmart, Amazon). Others have high margins but lower volume (luxury brands). Both can be successful, just different strategies.
Real-World Case Study: Analyzing a Public Company
Let’s analyze Nike’s gross profit to see how professionals do it.
Nike’s Numbers (Fiscal Year 2024)
According to Nike’s financial statements:
- Revenue: $51.4 billion
- COGS: $28.3 billion
- Gross Profit: $23.1 billion
- Gross Profit Margin: 44.9%
What This Tells Us
- Strong margin: 44.9% is excellent for apparel/footwear (industry average: 40-45%)
- Brand power: Nike’s margin reflects its ability to charge premium prices
- Efficiency: Despite global supply chains, Nike maintains healthy production economics
Trend Analysis
Looking at Nike’s margins over five years:
- 2020: 43.4%
- 2021: 44.8%
- 2022: 46.6%
- 2023: 43.5%
- 2024: 44.9%
Insight: Margins are stable in the 43-47% range, showing consistent profitability. The dip in 2023 was due to higher freight costs and excess inventory (temporary issues), with a recovery in 2024.
This kind of analysis helps you understand the cycle of market emotions and make rational decisions when others panic.
Using Gross Profit to Make Investment Decisions
How does gross profit analysis translate to better investment choices?
The Quality Screen
Start by filtering for companies with:
- Gross margins above industry average
- Stable or improving margins over 3-5 years
- Positive gross profit (obviously, but some unprofitable companies fail even this test)
This immediately eliminates many low-quality investments.
The Moat Detector
Companies with consistently high gross margins (60%+) often have economic moats:
- Apple: Brand loyalty and ecosystem
- Microsoft: Network effects and switching costs
- Visa/Mastercard: Duopoly in payment processing
- Pharmaceutical companies: Patent protection
These businesses can maintain pricing power and profitability for decades.
The Risk Assessment
Declining gross margins are an early warning system:
- Gradual decline: Increasing competition, industry maturation
- Sudden drop: Operational problems, pricing pressure, or accounting issues
When you see margins deteriorating, dig deeper before investing, or consider selling if you already own shares.
The Dividend Safety Check
For dividend investors, gross profit is crucial. A company needs healthy gross margins to:
- Cover operating expenses
- Generate free cash flow
- Pay sustainable dividends
- Invest in growth
A company with shrinking gross margins might cut dividends eventually, even if they look safe today.
The Connection Between Gross Profit and Business Strategy
Understanding gross profit reveals a company’s strategic choices.
High-Margin Strategy (Premium Positioning)
Companies like Tesla, Rolex, or Whole Foods choose:
- Higher prices
- Premium branding
- Better quality/features
- Lower volume, higher profit per sale
Pros: High gross margins, brand loyalty, pricing power
Cons: Smaller addressable market, vulnerability to economic downturns
Low-Margin Strategy (Volume Play)
Companies like Walmart, Costco, or McDonald’s choose:
- Lower prices
- Mass market appeal
- Operational efficiency
- High volume, lower profit per sale
Pros: Huge market share, recession resistance, economies of scale
Cons: Thin margins, vulnerability to cost increases, intense competition
Neither strategy is inherently better; both can create smart ways to make passive income through dividends and stock appreciation.
Advanced Analysis: Gross Profit Metrics
For those ready to level up, here are advanced metrics professionals use:
Gross Profit Per Employee
Formula: Gross Profit ÷ Number of Employees
This reveals productivity and efficiency. Higher numbers suggest:
- Better automation
- More efficient processes
- Higher-value products/services
Gross Profit Growth Rate
Formula: [(Current Period GP – Previous Period GP) ÷ Previous Period GP] × 100
Faster gross profit growth than revenue growth indicates expanding margins, a very positive sign.
Gross Profit Return on Investment (GPROI)
Formula: Gross Profit ÷ Average Inventory Cost
Especially important for retailers, this shows how efficiently inventory generates gross profit.
Tools and Resources for Gross Profit Analysis
Where can you find gross profit data?
Public Company Resources (Free)
- Company investor relations pages: Quarterly and annual reports
- SEC EDGAR database: Official filings (10-K, 10-Q)
- Yahoo Finance: Quick financial summaries
- Google Finance: Basic metrics and charts
- Morningstar: Detailed financial analysis
What to Look For in Financial Statements
Gross profit appears on the Income Statement (also called Profit & Loss Statement):
Revenue (Sales)                    $1,000,000
Cost of Goods Sold (COGS)            -$600,000
--------------------------------
Gross Profit                         $400,000
Gross Profit Margin                      40%
It’s usually one of the first items after revenue, making it easy to find.
Gross Profit FAQs
Yes! If COGS exceeds revenue, gross profit is negative. This means the company loses money on every sale, an unsustainable situation.
Generally, yes, but context matters. Compare within industries and consider business models. A 20% margin might be excellent for a grocery store but terrible for software.
For investments, review quarterly earnings reports. Look for trends over at least 3-5 years to filter out temporary fluctuations.
Both matter! Gross profit shows if the core business works; net profit shows if the entire company is profitable. You need both to be positive for a healthy business.
Absolutely! This happens when operating expenses exceed gross profit. It’s common for growth companies to invest heavily in expansion.
Most do, but some service companies or conglomerates might structure statements differently. When in doubt, calculate it yourself: Revenue minus COGS.
The Bigger Picture: Why This Matters for Your Financial Future
Understanding gross profit isn’t just about analyzing companies; it’s about developing financial literacy that serves you for life.
When you grasp how businesses actually make money, you:
- Make smarter investments by identifying quality companies
- Avoid value traps that look cheap but have fundamental problems
- Understand economic news better (why inflation hurts low-margin businesses)
- Evaluate your own ventures if you start a side business
- Think like an owner rather than a speculator
This knowledge compounds over time. The more you practice analyzing gross profit, the faster you’ll spot opportunities and risks. It’s one of the smart moves that separates successful long-term investors from those who chase hot tips.
And here’s something powerful: understanding why the stock market goes up over time becomes clearer when you see how companies with strong gross margins compound profits year after year. That compounding, at the company level, translates to compounding returns for shareholders.
💰 Gross Profit Calculator
Calculate your gross profit and margin instantly
Margin: (Gross Profit ÷ Revenue) × 100
Conclusion: Your Gross Profit Mastery Action Plan
You've just completed a comprehensive deep dive into gross profit, from basic definitions to advanced analysis techniques. Let's recap the essential points:
Gross profit is the foundation of business profitability, showing whether a company makes money on its core products before paying other expenses. The formula is simple: Revenue minus Cost of Goods Sold, but the insights it reveals are powerful.
Gross profit margin (the percentage) allows you to compare companies regardless of size and identify those with competitive advantages, pricing power, and sustainable business models.
When analyzing investments, always:
✅ Check gross margins against industry benchmarks
✅ Look for stable or improving trends over time
✅ Compare competitors to spot winners and losers
✅ Watch for warning signs like shrinking margins
✅ Consider both percentage margins and absolute dollar amounts
Your Next Steps
- Practice: Open Yahoo Finance and analyze the gross profit margins of three companies you're interested in
- Compare: Look at their margins over the past 5 years, are they improving or declining?
- Apply: Use the calculator above to understand the numbers for any business you're evaluating
- Expand: Combine gross profit analysis with other metrics like dividend safety for complete investment decisions
- Learn more: Explore our comprehensive investing guides to build on this foundation
Remember, successful investing isn't about finding secret formulas or hot tips; it's about understanding fundamental business metrics like gross profit and making informed decisions based on solid analysis.
Companies with strong, sustainable gross margins are often the ones that compound wealth for shareholders over the course of decades. By mastering this metric, you're building a skill that will serve you for your entire investing journey.
Now you know. The next step is action. Start analyzing, start comparing, and start making smarter investment decisions today.
Disclaimer
This article is for educational and informational purposes only and should not be considered financial, investment, or professional advice. The content is based on general principles of economic analysis and publicly available information. Always conduct your own research and consult with a qualified financial advisor before making investment decisions. Past performance does not guarantee future results. All investments carry risk, including the potential loss of principal. The examples provided are hypothetical and for illustration purposes only. TheRichGuyMath.com and the author are not responsible for any financial decisions made based on this content.
About the Author
Max Fonji is a financial educator and content strategist with over a decade of experience helping beginners understand investing fundamentals. With a background in financial analysis and a passion for making complex concepts accessible, Max has helped thousands of readers build confidence in their investment decisions. When not writing about finance, Max enjoys analyzing quarterly earnings reports and discovering undervalued dividend stocks. Connect with Max and explore more beginner-friendly investing guides at TheRichGuyMath.com.
Related posts:
 What Is SmartPass? Raptor Digital Hall Pass Explained for K-12 Schools
 What Is the 3x Rent Rule & How to Calculate It (With Examples)
 Portfolio Income: Definition, Examples, Tax Rules, and Strategies
 Bookkeeping vs Accounting: What’s the Difference & Which Do You Need?
 What Is Profitability Analysis & How to Do It: Metrics, Example & Tips
 How to Save Money Fast: A Smart Savings Plan That Actually Works