Ever looked at a company’s financial statement and felt like you were reading a foreign language? You’re not alone. One of the most common confusions that trips up new investors and business owners is the distinction between gross profit vs net profit. Here’s the thing: a company can have stellar gross profit numbers but still end up losing money at the end of the day. How is that possible?
Think of it like this: imagine you run a lemonade stand. You sell $100 worth of lemonade, and it costs you $30 for lemons, sugar, and cups. That $70 difference feels pretty good, right? But wait, you still need to pay your little brother for helping out, cover the cost of the table you borrowed, and maybe even pay your parents “rent” for using the front yard. After all those expenses, you might only have $20 left in your pocket. That journey from $70 to $20 is exactly what separates gross profit from net profit, and understanding this difference could be the key to making smarter investment decisions and building real wealth.
Key Takeaways
- Gross profit measures revenue minus the direct costs of producing goods or services (Cost of Goods Sold), showing how efficiently a company manufactures or delivers its core product.
- Net profit is the final bottom line after subtracting ALL expenses, including operating costs, taxes, interest, and other overhead, from total revenue.
- Gross profit margin helps you evaluate production efficiency, while net profit margin reveals overall business profitability and financial health.
- Both metrics are essential for investors analyzing company performance and business owners making strategic decisions.
- A company can have strong gross profit but weak net profit if operating expenses, debt payments, or taxes are too high..
What Is Gross Profit?
Gross profit is the money a company earns after subtracting its direct costs of producing and selling its products or services. These direct costs are called Cost of Goods Sold (COGS) or Cost of Sales. Investopedia – Gross Profit
Think of gross profit as the first checkpoint in understanding profitability. It tells you how much money is left over after paying for the basic ingredients needed to create what you’re selling.
The Gross Profit Formula
The calculation is refreshingly simple:
Gross Profit = Revenue – Cost of Goods Sold (COGS)
Let’s break down each component:
- Revenue: The total money coming in from sales before any expenses
- COGS: Direct costs tied to production (raw materials, direct labor, manufacturing overhead)
What’s Included in COGS?
Understanding what counts as COGS is crucial for grasping gross profit:
Included in COGS:
- Raw materials and supplies
- Direct labor (workers who physically make the product)
- Manufacturing overhead (factory rent, equipment depreciation)
- Packaging costs
- Freight and shipping costs for materials
NOT included in COGS:
- Marketing and advertising
- Sales team salaries
- Office rent
- Administrative salaries
- Interest on loans
- Taxes
Real-World Example: Gross Profit in Action
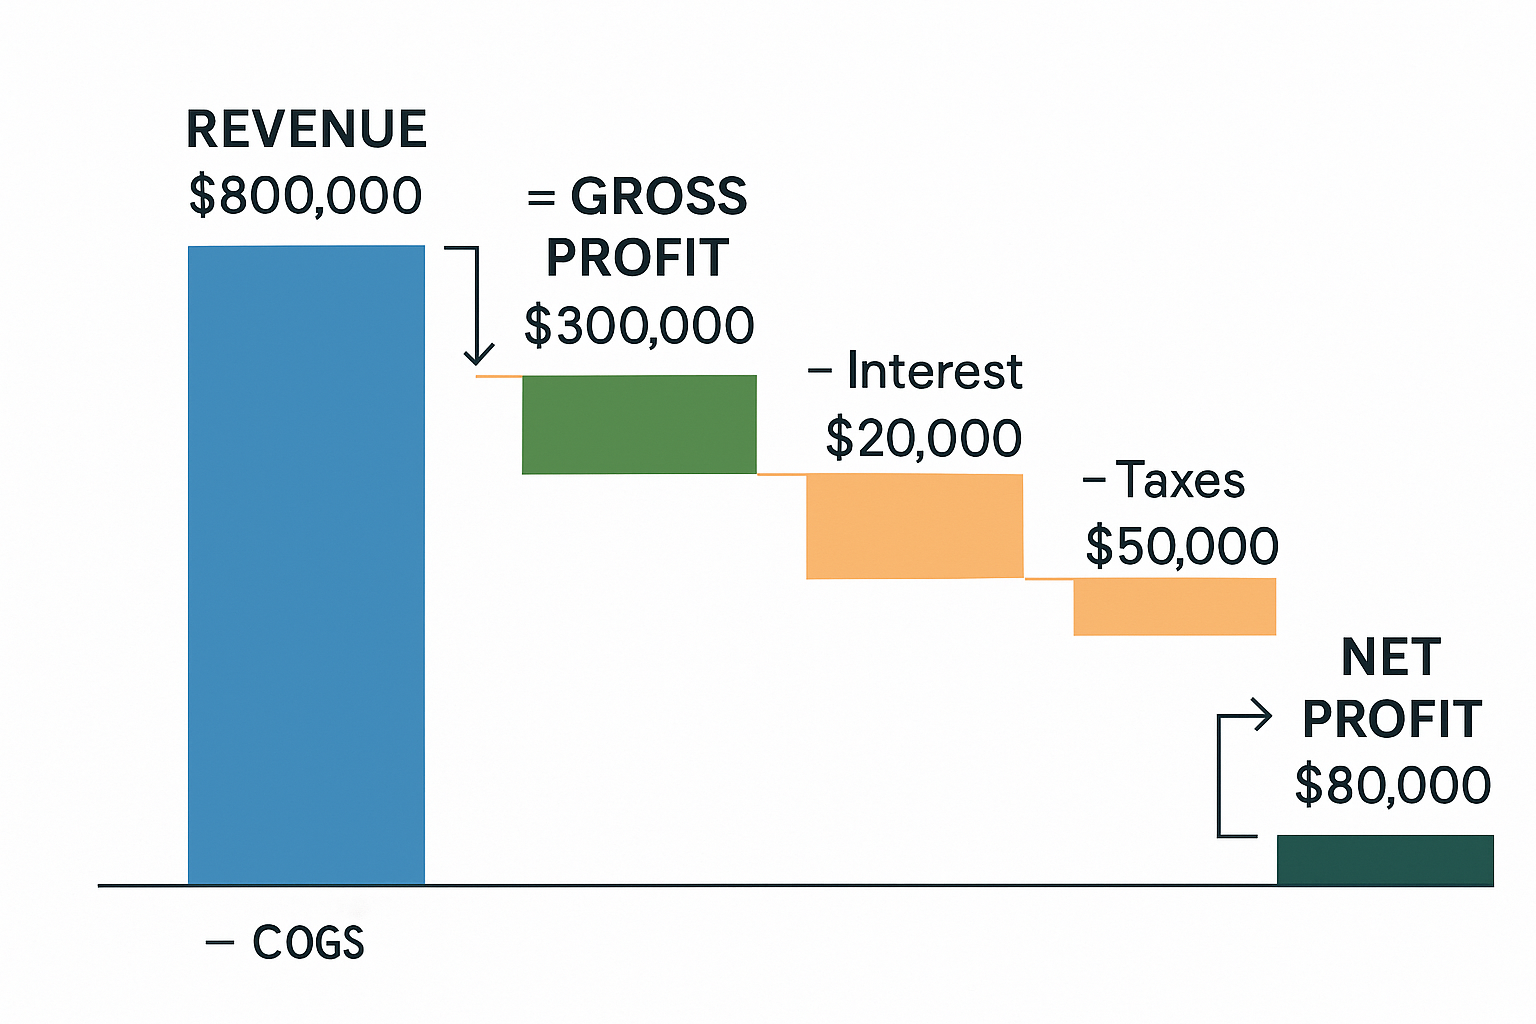
Let’s say Sarah’s Sneaker Company had the following numbers in 2025:
- Total Revenue: $500,000
- Cost of materials: $150,000
- Factory worker wages: $80,000
- Manufacturing equipment costs: $20,000
Gross Profit = $500,000 – ($150,000 + $80,000 + $20,000) = $250,000
This $250,000 is what Sarah has left to cover all her other business expenses, es as marketing, office staff, rent, and hopefully, profit.
What Is Net Profit?
Net profit (also called net income or the “bottom line”) is what remains after you subtract every single expense from revenue. This is the true measure of profitability, the actual money the business gets to keep. See detailed net profit definitions on Investopedia.
If gross profit is the first checkpoint, net profit is the finish line. It’s the number that ultimately matters most to business owners and investors because it shows whether the company is actually making money or just spinning its wheels.
The Net Profit Formula
Net Profit = Revenue – Total Expenses
Or, starting from gross profit:
Net Profit = Gross Profit – Operating Expenses – Interest – Taxes – Other Expenses
What Gets Subtracted to Reach Net Profit?
After calculating gross profit, you still need to subtract:
- Operating Expenses (OpEx): Rent, utilities, salaries for non-production staff, marketing, insurance, office supplies
- Depreciation and Amortization: The gradual expense of long-term assets
- Interest Expenses: Payments on business loans and debt
- Taxes: Corporate income taxes
- Other Expenses: One-time costs, legal fees, restructuring costs
Real-World Example: Net Profit in Action
Continuing with Sarah’s Sneaker Company, let’s add the rest of her expenses:
- Gross Profit: $250,000 (from above)
- Marketing expenses: $50,000
- Office rent and utilities: $30,000
- Administrative salaries: $60,000
- Interest on business loan: $10,000
- Taxes: $25,000
- Other expenses: $15,000
Net Profit = $250,000 – ($50,000 + $30,000 + $60,000 + $10,000 + $25,000 + $15,000) = $60,000
So while Sarah had $250,000 in gross profit, her actual net profit, the money she can reinvest or distribute to owners, is only $60,000.
For more details on profit metrics like operating profit and margin, see Operating Profit Explained.
Gross Profit vs Net Profit: Side-by-Side Comparison
Here’s a clear breakdown of how these two metrics differ:
| Feature | Gross Profit | Net Profit |
|---|---|---|
| What it measures | Efficiency of production/service delivery | Overall business profitability |
| Formula | Revenue – COGS | Revenue – All Expenses |
| Expenses included | Only direct costs (COGS) | ALL business expenses |
| Location on income statement | Near the top | At the very bottom (“bottom line”) |
| What it tells investors | How well the company produces its product | Whether the company is truly profitable |
| Can it be negative? | Yes (selling below production cost) | Yes (operating at a loss) |
| Primary use | Evaluating production efficiency and pricing strategy | Assessing overall financial health |
Learn more about profit types in our Profit Guide.
Why Both Metrics Matter for Investors
When you’re evaluating whether to invest in a company’s stock, looking at both gross profit and net profit gives you a complete picture. Here’s why each matters:
Gross Profit Reveals Competitive Advantage
A strong gross profit margin (gross profit ÷ revenue) shows that a company has:
- Pricing power: They can charge premium prices
- Efficient operations: They produce products cost-effectively
- Quality products: Customers value what they’re selling
- Competitive moat: Something that protects them from competitors
For example, luxury brands like Apple typically have high gross profit margins (often 35-40%) because they can charge premium prices while managing production costs effectively.
Net Profit Shows Real Profitability
Net profit margin (net profit ÷ revenue) reveals:
- Actual money-making ability: Is the business model sustainable?
- Cost control: Can management keep expenses in check?
- Tax efficiency: How well does the company manage its tax burden?
- Debt management: Are interest payments eating into profits?
A company with great gross profit but terrible net profit might have serious operational problems, bloated overhead, excessive debt, or poor management decisions. Understanding why companies succeed or fail helps you avoid costly investment mistakes.
The Gap Between Gross and Net Tells a Story
The difference between gross profit and net profit reveals how much a company spends on everything beyond production. A widening gap over time could signal:
- Rising operating costs
- Aggressive expansion (which might pay off later)
- Inefficient management
- Increased debt burden
Conversely, a narrowing gap might indicate improving efficiency and better cost management. SEC.gov CompanyFilingss
Understanding Profit Margins: The Percentage Perspective
While absolute dollar amounts matter, profit margins let you compare companies of different sizes and track performance over time.
Gross Profit Margin
Gross Profit Margin = (Gross Profit ÷ Revenue) × 100
For Sarah’s Sneaker Company:
($250,000 ÷ $500,000) × 100 = 50%
This means that for every dollar of revenue, 50 cents remains after covering production costs.
Net Profit Margin
Net Profit Margin = (Net Profit ÷ Revenue) × 100
For Sarah’s Sneaker Company:
($60,000 ÷ $500,000) × 100 = 12%
This means that for every dollar of revenue, only 12 cents becomes actual profit.
What’s a “Good” Profit Margin?
This varies dramatically by industry:
High Gross Margin Industries:
- Software companies: 70-90%
- Pharmaceuticals: 60-80%
- Luxury goods: 50-65%
Lower Gross Margin Industries:
- Grocery stores: 20-30%
- Airlines: 15-25%
- Automotive manufacturing: 10-20%
Net Profit Margins are typically much lower across the board:
- Excellent: 20%+
- Good: 10-20%
- Average: 5-10%
- Struggling: Below 5%
When evaluating dividend-paying stocks or looking for high dividend stocks, checking both profit margins helps ensure the company can sustain those payments.
💰 Gross Profit vs Net Profit Calculator
Calculate and compare your business profitability metrics
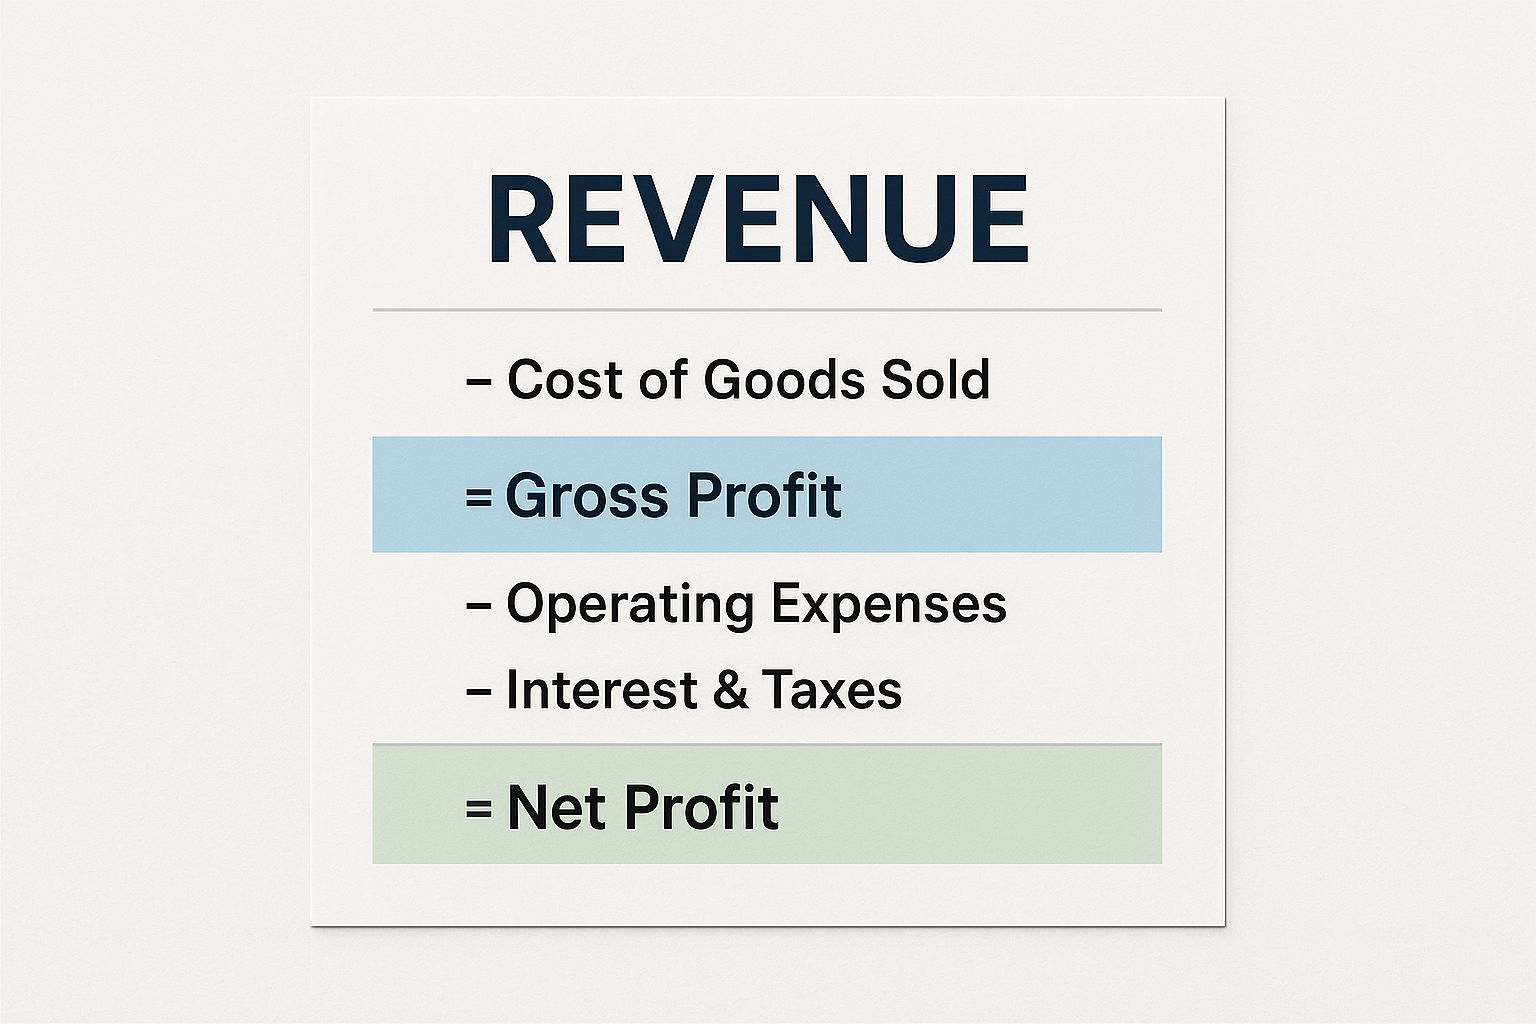
How to Find Gross Profit and Net Profit in Financial Statements
When you’re researching companies for investment, you’ll find these numbers on the income statement (also called the profit and loss statement or P&L).
Reading an Income Statement
Here’s the typical structure you’ll see:
- Revenue (or Sales) – at the top
- – Cost of Goods Sold (COGS)
- = Gross Profit ← First key metric
- – Operating Expenses
- = Operating Income (EBIT – Earnings Before Interest and Taxes)
- – Interest Expense
- = Earnings Before Tax (EBT)
- – Taxes
- = Net Income ← Second key metric (the bottom line)
Most publicly traded companies make their financial statements available on their investor relations websites, and you can also find them through the SEC’s EDGAR database or financial platforms like Yahoo Finance, Morningstar, or Bloomberg.
Common Misconceptions About Gross Profit vs Net Profit
1: “Higher gross profit always means a better company.”
Reality: A company can have excellent gross profit but terrible net profit if it’s wasteful with operating expenses. For example, a tech startup might have 80% gross margins but lose money due to massive marketing and R&D spending.
2: “Net profit is the only number that matters.”
Reality: Both metrics tell important stories. Declining gross profit margins might signal increasing competition or rising production costs—problems that could worsen over time even if net profit looks okay today.
3: “Profit margins should be consistent across all industries.”
Reality: Different industries have vastly different margin structures. Comparing a software company’s margins to a grocery store’s margins is like comparing apples to oranges. Always compare companies within the same industry.
4: “A company with positive gross profit can’t go bankrupt.”
Reality: Many companies with positive gross profit have gone bankrupt because their operating expenses, debt payments, and other costs exceeded their gross profit. The path from gross to net profit matters enormously.
Practical Applications: Using Gross Profit vs Net Profit in Decision-Making
For Investors
When evaluating stock market opportunities, use both metrics together:
Step 1: Check Gross Profit Margin Trends
- Is it stable or improving? Good sign
- Is it declining? Warning sign, investigate why
Step 2: Examine Net Profit Margin
- Compare it to industry peers
- Look for consistency over multiple quarters/years
- Check if the company is actually profitable
Step 3: Analyze the Gap
- If gross margins are strong but net margins are weak, dig into operating expenses.
- Look for one-time charges that might be distorting net profit
- Assess whether management is controlling costs effectively
Understanding these concepts helps you avoid common pitfalls and make smarter choices, especially when considering why the stock market goes up over time. Profitable companies drive market growth.
For Business Owners
Use Gross Profit to:
- Set pricing strategies
- Evaluate supplier costs
- Measure production efficiency
- Determine if your core product/service is viable
Use Net Profit to:
- Assess overall business health
- Make hiring decisions
- Plan for expansion
- Determine how much you can pay yourself or reinvest
For Career Professionals
Understanding these concepts helps you:
- Negotiate better compensation (especially if tied to company performance)
- Assess your employer’s financial stability
- Speak intelligently in business meetings
- Make informed decisions about stock options or equity compensation
Advanced Concept: Operating Profit (The Middle Ground)
There’s actually a third profit metric worth knowing: Operating Profit (also called Operating Income or EBIT – Earnings Before Interest and Taxes).
Operating Profit = Gross Profit – Operating Expenses
This sits between gross profit and net profit, showing profitability from core business operations before considering financing costs (interest) and taxes.
Why does this matter? Because:
- Interest expenses reflect financing decisions, not operational efficiency
- Tax rates can vary based on location and tax strategies
- Operating profit shows how well the actual business performs
Many professional investors focus heavily on operating profit because it reveals core business strength without the “noise” of financial structure and tax situations.
Real-Life Case Study: The Tale of Two Companies
Let me share a story that illustrates why both metrics matter.
In 2023, I was researching two retail companies, let’s call them Company A and Company B. Both had similar revenue of around $1 billion.
Company A had:
- Gross profit margin: 25%
- Net profit margin: 8%
- The gap: 17% of revenue went to operating costs
Company B had:
- Gross profit margin: 40%
- Net profit margin: 3%
- The gap: 37% of revenue went to operating costs
At first glance, Company A seemed better with its higher net profit margin. But digging deeper revealed a different story.
Company B’s high gross margin showed they had a premium brand with pricing power; customers loved their products and paid more for them. Their low net margin came from heavy investments in new stores, technology, and marketing. These were growth investments.
Company A’s lower gross margin suggested they were in a price-competitive market with thin production margins. Their better net margin came from cutting costs to the bone, including underinvesting in growth.
Fast forward to 2025: Company B’s investments paid off. Their new stores matured, operating expenses as a percentage of revenue decreased, and net profit margin expanded to 12%. The stock price tripled.
Company A maintained its 8% net margin but struggled to grow revenue. The stock barely moved.
The lesson? Context matters. Understanding both gross and net profit—and the story between them- makes you a more sophisticated investor. This kind of analysis connects to smart investment moves that build long-term wealth.
How Economic Cycles Affect Gross Profit and Net Profit
Both profit metrics respond differently to economic conditions, which is crucial for investors to understand, especially when navigating the cycle of market emotions.
During Economic Expansion
- Gross Profit: Often expands as companies raise prices and benefit from economies of scale
- Net Profit: Can expand even faster as fixed operating costs get spread over higher revenue
During Recessions
- Gross Profit: May shrink as companies discount prices to maintain sales volume, or as input costs rise faster than they can pass along to customers
- Net Profit: Often shrinks more dramatically as revenue falls, but many operating expenses (rent, salaries, etc.) remain fixed
During Inflation
- Gross Profit: Gets squeezed if input costs rise faster than selling prices
- Net Profit: Can be hit even harder as operating expenses also rise with inflation
Smart investors watch how companies manage both metrics through different economic conditions. Companies that maintain stable margins through tough times often make the best long-term investments.
Tax Implications: Why Net Profit Matters for Your Personal Finances
If you’re a business owner, understanding the difference between gross and net profit has direct tax implications:
- You pay taxes on net profit, not gross profit
- Business expenses that reduce gross profit to net profit are tax-deductible
- Properly categorizing expenses can significantly impact your tax bill
For example, if your business has $200,000 in gross profit but $150,000 in legitimate business expenses, you only pay taxes on the $50,000 net profit, not the full $200,000.
This is why proper bookkeeping and understanding expense categories matter so much. Every legitimate business expense you properly track reduces your taxable income.
Industry-Specific Considerations
Different industries have unique characteristics that affect how you should interpret gross profit vs net profit:
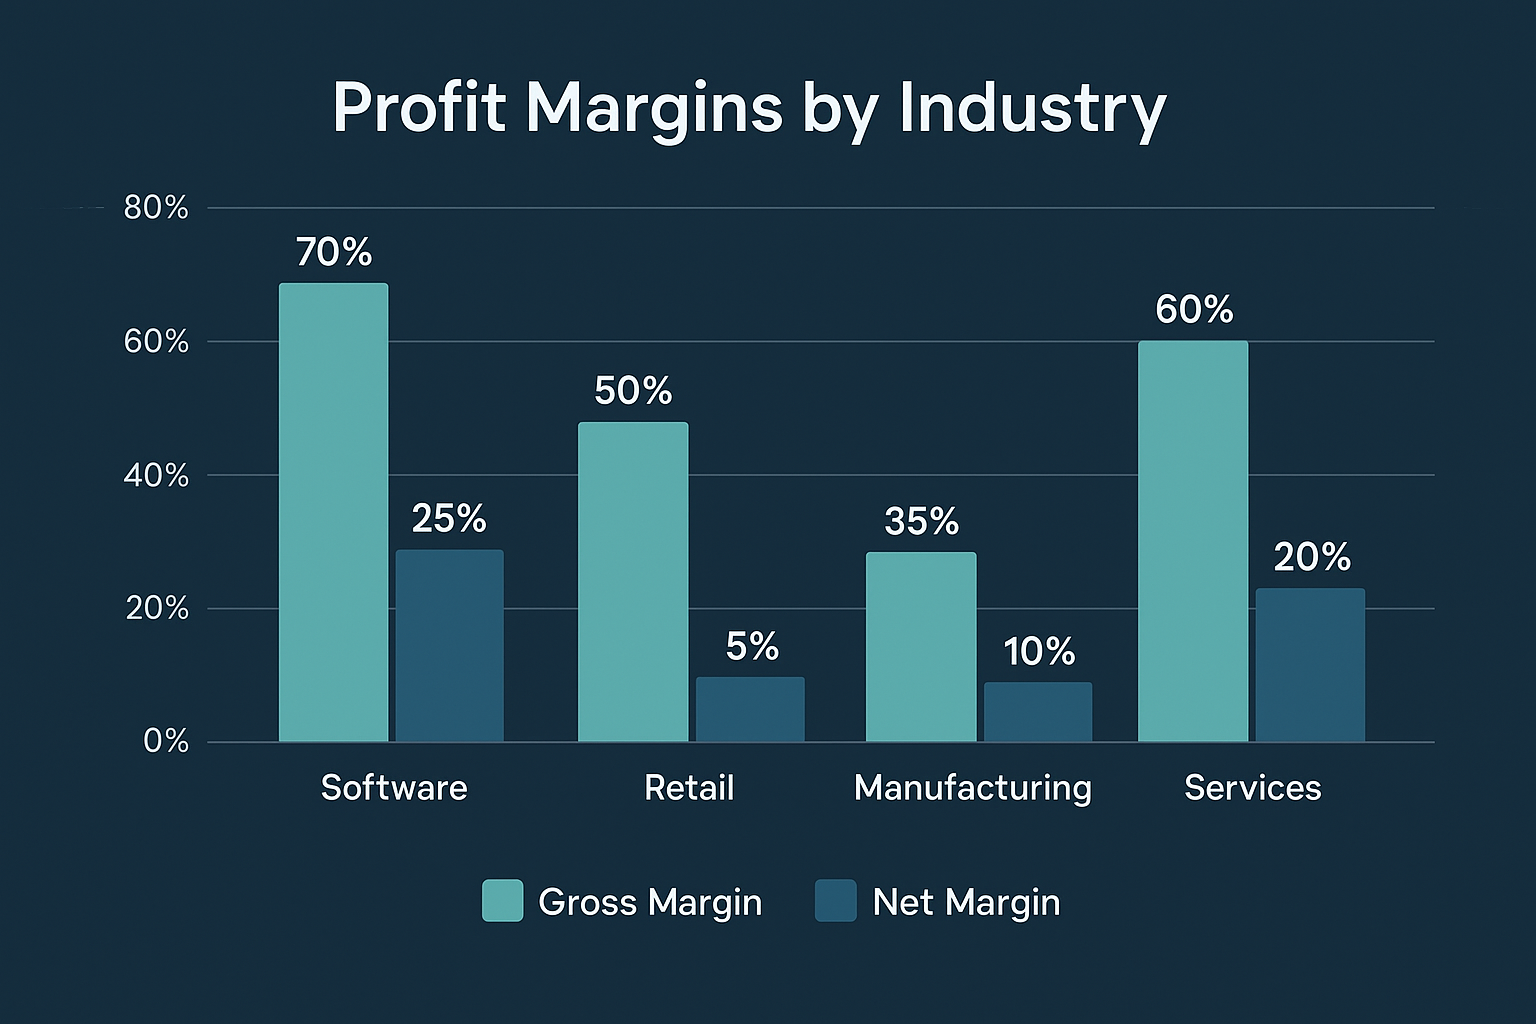
Technology/Software Companies
- Typical Gross Margins: 70-90% (very high)
- Typical Net Margins: Highly variable (-20% to +30%)
- Why: Low cost to deliver software, but high R&D and sales/marketing costs
- What to watch: Customer acquisition costs and lifetime value
Retail Companies
- Typical Gross Margins: 25-50%
- Typical Net Margins: 2-8%
- Why: Moderate product costs, but high store operation and inventory costs
- What to watch: Same-store sales growth and inventory turnover
Manufacturing Companies
- Typical Gross Margins: 20-40%
- Typical Net Margins: 5-15%
- Why: Significant material and labor costs, plus factory overhead
- What to watch: Capacity utilization and raw material cost trends
Service Companies
- Typical Gross Margins: 40-70%
- Typical Net Margins: 10-25%
- Why: Labor is the primary cost; lower overhead than manufacturing
- What to watch: Billable hours and employee utilization rates
When evaluating passive income opportunities through dividend stocks, understanding industry-specific margin expectations helps you identify sustainable dividend payers.
Red Flags: Warning Signs in Profit Metrics
Watch out for these concerning patterns:
Declining Gross Profit Margins Over Time
- Suggests losing pricing power or facing increasing competition
- May indicate rising production costs that the company can’t pass along
Volatile or Erratic Profit Margins
- Makes the business unpredictable and risky
- Could indicate poor management or an unstable business model
Positive Gross Profit but Consistently Negative Net Profit
- The company is burning through cash
- Operating expenses are out of control
- May not be sustainable long-term
Improving Gross Margins but Declining Net Margins
- Operating expenses are growing faster than gross profit
- Could indicate inefficient scaling or management problems
Margins Far Below Industry Averages
- The company may lack competitive advantages
- It could be a value trap rather than a value investment
Action Steps: Applying This Knowledge Today
Ready to put this knowledge to work? Here’s your action plan:
For Aspiring Investors:
- Pick three companies in an industry you understand
- Pull their most recent income statements (available on investor relations pages or Yahoo Finance)
- Calculate both gross and net profit margins for each company
- Compare the three companies and research what explains the differences
- Track these metrics quarterly to see how they trend over time
For Business Owners:
- Review your last 12 months of financial statements
- Calculate your gross and net profit margins monthly
- Identify your three biggest expense categories between gross and net profit
- Set targets for improving both margins by 1-2% over the next year
- Create a dashboard to track these metrics in real-time
For Career Professionals:
- Ask to see your company’s financial statements (if privately held)
- Understand how your role impacts either gross or net profit
- Look for opportunities to improve efficiency in your area
- Use this knowledge to make a stronger case for raises or promotions
Yes, though it’s rare and unsustainable. This happens when the cost to produce products exceeds the revenue from selling them. It’s a sign of serious pricing or cost problems.
Both matter, but in different ways. Gross profit shows competitive strength and pricing power. Net profit shows actual profitability. Analyze both together for the complete picture.
This varies by industry. Stable industries (utilities, consumer staples) have consistent margins. Cyclical industries (technology, automotive) see more variation. Track margins over multiple years for meaningful trends.
It depends entirely on your industry, but generally aim for at least 50% for service businesses and 30-40% for product businesses. Research competitors in your specific niche for better benchmarks.
No, that’s mathematically impossible. Net profit is calculated by subtracting expenses from gross profit, so it will always be lower (or equal if there are zero additional expenses, which never happens in practice).
Non-profits use different terminology (like “net assets” instead of “net profit”), but the concepts are similar. They still need revenue to exceed expenses to remain sustainable.
Conclusion: Mastering the Fundamentals of Business Profitability
Understanding gross profit vs net profit isn’t just accounting jargon; it’s a fundamental skill that empowers you to make smarter financial decisions, whether you’re investing in the stock market, running a business, or advancing your career.
Here’s what you now know:
✅ Gross profit (Revenue – COGS) shows how efficiently a company produces its core product or service
✅ Net profit (Revenue – All Expenses) reveals the true bottom line and overall profitability
✅ Both metrics together tell a complete story about business health and competitive positioning
✅ Industry context matters; compare companies within the same sector
✅ Trends over time are more meaningful than single snapshots
The journey from revenue to net profit reveals everything about how a company operates, where it spends money, and whether it’s building sustainable value. Companies that maintain strong margins in both categories and improve them over time often make the best long-term investments.
Remember Sarah’s Sneaker Company from our earlier example? By understanding both her $250,000 gross profit and her $60,000 net profit, she gained insights into where her money was going and where she could improve. Maybe she could negotiate better supplier prices to improve gross profit. Or perhaps she could streamline operations to reduce the gap between gross and net profit.
The same analytical approach works whether you’re evaluating a potential investment, running your own business, or simply trying to understand the financial health of your employer.
As you continue your financial education journey, keep building on these fundamentals. Learn about smart investment strategies, understand market dynamics, and always dig deeper than surface-level numbers.
Your next steps:
- Practice analyzing real company financial statements using what you’ve learned
- Use the interactive calculator above to model different business scenarios
- Set up a simple spreadsheet to track your own business or investment metrics
- Share this knowledge with others who are also learning about finance
Financial literacy is a superpower in 2025, and you’ve just added a crucial tool to your arsenal. Now go put it to work!
Disclaimer
This article is for educational and informational purposes only and should not be construed as financial, investment, tax, or legal advice. The examples provided are hypothetical and for illustration purposes only. Profit margins vary significantly by industry, company, and economic conditions. Always consult with qualified financial advisors, accountants, and other professionals before making investment decisions or business changes. Past performance does not guarantee future results. The author and publisher are not responsible for any financial decisions made based on this content.
About the Author
Max Fonji is a financial educator and content strategist with over 30 years of experience in investment analysis and business finance. He specializes in breaking down complex financial concepts into accessible, actionable insights for everyday investors and entrepreneurs. Max’s work has helped thousands of people build financial literacy and make more informed decisions about their money. When he’s not analyzing financial statements, you can find him mentoring young investors and exploring new ways to make finance education more engaging and practical.
Related posts:
 What Is SmartPass? Raptor Digital Hall Pass Explained for K-12 Schools
 What Is the 3x Rent Rule & How to Calculate It (With Examples)
 Portfolio Income: Definition, Examples, Tax Rules, and Strategies
 Bookkeeping vs Accounting: What’s the Difference & Which Do You Need?
 What Is Profitability Analysis & How to Do It: Metrics, Example & Tips
 How to Save Money Fast: A Smart Savings Plan That Actually Works