Investing transforms earned income into growing wealth through compound returns over time. Learning how to start investing as a beginner requires understanding the math behind money, selecting appropriate investment vehicles, and implementing evidence-based strategies that align with personal financial goals.
This comprehensive guide explains the fundamental principles, practical steps, and proven frameworks that enable new investors to build wealth systematically. Each section demonstrates cause-and-effect relationships between financial decisions and long-term outcomes, supported by data and logic rather than speculation.
This guide is part of our investing fundamentals, where you can explore strategies, account types, and investment options suitable for new investors seeking to understand how markets and valuation principles work.
Key Takeaways
- Start with fa inancial foundation: Establish emergency savings and manage high-interest debt before investing to prevent forced liquidation during market downturns
- Understand compound growth mechanics: Time in the market generates exponential returns; a 7% annual return doubles invested capital approximately every 10 years
- Choose tax-advantaged accounts first: Roth IRAs and 401(k)s provide significant tax benefits that accelerate wealth accumulation compared to taxable brokerage accounts
- Implement dollar-cost averaging: Consistent monthly contributions reduce timing risk and build disciplined investing habits regardless of market conditions
- Diversify through index funds: Broad market ETFs minimize individual stock risk while capturing overall market returns at minimal cost (expense ratios below 0.10%)
Why Start Investing Early?
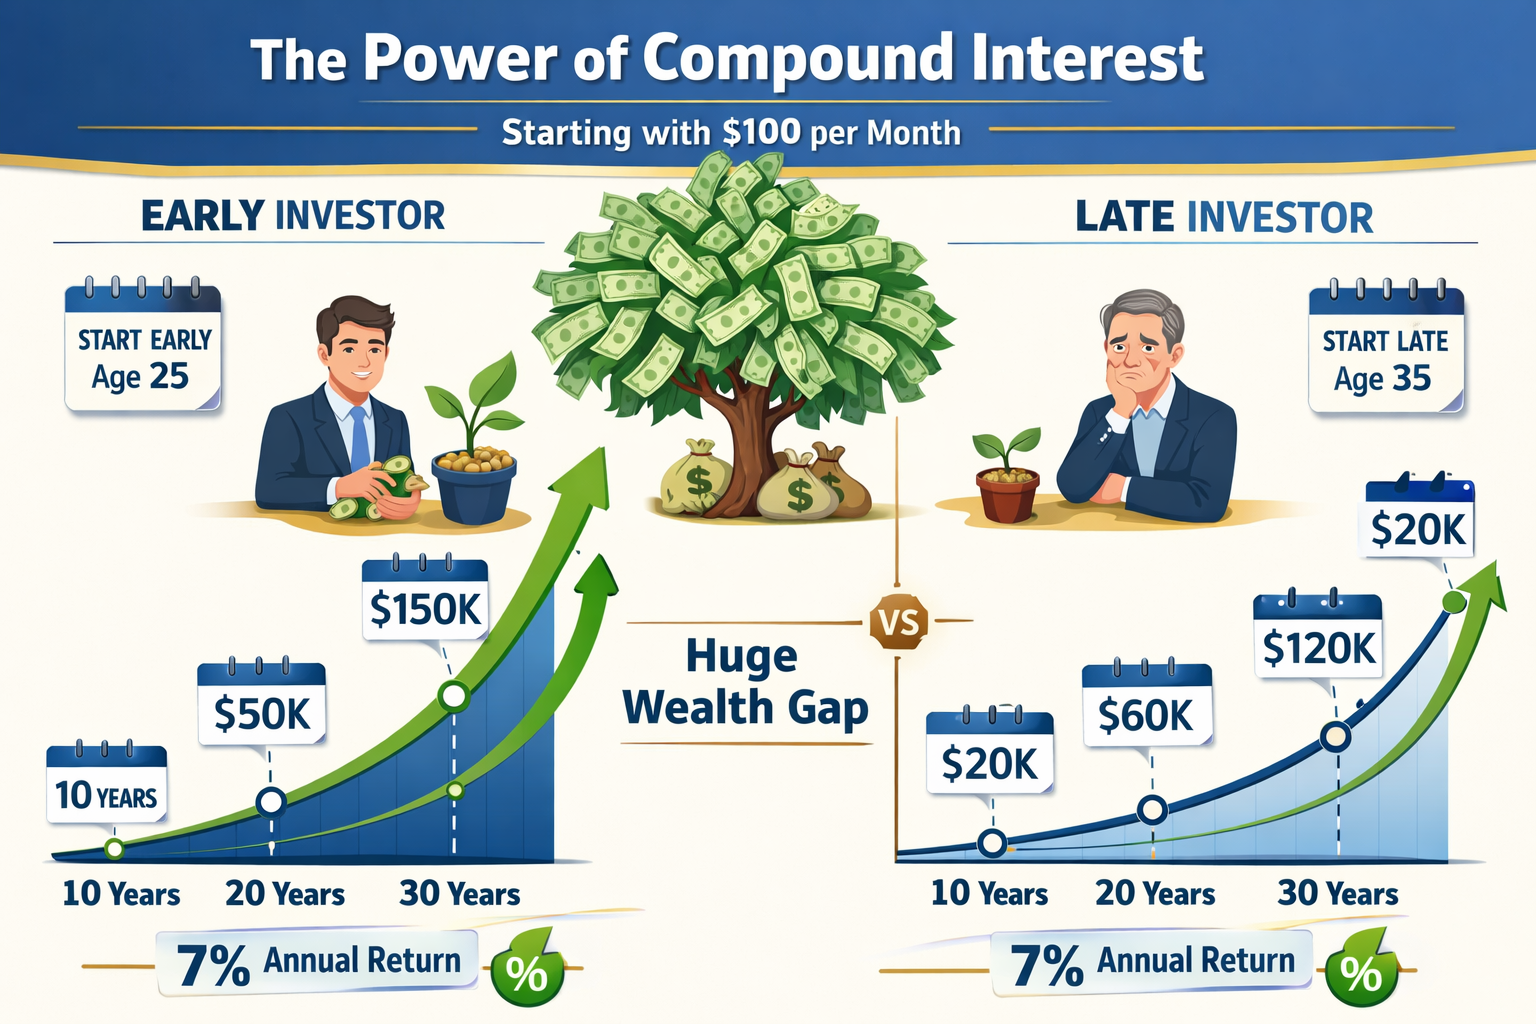
The mathematics of compound growth demonstrates why beginning investors benefit exponentially from early action. Compound interest generates returns on both principal and accumulated gains, creating a snowball effect that accelerates wealth accumulation over decades.
Time amplifies returns through exponential growth. An investor who contributes $500 monthly starting at age 25 accumulates approximately $1,370,000 by age 65 (assuming 7% annual returns). The same investor starting at age 35 accumulates only $611,000—less than half the final amount, despite contributing for only 10 fewer years.
The mathematical explanation reveals why: early contributions experience more compounding periods. Each dollar invested at age 25 compounds for 40 years, while dollars invested at age 35 compound for only 30 years. This 10-year difference creates a $759,000 wealth gap.
Market participation builds financial literacy and behavioral discipline. Beginning investors develop crucial skills through direct experience: evaluating risk-return tradeoffs, managing emotional responses to volatility, and distinguishing between speculation and evidence-based investing. These competencies cannot be learned theoretically—they require practical application.
Early investing also establishes systematic wealth-building habits. Automated monthly contributions become routine expenses, similar to rent or utilities. This behavioral framework prevents lifestyle inflation and ensures consistent capital allocation toward long-term goals.
Inflation erodes the purchasing power of uninvested cash. Money held in checking accounts loses approximately 2-3% of real value annually due to inflation. Over 30 years, $10,000 in cash diminishes to roughly $4,120 in purchasing power. The same amount invested at 7% annual returns grows to approximately $76,123, demonstrating the opportunity cost of delayed action.
Learn more about the mechanics of exponential growth in our guide to compound interest.
Insight: Starting early matters more than starting with large amounts. Consistent $200 monthly contributions beginning at age 25 outperform $500 monthly contributions beginning at age 40, despite lower total contributions.
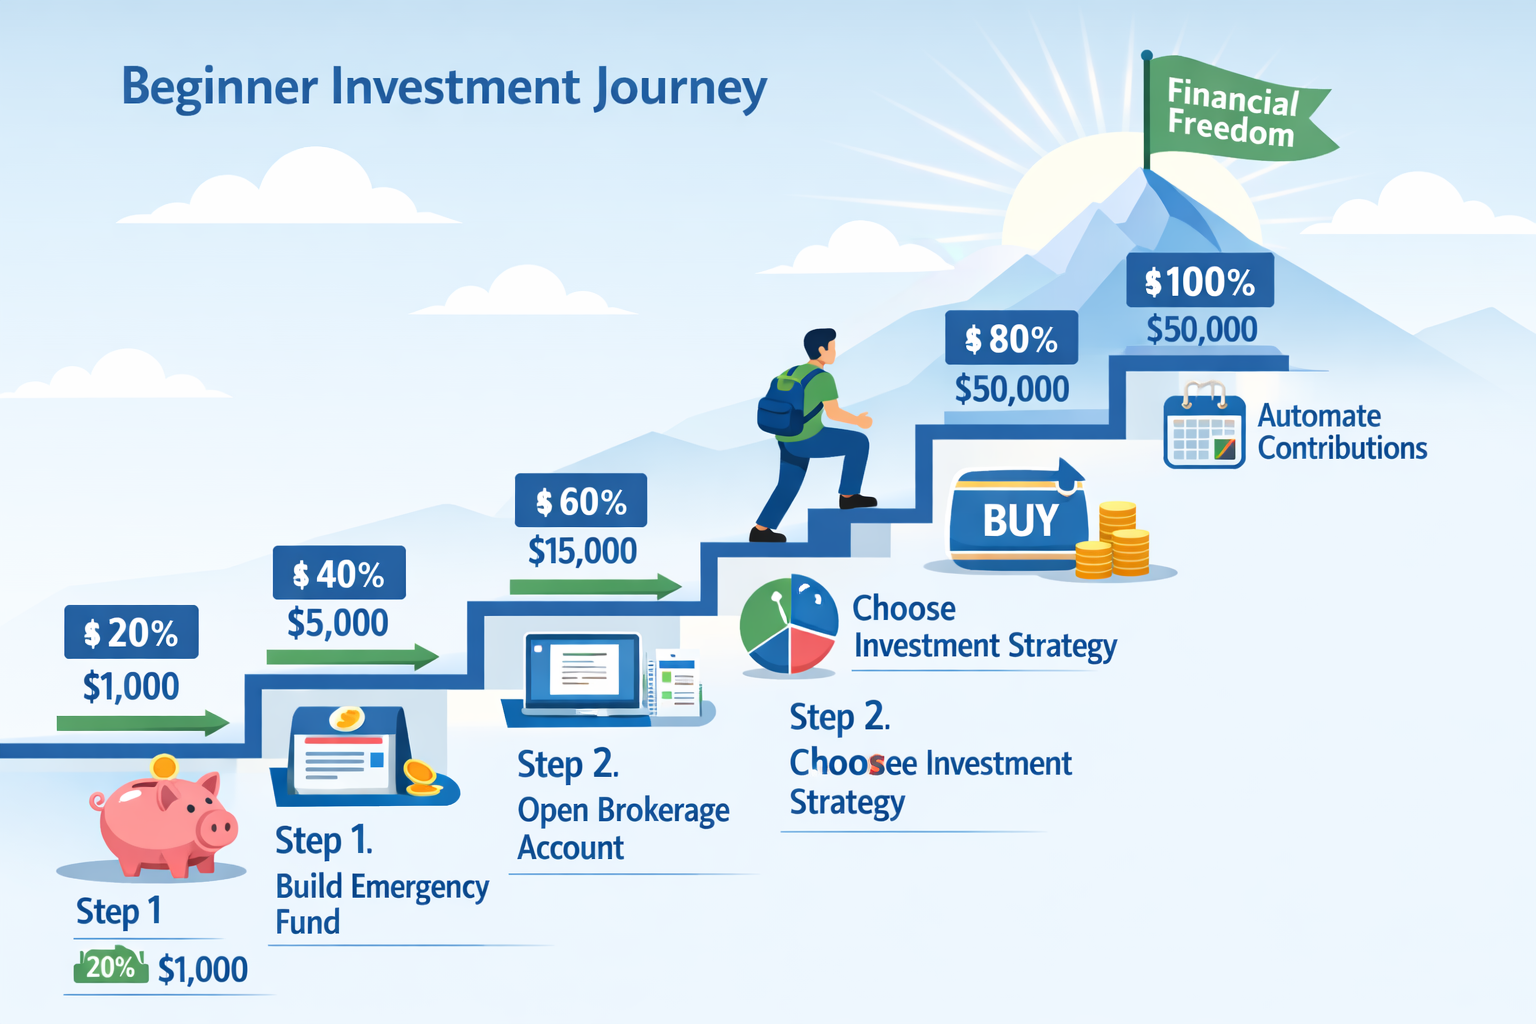
Step 1: Set Your Financial Foundation Before Investing
Successful investing requires financial stability that prevents forced asset liquidation during market downturns or personal emergencies. Building this foundation involves three sequential priorities: budgeting, emergency savings, and debt management.
Establish a Functional Budget
A budget quantifies income, fixed expenses, variable costs, and available capital for investing. The 50/30/20 rule provides a simple framework: allocate 50% of after-tax income to needs, 30% to wants, and 20% to savings and investments.
This allocation ensures consistent cash flow toward wealth building while maintaining lifestyle quality. Investors who skip budgeting often overcommit capital to investments, then face liquidity crises that force premature selling—frequently during market downturns when losses are realized.
Track actual spending for 60-90 days to identify patterns. Most beginning investors discover that 10-20% of expenses provide minimal value and can be redirected toward investing without lifestyle degradation.
Build an Emergency Fund
An emergency fund provides 3-6 months of essential expenses in liquid, accessible accounts. This cash reserve prevents the need to sell investments during market downturns, job loss, or unexpected expenses.
Calculate your emergency fund target: Multiply monthly essential expenses (housing, utilities, food, insurance, minimum debt payments) by 3-6 months. A household with $3,000 in monthly essentials requires $9,000-$18,000 in emergency savings.
Store emergency funds in high-yield savings accounts earning 4-5% annual interest (2026 rates). These accounts provide FDIC insurance, same-day access, and modest returns that partially offset inflation.
Why this matters: During the 2020 market crash, investors without emergency funds sold stocks at 30-40% losses to cover expenses. Those with adequate cash reserves maintained positions and recovered fully within 18 months, then continued capturing subsequent gains.
For a broader context, see our comprehensive guide on emergency fund basics.
Address High-Interest Debt
Debt with interest rates exceeding expected investment returns destroys wealth through negative arbitrage. Credit card debt at 18-24% APR costs more than typical stock market returns (7-10% annually), making debt repayment the highest-return “investment” available.
Prioritization framework:
- Pay off immediately: Credit cards, payday loans, personal loans above 10% APR
- Evaluate case-by-case: Auto loans (4-8%), student loans (4-7%)
- Consider investing instead: Mortgages below 4%, federal student loans below 4%
The mathematical logic: paying off 20% APR debt guarantees a 20% return, while stock market returns average 7-10% with significant volatility and no guarantees. Debt repayment provides risk-free returns exceeding nearly all investment opportunities.
Exception: Employer 401(k) matching represents immediate 50-100% returns and should be captured even while carrying moderate debt. Contribute enough to receive a full employer match, then prioritize high-interest debt elimination.
Explore debt management strategies in our credit and debt guide.
Critical Point: Never invest borrowed money or funds needed within 3-5 years. Market volatility can destroy capital precisely when needed, forcing losses and financial instability.
Step 2: Understand Your Investment Options
Investment vehicles differ in risk profiles, return characteristics, liquidity, and tax treatment. Beginning investors should understand core asset classes before allocating capital.
Stocks (Individual Equities)
Stocks represent fractional ownership in corporations. Shareholders earn returns through price appreciation and dividends. Stock prices fluctuate based on company performance, industry trends, economic conditions, and market sentiment.
Return characteristics: Historical average annual returns of 10% (S&P 500, 1926-2026), with significant year-to-year volatility. Individual stocks carry company-specific risk—business failures can result in 100% capital loss.
Risk profile: High volatility, high potential returns. Single-stock positions concentrate risk; diversification across 20+ stocks reduces company-specific risk while maintaining market exposure.
Best for: Investors who understand financial statement analysis, valuation principles, and industry dynamics. Beginning investors should prioritize diversified funds over individual stock selection.
Exchange-Traded Funds (ETFs)
ETFs are investment funds that trade on stock exchanges like individual stocks. Most ETFs track market indices, providing instant diversification across hundreds or thousands of securities.
Return characteristics: Mirror underlying index performance minus small expense ratios (0.03-0.20% annually for broad market ETFs). An S&P 500 ETF delivers approximately the same returns as the S&P 500 index.
Risk profile: Diversification reduces individual security risk. Market risk remains—broad market ETFs decline during recessions and bear markets but recover over long time horizons.
Cost advantage: Expense ratios of 0.03-0.10% for index ETFs mean $10,000 invested pays only $3-$10 annually in fees, compared to 1-2% ($100-$200) for actively managed mutual funds.
Best for: Beginning investors seeking broad market exposure, low costs, and minimal maintenance. Best ETFs to buy include total market funds (VTI, ITOT) and S&P 500 funds (VOO, SPY, IVV).
Mutual Funds
Mutual funds pool investor capital to purchase diversified portfolios managed by professional fund managers. Unlike ETFs, mutual funds trade once daily after market close at net asset value (NAV).
Return characteristics: Vary by fund strategy. Index mutual funds mirror benchmark performance; actively managed funds attempt to outperform benchmarks through security selection.
Cost consideration: Expense ratios range from 0.05% (index funds) to 2.0%+ (active funds). Higher fees directly reduce net returns—a 1% expense ratio costs $100,000 over 30 years on a $10,000 initial investment growing at 7% annually.
Performance data: Approximately 85-90% of actively managed funds underperform their benchmark indices over 15-year periods, according to S&P Dow Jones Indices SPIVA reports.[1] This underperformance stems from fees, transaction costs, and difficulty consistently predicting market movements.
Best for: Investors with access to low-cost index mutual funds through employer retirement plans. Avoid high-fee actively managed funds unless specific evidence demonstrates consistent outperformance. See our full guide on mutual funds
Bonds (Fixed Income)
Bonds are debt instruments where investors loan money to governments or corporations in exchange for regular interest payments and principal repayment at maturity.
Return characteristics: Lower returns than stocks (3-5% annually for investment-grade bonds) with lower volatility. Bond prices move inversely to interest rates—when rates rise, existing bond prices fall.
Risk profile: Credit risk (issuer default), interest rate risk (price fluctuations), and inflation risk (fixed payments lose purchasing power). U.S. Treasury bonds carry minimal credit risk; corporate bonds vary by issuer’s creditworthiness.
Portfolio role: Bonds reduce overall portfolio volatility and provide income. A 60% stock / 40% bond portfolio experiences smaller drawdowns during market crashes than 100% stock portfolios, though with lower long-term returns.
Best for: Investors nearing retirement or those requiring income and capital preservation. Beginning investors with 30+ year time horizons typically allocate 80-100% to stocks for maximum growth potential.
Index Funds vs Active Funds
The evidence overwhelmingly supports passive index investing for most investors. Index funds simply replicate market indices, capturing market returns at minimal cost. Active funds employ managers who attempt to beat markets through security selection and timing.
Performance comparison: Over 15-year periods ending 2025, 92% of large-cap active funds underperformed the S&P 500 index.[1] This pattern persists across asset classes and time periods, demonstrating the difficulty of consistent outperformance.
Cost difference: Index funds charge 0.03-0.15% expense ratios; active funds charge 0.75-2.0%. On a $100,000 portfolio over 30 years, this fee difference costs approximately $150,000-$300,000 in lost compound growth.
Tax efficiency: Index funds generate fewer taxable events through lower turnover (buying and selling). Active funds frequently realize capital gains distributed to shareholders as taxable income, reducing after-tax returns.
Explore top-performing options in our guide to the best index funds.
Takeaway: Beginning investors should build core portfolios using low-cost, broad-market index ETFs or mutual funds. Individual stocks and active funds introduce unnecessary complexity, higher costs, and statistically lower returns.
Step 3: Open the Right Brokerage Account
Investment accounts differ in tax treatment, contribution limits, withdrawal rules, and eligibility requirements. Selecting appropriate account types significantly impacts long-term wealth accumulation through tax savings.
Tax-Advantaged Retirement Accounts
Tax-advantaged accounts provide either tax-deferred growth or tax-free withdrawals, accelerating wealth building compared to taxable accounts.
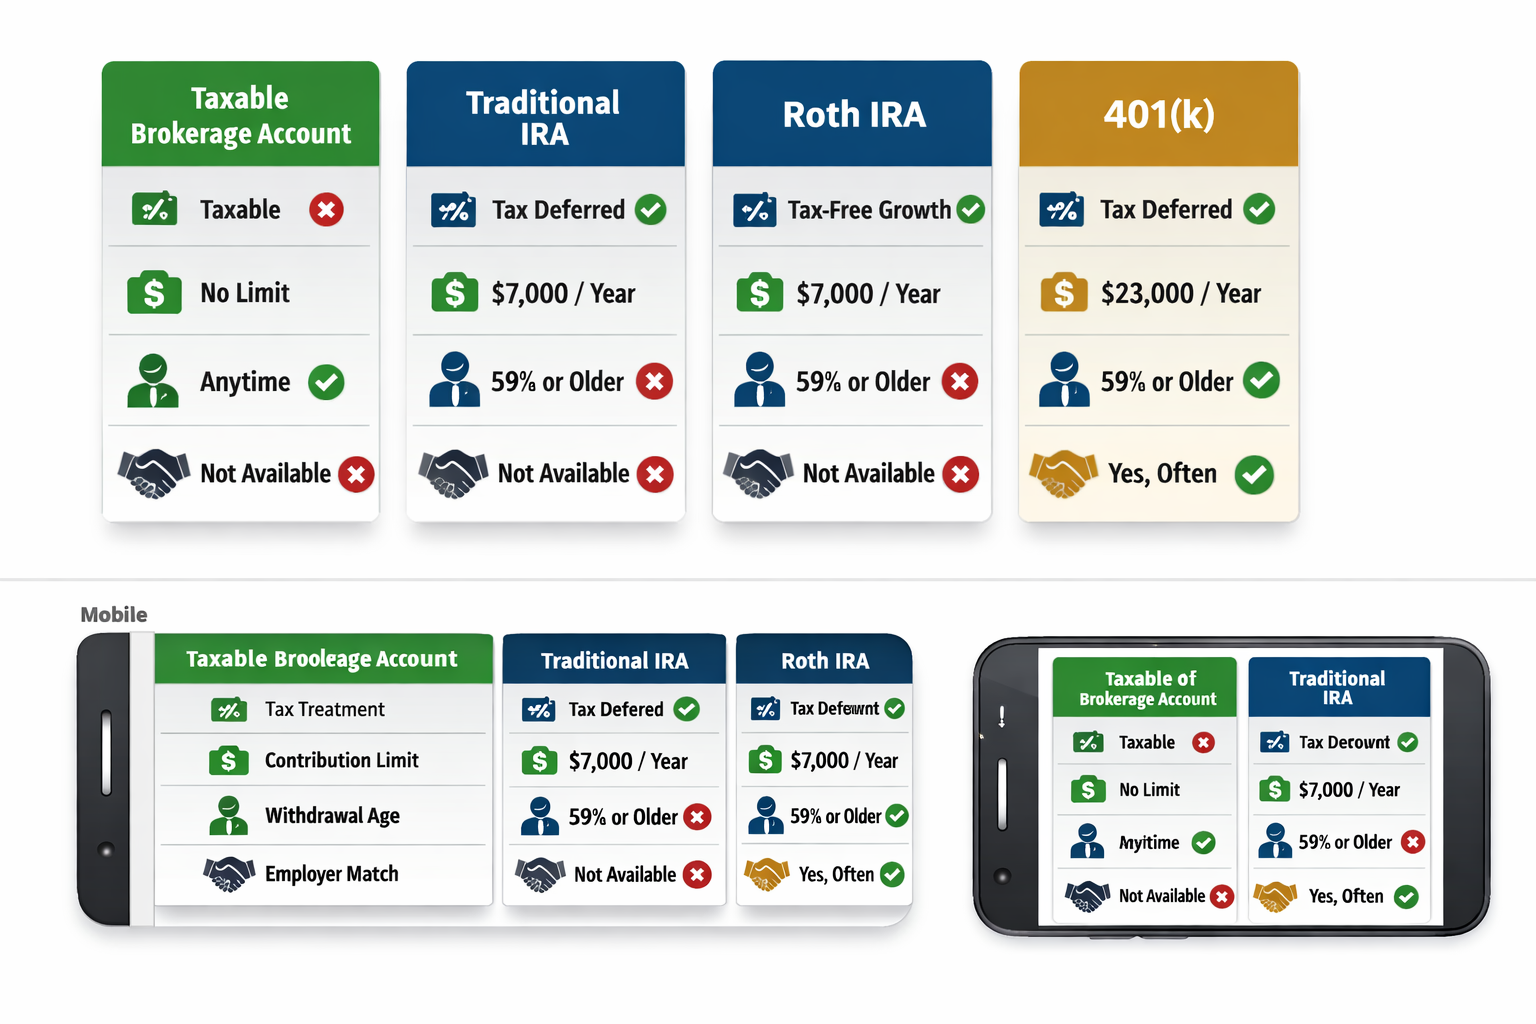
Roth IRA
Contributions use after-tax dollars; growth and qualified withdrawals are completely tax-free. This structure benefits investors who expect higher tax rates in retirement or value tax-free income flexibility.
2026 Contribution limits: $7,000 annually ($8,000 for ages 50+). Income limits phase out contribution eligibility for high earners (modified adjusted gross income above $146,000 single, $230,000 married filing jointly).
Withdrawal rules: Contributions can be withdrawn anytime, tax-free and penalty-free. Earnings withdrawals before age 59½ incur 10% penalties plus income tax unless exceptions apply (first home purchase, qualified education expenses).
Tax advantage: A $7,000 annual contribution growing at 7% for 30 years reaches $710,000—completely tax-free at withdrawal. The same investment in a taxable account generates approximately $150,000-$200,000 in capital gains taxes (assuming 20-25% tax rates), reducing net proceeds to $510,000-$560,000.
Best for: Beginning investors in lower tax brackets who expect income growth, young professionals with 30+ year time horizons, and anyone valuing tax-free retirement income.
Traditional IRA
Contributions may be tax-deductible (reducing current taxable income); growth is tax-deferred; withdrawals are taxed as ordinary income.
2026 Contribution limits: $7,000 annually ($8,000 for ages 50+). Deduction limits phase out for individuals covered by workplace retirement plans earning above certain thresholds.
Tax advantage: Immediate tax deduction reduces the current tax bill. A $7,000 contribution saves $1,540 in taxes for someone in the 22% bracket. However, all withdrawals face ordinary income tax, potentially at higher rates.
Required Minimum Distributions (RMDs): Must begin withdrawals at age 73, forcing taxable income regardless of need.
Best for: Investors in high current tax brackets expecting lower retirement tax rates, those maximizing immediate tax deductions.
401(k) and 403(b) Plans
Employer-sponsored retirement plans offering traditional (pre-tax) or Roth (after-tax) contribution options. Many employers match contributions—free money that immediately boosts returns.
2026 Contribution limits: $23,500 annually ($31,000 for ages 50+). Employer matches don’t count toward employee limits.
Employer match: Typical matches range from 3-6% of salary. A 50% match on 6% contributions equals 3% of salary in free money—an immediate 50% return on contributed amounts.
Investment options: Limited to plan offerings, typically 10-30 mutual funds. Expense ratios vary by plan quality; prioritize low-cost index funds when available.
Best for: All employees with access—always contribute enough to capture the full employer match before contributing to IRAs or taxable accounts.
Taxable Brokerage Accounts
Standard investment accounts with no contribution limits, no withdrawal restrictions, and no special tax treatment. Investment gains incur capital gains taxes; dividends and interest are taxed as received.
Tax treatment: Long-term capital gains (assets held 12+ months) taxed at 0%, 15%, or 20% based on income. Short-term gains (under 12 months) are taxed as ordinary income at higher rates.
Advantages: Complete flexibility—no contribution limits, no age restrictions on withdrawals, no required distributions. Ideal for goals with timelines under retirement age (home purchase, business funding).
Tax efficiency strategies: Hold tax-efficient investments (index ETFs, growth stocks) in taxable accounts; hold tax-inefficient investments (bonds, REITs, dividend stocks) in retirement accounts.
Best for: Investors who maximize tax-advantaged space, those saving for pre-retirement goals, and high earners exceeding IRA income limits.
Choosing a Brokerage Platform
Major brokerages offer commission-free stock and ETF trading, making cost differences minimal. Selection criteria include account minimums, research tools, customer service, and available investments.
Top platforms for beginners (2026):
- Fidelity: No account minimums, excellent research tools, strong customer service, extensive fund selection
- Charles Schwab: Robust platform, comprehensive educational resources, no account minimums, excellent mobile app
- Vanguard: Industry-low expense ratios on proprietary funds, investor-owned structure aligns incentives, ideal for buy-and-hold index investors
Robo-advisors: Automated platforms like Betterment and Wealthfront provide algorithm-driven portfolio management, automatic rebalancing, and tax-loss harvesting for 0.25-0.50% annual fees. Suitable for hands-off investors willing to pay for convenience. Compare options in our best robo-advisors guide.
Account opening process: Requires personal information (Social Security number, employment details), bank account for transfers, and 10-20 minutes to complete applications. Most platforms approve accounts within 1-2 business days.
Action Step: Open a Roth IRA first if eligible (provides maximum flexibility and tax-free growth). Contribute to the employer’s 401(k) up to the match amount. Open a taxable brokerage account for additional savings beyond tax-advantaged limits.
Step 4: Choose Your Investment Strategy
Investment strategies define how capital is allocated, when purchases occur, and how portfolios are managed over time. Beginning investors benefit from simple, evidence-based approaches that minimize complexity and emotional decision-making.
Dollar-Cost Averaging (DCA)
Dollar-cost averaging invests fixed amounts at regular intervals regardless of market conditions. This approach reduces timing risk and builds consistent investing habits.
Mechanics: Invest $500 monthly on the 1st of each month. When prices are high, $500 purchases fewer shares. When prices are low, $500 purchases more shares. Over time, this averages purchase prices across market cycles.
Mathematical advantage: DCA eliminates the need to predict market timing—a skill even professional investors rarely demonstrate consistently. Studies show market timing attempts typically underperform consistent investment schedules.
Behavioral benefit: Automated monthly contributions remove emotional decision-making. Investors avoid paralysis during volatility (“Should I wait for a better price?”) and maintain discipline during euphoric markets (“Should I invest more now?”).
Performance comparison: A lump-sum investment theoretically outperforms DCA approximately 66% of the time because markets trend long-term.[2] However, DCA provides superior risk-adjusted returns and psychological comfort for investors who cannot tolerate watching lump sums decline 20-30% during market corrections.
Best for: Beginning investors building positions over time, anyone receiving regular income (salaries), and investors who experience anxiety about market timing. See our full guide on Dollar-Cost Averaging (DCA) strategies.
Buy and Hold (Long-Term Investing)
Buy and hold strategies purchase quality investments and maintain positions for years or decades, ignoring short-term volatility. This approach captures long-term market growth while minimizing transaction costs and taxes.
Historical evidence: The S&P 500 has delivered positive returns over 88% of all 10-year periods and 100% of all 20-year periods since 1926.[3] Short-term volatility is severe—annual returns range from -43% to +54%—but long holding periods smooth this volatility into consistent gains.
Tax efficiency: Holding investments 12+ months qualifies for long-term capital gains rates (0-20%) versus ordinary income rates (10-37%) on short-term trades. Additionally, unrealized gains compound tax-free until sale.
Cost savings: Frequent trading generates commission costs (if applicable), bid-ask spreads, and tax events. Buy-and-hold investors avoid these friction costs, improving net returns.
Compound growth: Reinvested dividends purchase additional shares, which generate their own dividends, creating exponential growth. A $10,000 investment in the S&P 500 in 1990 grew to approximately $210,000 by 2026 with dividends reinvested—versus $95,000 without reinvestment.
Best for: Investors with 10+ year time horizons, those seeking to minimize taxes and costs, and anyone lacking time or interest in active management.
Asset Allocation and Diversification
Asset allocation divides capital across asset classes (stocks, bonds, real estate) to balance risk and return. Diversification spreads investments within asset classes to reduce individual security risk.
Age-based allocation: A common rule suggests bond allocation equal to age (a 25-year-old holds 25% bonds, 75% stocks). This gradually reduces volatility as retirement approaches and the time to recover from market crashes diminishes.
Risk tolerance adjustment: Aggressive investors with high risk tolerance and long time horizons may hold 90-100% stocks. Conservative investors or those nearing retirement may hold 40-60% bonds for stability.
Diversification across sectors: Broad market index funds automatically diversify across technology, healthcare, finance, consumer goods, energy, and other sectors. This prevents concentration risk—if one sector crashes, others may remain stable or grow.
Geographic diversification: International stocks provide exposure to non-U.S. economic growth. A total world stock fund (like VT) allocates approximately 60% U.S. and 40% international, capturing global growth opportunities.
Sample beginner portfolio (age 25-35, moderate risk):
- 70% U.S. total stock market ETF (VTI)
- 20% International stock ETF (VXUS)
- 10% Bond ETF (BND)
This allocation provides growth potential through stocks while bonds reduce overall volatility. As investors age, gradually increase bond allocation by 5-10% per decade.
Dividend Investing
Dividend strategies focus on stocks or funds that distribute regular cash payments to shareholders. Dividends provide income and can be reinvested to purchase additional shares.
Dividend growth: Quality dividend stocks increase payments annually, providing inflation protection and growing income streams. Dividend aristocrats (S&P 500 companies with 25+ consecutive years of dividend increases) have historically outperformed the broader market with lower volatility.
Dividend yield: Calculated as annual dividend divided by stock price. A $100 stock paying $3 annually has a 3% yield. High yields (6%+) may signal financial distress; sustainable yields typically range 2-4%.
Tax consideration: Qualified dividends receive preferential tax rates (0-20%) similar to long-term capital gains. Non-qualified dividends are taxed as ordinary income.
ETF options: Dividend-focused ETFs like VYM, SCHD, and VIG provide diversified exposure to dividend-paying stocks. Explore options in our best dividend ETF guide.
Best for: Investors seeking income, retirees requiring cash flow, and those who value the psychological comfort of regular payments.
Growth Investing
Growth strategies target companies expected to increase earnings faster than market averages. Growth stocks typically reinvest profits into expansion rather than paying dividends.
Characteristics: Higher price-to-earnings ratios, strong revenue growth, innovative products or services, often in technology or healthcare sectors.
Return profile: Higher potential returns with higher volatility. Growth stocks outperform during economic expansions but often decline more severely during recessions.
Risk factors: Valuations depend on future growth expectations; disappointing results trigger sharp price declines. Concentration in technology sectors creates sector-specific risk.
Best for: Younger investors with long-term horizons, those comfortable with volatility, and investors seeking maximum long-term appreciation over current income.
Strategy Summary: Beginning investors should start with broad-market index funds using dollar-cost averaging. This combination provides diversification, minimizes costs, eliminates timing risk, and captures market returns with minimal complexity.
Step 5: Start Small and Stay Consistent
Beginning investors need not wait for large capital accumulation. Small, consistent contributions compound into substantial wealth through disciplined execution over decades.
Minimum Investment Amounts
Most brokerages eliminated account minimums and allow fractional share purchases, enabling investing with any amount. Investors can begin with $50, $100, or $500—the starting amount matters far less than consistency.
Fractional shares: Technology allows purchasing portions of expensive stocks. An investor with $100 can buy 0.1 shares of a $1,000 stock, enabling diversification regardless of capital.
Minimum practical amount: While any amount works technically, $100-$500 monthly contributions generate meaningful wealth accumulation. A $200 monthly investment growing at 7% annually reaches $244,000 in 30 years.
The Power of Consistency
Regular contributions matter more than contribution size. An investor contributing $300 monthly for 30 years accumulates more wealth than someone contributing $1,000 monthly for 10 years, despite lower total contributions ($108,000 vs. $120,000).
Mathematical explanation: The $300 monthly investor benefits from 20 additional years of compound growth. Early contributions compound longer, generating exponentially larger final amounts.
Behavioral advantage: Monthly automation removes decision-making. Set up automatic transfers from checking to investment accounts on payday—investing becomes as routine as rent payments.
Market timing irrelevance: Consistent investing captures market averages across all conditions. Investors who wait for “the right time” typically miss years of gains while markets trend upward.
Risk Management Through Position Sizing
Never invest money needed within 3-5 years. Market volatility can reduce portfolio values 20-40% during recessions; recovery requires time. Capital needed for near-term goals (home down payment, emergency expenses, tuition) should remain in savings accounts or short-term bonds.
Risk capacity assessment: Determine how much capital can be invested based on income stability, emergency fund adequacy, and time horizon. A secure job, 6-month emergency fund, and 20-year time horizon support aggressive stock allocation.
Gradual position building: New investors often benefit from gradual entry—invest 25% of available capital immediately, then dollar-cost average the remainder over 6-12 months. This balances immediate market exposure with reduced timing risk.
Rebalancing and Portfolio Maintenance
Portfolio allocations drift over time as different assets grow at different rates. A 70/30 stock/bond portfolio may become 80/20 after a strong stock market year.
Rebalancing frequency: Annual or semi-annual rebalancing maintains target allocations. Sell overweight assets, buy underweight assets to return to target percentages.
Tax considerations: Rebalance within tax-advantaged accounts to avoid capital gains taxes. In taxable accounts, rebalance by directing new contributions toward underweight assets rather than selling.
Automatic rebalancing: Many robo-advisors and target-date funds automatically rebalance, eliminating this maintenance task.
Tracking Progress
Monitor portfolio performance quarterly or annually—not daily. Short-term volatility creates anxiety without providing actionable information. Focus on contribution consistency and long-term trajectory.
Meaningful metrics:
- Total portfolio value growth
- Contribution consistency (did you invest target amounts?)
- Asset allocation alignment with targets
- Expense ratio maintenance (below 0.20% for core holdings)
Ignore meaningless metrics:
- Daily price changes
- Comparison to individual stocks or sectors
- Short-term outperformance or underperformance of benchmarks
Progress Indicator: After one year of $500 monthly contributions at 7% returns, expect approximately $6,200-$6,400 in portfolio value. After five years, expect $35,000-$36,000. After ten years, expect $86,000-$88,000. These benchmarks confirm you’re on track.
Common Mistakes Beginning Investors Make
Understanding typical errors helps new investors avoid costly mistakes that delay wealth building or destroy capital.
Emotional Decision-Making
Fear and greed drive poor investment decisions. Investors sell during market crashes (realizing losses) and buy during euphoric peaks (purchasing overvalued assets). This behavior guarantees buying high and selling low—the opposite of profitable investing.
Market crash behavior: During the March 2020 crash, markets declined 34% in 23 days. Investors who sold realized permanent losses. Those who maintained positions recovered fully within five months and captured subsequent 100%+ gains through 2021.
Solution: Establish investment plans during calm markets, then execute mechanically regardless of emotions. Dollar-cost averaging continues through volatility, automatically buying more shares when prices fall.
Overtrading and Excessive Activity
Frequent buying and selling generate transaction costs, taxes, and typically underperform buy-and-hold strategies. Studies show individual investors who trade most frequently earn the lowest returns.[4]
Causes: Boredom, overconfidence, misunderstanding of value creation. Trading feels productive, but it usually destroys value through costs and poor timing.
Solution: Implement buy-and-hold strategies with predetermined rebalancing schedules. Limit portfolio checks to monthly or quarterly intervals.
Ignoring Fees and Expenses
Expense ratios, management fees, and advisor commissions directly reduce returns. A 1% annual fee costs approximately 25% of portfolio value over 30 years through lost compound growth.
Fee comparison: A $10,000 investment growing at 7% for 30 years reaches $76,123. The same investment with 1% annual fees reaches only $57,435—a $18,688 (24.5%) reduction.
Solution: Prioritize investments with expense ratios below 0.20%. Avoid funds charging 1%+ unless they demonstrate consistent, significant outperformance (rare). Question advisor fees above 0.50% annually.
Lack of Diversification
Concentrated positions in single stocks, sectors, or asset classes create unnecessary risk. Individual company failures, sector downturns, or regional recessions can destroy substantial capital.
Historical examples: Enron shareholders lost 100% of their investments when the company collapsed in 2001. Technology investors holding only tech stocks lost 78% during the 2000-2002 crash, while diversified investors lost approximately 45%.
Solution: Use broad-market index funds covering hundreds or thousands of securities. Limit individual stock positions to 5-10% of portfolio maximum.
Chasing Performance
Investors frequently purchase last year’s top-performing funds or stocks, assuming past performance continues. This behavior typically results in buying overvalued assets before reversion to mean returns.
Performance data: Funds in the top performance quartile over 5 years have only a 20% probability of remaining in the top quartile over the subsequent 5 years.[5] Past performance provides minimal predictive value.
Solution: Select investments based on cost, diversification, and alignment with strategy—not recent returns. Avoid “hot” stocks or sectors receiving excessive media attention.
Neglecting Tax Efficiency
Failing to utilize tax-advantaged accounts or holding tax-inefficient investments in taxable accounts unnecessarily increases tax bills and reduces wealth accumulation.
Tax drag: A taxable account investor earning 7% annual returns pays approximately 1.5-2% annually in taxes on dividends and realized gains, reducing net returns to 5-5.5%. The same investments in a Roth IRA generate 7% tax-free returns—a 1.5-2% annual advantage that compounds to hundreds of thousands of dollars over decades.
Solution: Maximize contributions to Roth IRAs and 401(k)s before using taxable accounts. Hold tax-inefficient assets (bonds, REITs, actively managed funds) in retirement accounts; hold tax-efficient assets (index ETFs, growth stocks) in taxable accounts.
Timing the Market
Attempting to predict market tops and bottoms to optimize entry and exit points rarely succeeds and typically reduces returns compared to consistent investing.
Statistical reality: Missing just the 10 best market days over 30 years reduces returns by approximately 50%. Since best days often occur during volatile periods (near market bottoms), market timers frequently miss these crucial rebounds.
Solution: Implement dollar-cost averaging and maintain positions through volatility. Accept that optimal timing is impossible; consistent participation captures long-term growth.
Avoidance Strategy: Create a written investment policy statement defining strategy, asset allocation, rebalancing schedule, and decision rules. Reference this document during market volatility to prevent emotional deviations.
Tools and Resources for Beginning Investors
Leverage available tools to simplify investing, track progress, and deepen financial understanding.
Investment Calculators
Mathematical tools demonstrate the long-term impact of contributions, returns, and time horizons. Use our compound interest calculator to model different scenarios and visualize wealth accumulation trajectories.
Retirement calculator: Projects required savings rates to achieve retirement income goals. Input current age, retirement age, desired income, and expected returns to determine monthly contribution needs. Use our Retirement calculator to know the amount to invest.
Asset allocation calculator: Recommends stock/bond splits based on age, risk tolerance, and time horizon. Provides starting points for portfolio construction.
Educational Resources
SEC Investor Education: The U.S. Securities and Exchange Commission provides free, authoritative resources explaining investment products, risks, and regulations at investor.gov.
FINRA: Financial Industry Regulatory Authority offers investor alerts, market data, and broker verification tools at finra.org.
Academic research: Read papers from the Journal of Finance, Financial Analysts Journal, and similar publications for evidence-based insights into market behavior and investment strategies.
Portfolio Tracking Tools
Brokerage platforms: All major brokerages provide portfolio tracking, performance reporting, and tax documentation. These built-in tools suffice for most investors.
Third-party aggregators: Personal Capital and Mint consolidate accounts from multiple institutions, providing comprehensive net worth tracking and spending analysis.
Spreadsheet tracking: Simple spreadsheets recording monthly contributions, portfolio values, and asset allocations enable customized tracking and historical analysis.
Continuing Education
Financial literacy improves investment outcomes through better decision-making and reduced susceptibility to scams or poor advice. Explore our financial literacy resources for ongoing education.
Books: “A Random Walk Down Wall Street” by Burton Malkiel, “The Intelligent Investor” by Benjamin Graham, and “Common Sense on Mutual Funds” by John Bogle provide foundational knowledge.
Podcasts: Evidence-based shows like “Rational Reminder” and “The Investor’s Podcast” explain financial concepts and market dynamics without promotional content.
Tool Recommendation: Start with your brokerage’s built-in tools for tracking and research. Add specialized calculators for specific planning needs. Avoid paying for premium tools until you’ve maximized free resources.
How to Start Investing as a Beginner: Your Action Plan
Implementing the concepts covered requires a systematic approach. Follow this sequential action plan to begin investing with confidence.
Week 1: Financial Foundation Assessment
- Track all expenses for 7 days to understand spending patterns
- Calculate monthly essential expenses (housing, utilities, food, insurance, minimum debt payments)
- Determine emergency fund target (3-6 months of essential expenses)
- List all debts with interest rates and minimum payments
- Identify available monthly capital for investing after expenses and emergency fund contributions
Week 2: Account Selection and Opening
- Research brokerage platforms (Fidelity, Schwab, Vanguard)
- Open Roth IRA if eligible (income below $146,000 single, $230,000 married)
- Enroll in an employer 401(k) if available; set contribution to capture the full match
- Link the bank account to investment accounts for transfers
- Enable two-factor authentication for account security
Week 3: Investment Selection
- Select 2-3 low-cost index ETFs or mutual funds:
- U.S. total market fund (VTI, FSKAX, or equivalent)
- International fund (VXUS, FTIHX, or equivalent)
- Bond fund if desired (BND, FXNAX, or equivalent)
- Verify expense ratios below 0.20%
- Review fund holdings and strategy to ensure understanding
- Determine target asset allocation based on age and risk tolerance
Week 4: Execute First Investment
- Transfer the initial investment amount to the brokerage account
- Purchase selected funds according to the target allocation
- Set up automatic monthly contributions from a bank account
- Enable dividend reinvestment (DRIP) for all holdings
- Schedule an annual calendar reminder for portfolio review and rebalancing
Ongoing: Maintain Discipline
- Continue automatic monthly contributions regardless of market conditions
- Review portfolio quarterly (not daily or weekly)
- Rebalance annually if allocations drift 5%+ from targets
- Increase contribution amounts when income rises
- Resist urges to trade, time markets, or chase performance
Checklist: Emergency fund established ✓ | High-interest debt eliminated ✓ | Retirement accounts opened ✓ | Low-cost index funds selected ✓ | Automatic contributions enabled ✓ | Dividend reinvestment activated ✓
💰 Investment Growth Calculator
See how your money grows with compound interest
Conclusion
Learning how to start investing as a beginner requires understanding the math behind compound growth, selecting appropriate account types and investment vehicles, and implementing disciplined strategies that prioritize consistency over complexity. The evidence demonstrates that simple approaches, broad-market index funds, dollar-cost averaging, buy-and-hold execution, and tax-advantaged accounts outperform sophisticated strategies for most investors.
Begin with financial foundation building: emergency savings, debt management, and budgeting. Progress to account opening and investment selection, prioritizing low-cost diversified funds. Execute through automatic contributions that continue regardless of market conditions. This systematic approach transforms earned income into growing wealth through the exponential power of compound returns over decades.
For a complete roadmap including advanced strategies, account comparisons, and investment options, explore our investing fundamentals.
References
[1] S&P Dow Jones Indices. (2025). SPIVA U.S. Scorecard Year-End 2024. S&P Global.
[2] Vanguard Research. (2024). Dollar-cost averaging just means taking less risk later. Vanguard Group.
[3] Dimensional Fund Advisors. (2025). Matrix Book 2025: Historical Returns Data. Dimensional Fund Advisors LP.
[4] Barber, B. M., & Odean, T. (2000). Trading is hazardous to your wealth: The common stock investment performance of individual investors. Journal of Finance, 55(2), 773-806.
[5] S&P Dow Jones Indices. (2024). Persistence Scorecard: Does Past Performance Matter? S&P Global.
Disclaimer
This article provides educational information about investing fundamentals and should not be construed as personalized financial advice. Investment decisions should be based on individual financial situations, risk tolerance, time horizons, and goals. All investing involves risk, including potential loss of principal. Past performance does not guarantee future results. Consult qualified financial professionals before making investment decisions. The Rich Guy Math and its authors do not provide tax, legal, or investment advisory services and are not responsible for individual investment outcomes.
Author Bio
Max Fonji is the founder of The Rich Guy Math, a data-driven financial education platform that explains the mathematical principles underlying wealth building, investing, and risk management. With expertise in financial analysis and valuation, Max translates complex financial concepts into clear, evidence-based guidance for investors seeking to understand how money actually works. His approach prioritizes mathematical logic, empirical data, and cause-and-effect relationships over speculation and emotional appeals.
Frequently Asked Questions
How much money do I need to start investing as a beginner?
Most brokerages allow account opening with a $0 minimum and support fractional share investing, which means you can start with almost any amount of money.
While you can technically begin with very little, investing $100–$500 per month creates meaningful long-term results. For example, investing $200 per month for 30 years at a 7% annual return grows to approximately $244,000.
The most important factor is consistency. Regular contributions over time matter far more than the size of your initial investment.
What is the safest way to start investing as a beginner?
The safest way to start investing combines three core principles: financial stability, diversification, and time.
- Maintain an emergency fund covering 3–6 months of expenses
- Invest in diversified, broad-market index funds
- Commit to a long-term time horizon of 10 years or more
This approach reduces the risk of selling during market downturns, limits exposure to individual company failures, and allows time for markets to recover from recessions.
Beginners should avoid individual stocks, cryptocurrency, and complex financial products until they understand risk management and valuation fundamentals.
How long before I see returns on my investments?
Investment returns are unpredictable in the short term but historically reliable over long periods. During the first 1–5 years, market volatility is common, including temporary losses of 20–40% during economic downturns.
Over 10-year periods or longer, diversified stock portfolios have historically delivered positive returns approximately 88% of the time.
Compounding accelerates significantly in later years. In many cases, total wealth growth during years 20–30 exceeds the combined growth from years 1–20.
Should I invest in individual stocks or index funds?
Most beginners should prioritize index funds rather than individual stocks for several reasons:
- Instant diversification across hundreds or thousands of companies
- Extremely low expense ratios (typically 0.03%–0.20%)
- No need for ongoing stock research or active management
- Greater tax efficiency
- Historically higher success rates than stock picking
Research shows that 85–90% of professional fund managers underperform broad-market index funds over 15-year periods. Individual investors face even lower odds of consistently outperforming the market.
Consider individual stocks only after gaining experience with financial statements, valuation techniques, and portfolio risk management.