Ever wondered how companies actually make money, or lose it? The income statement is your financial x-ray, revealing exactly where every dollar comes from and where it goes. Whether you’re analyzing stocks, running a small business, or just trying to understand how the stock market works, mastering this single document gives you superpowers in the financial world.
An income statement is a financial document that shows a company’s revenues, expenses, and profits over a specific period. In simple terms, the income statement tells you: “Here’s what we earned, here’s what we spent, and here’s what’s left over.” It’s one of the three core financial statements (alongside the balance sheet and cash flow statement) that investors, business owners, and financial analysts use to evaluate financial performance.
TL;DR
- The income statement shows profitability: It tracks revenue (money earned), expenses (money spent), and profit (what’s left) over a specific time period
- Three key components matter most: Revenue at the top, operating expenses in the middle, and net income (the “bottom line”) at the end
- Multiple profit levels tell different stories: Gross profit, operating profit, and net profit each reveal different aspects of business health
- It’s a performance report card: Unlike a balance sheet (which shows what you own), the income statement shows how well you performed during a period
- Essential for investment decisions: Understanding income statements helps you evaluate stocks and make smarter financial choices
What Exactly Is an Income Statement?
The income statement goes by several names: you might hear it called a profit and loss statement (P&L), statement of operations, or statement of earnings. Regardless of the name, it serves one primary purpose: to show whether a business made or lost money during a specific period (usually a quarter or a year).
Think of it like a report card for a company’s financial performance. Just as your school report card shows your grades in different subjects over a semester, an income statement shows a company’s “grades” in different financial categories over a specific time frame.
The Time Period Matters
Unlike a balance sheet, which provides a snapshot of financial position at a single moment in time, the income statement covers a period of time. You’ll typically see statements labeled:
- Quarterly: Three-month periods (Q1, Q2, Q3, Q4)
- Annual: Full fiscal year (often January-December, but not always)
- Year-to-date (YTD): From the beginning of the fiscal year to the current date
This time-based nature is crucial. When someone says “Apple made $100 billion,” they’re referring to revenue during a specific period shown on the income statement.
The Basic Income Statement Formula
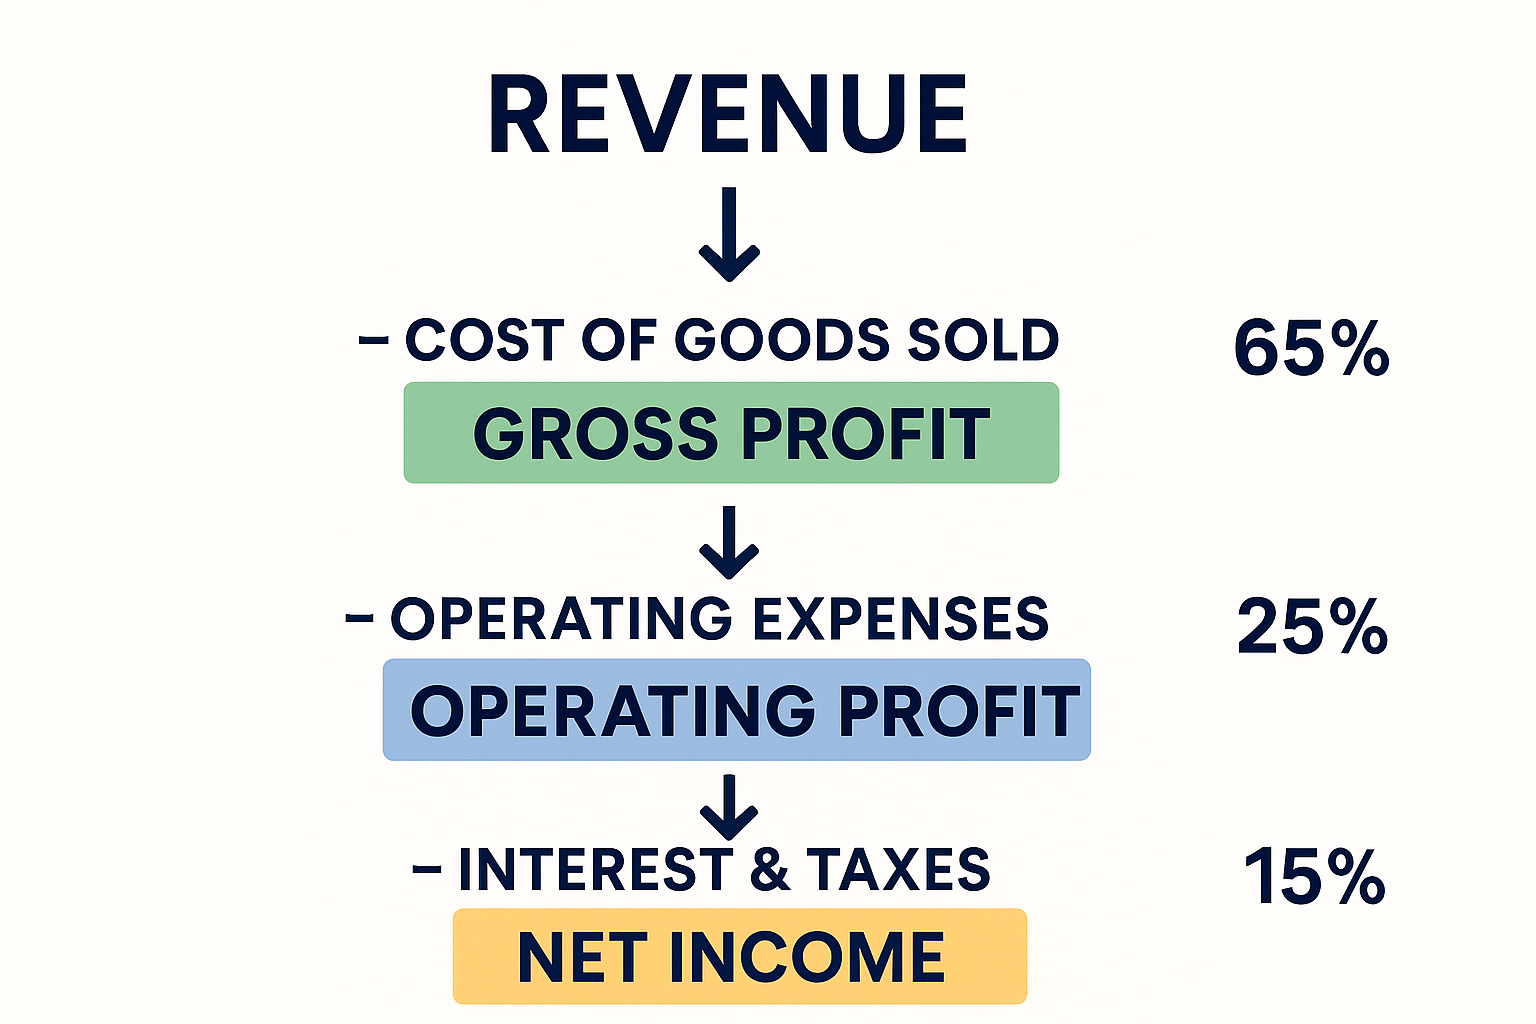
At its core, the income statement follows a beautifully simple formula:
Revenue – Expenses = Profit
That’s it! Everything else is just breaking down these three components into more detailed categories. Let’s explore each piece.
Revenue: The Top Line
Revenue (also called sales or income) represents the total amount of money a company brings in from its business activities. This appears at the very top of the income statement, which is why you’ll often hear it called the “top line.”
Revenue can come from various sources:
- Product sales: Physical goods sold to customers
- Service fees: Money earned from providing services
- Subscription income: Recurring payments from subscribers
- Interest income: Earnings from loans or investments
- Licensing fees: Payments for using intellectual property
Important note: Revenue is recorded when earned, not necessarily when cash is received. This is called accrual accounting.
Expenses: Where the Money Goes
Expenses represent all the costs incurred to generate that revenue. The income statement typically breaks expenses into several categories:
Cost of Goods Sold (COGS) or Cost of Revenue
- Direct costs of producing products or delivering services
- Raw materials, manufacturing labor, shipping costs
- For a bakery: flour, sugar, baker salaries, oven electricity
Operating Expenses
- Selling, General & Administrative (SG&A): Marketing, office rent, executive salaries, legal fees
- Research & Development (R&D): Costs for developing new products or improving existing ones
- Depreciation & Amortization: Spreading the cost of long-term assets over their useful life
Non-Operating Expenses
- Interest expense on loans
- Losses from selling assets
- One-time restructuring costs
Profit: The Bottom Line
After subtracting all expenses from revenue, you’re left with profit (or loss, if expenses exceeded revenue). The final profit number appears at the bottom of the statement, earning it the nickname “bottom line.”
But here’s where it gets interesting: there are actually multiple profit levels on an income statement, each telling a different story about the business.
The Three Levels of Profit Explained
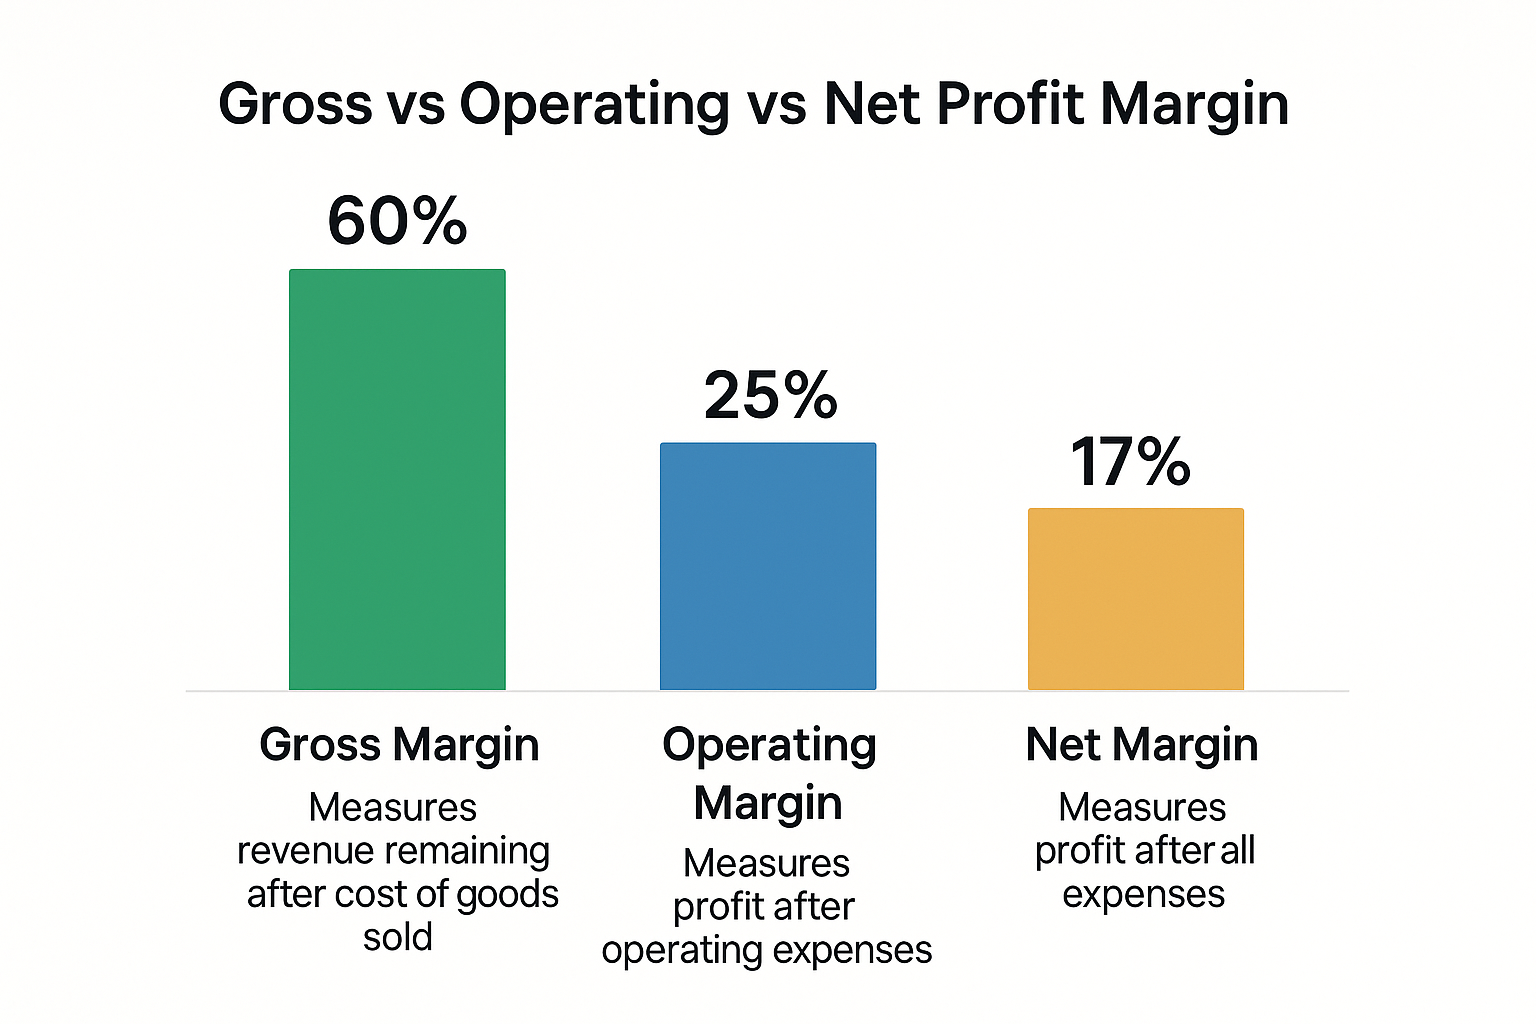
Understanding the different profit metrics is like peeling an onion; each layer reveals something new about the company’s financial health.
1. Gross Profit: Production Efficiency
Formula: Revenue – Cost of Goods Sold = Gross Profit
Gross profit shows how efficiently a company produces its products or services. It answers the question: “After paying for the direct costs of making our product, how much is left?”
Example:
- A shoe company sells $1,000,000 worth of shoes
- It costs $400,000 to manufacture those shoes (materials, factory labor)
- Gross Profit = $1,000,000 – $400,000 = $600,000
Gross Profit Margin = (Gross Profit ÷ Revenue) × 100 = 60%
A higher gross profit margin generally indicates better production efficiency and pricing power.
2. Operating Profit (EBIT): Core Business Performance
Formula: Gross Profit – Operating Expenses = Operating Profit
Operating profit (also called EBIT – Earnings Before Interest and Taxes) reveals how profitable the core business operations are, excluding financing decisions and tax impacts.
Continuing our shoe example:
- Gross Profit: $600,000
- Operating Expenses (marketing, rent, salaries, R&D): $350,000
- Operating Profit = $600,000 – $350,000 = $250,000
Operating Margin = (Operating Profit ÷ Revenue) × 100 = 25%
This metric is crucial for comparing companies because it removes the effects of different tax rates and capital structures. See our full guide on Operating Profit Margin
3. Net Income: The True Bottom Line
Formula: Operating Profit – Interest – Taxes – Other Expenses = Net Income
Net income (also called net profit or net earnings) is what’s truly left for shareholders after ALL expenses, including interest, taxes, and one-time items.
Final calculation for our shoe company:
- Operating Profit: $250,000
- Interest Expense: $20,000
- Taxes (25% rate): $57,500
- Net Income = $250,000 – $20,000 – $57,500 = $172,500
Net Profit Margin = (Net Income ÷ Revenue) × 100 = 17.25%
This is the number that ultimately determines dividend payments and reinvestment capacity. See our full guide on Net Profit Margin
Real-World Income Statement Example
Let’s look at a simplified income statement for a fictional company, TechGadget Inc., for the year ending December 31, 2025:
| TechGadget Inc. Income Statement | 2025 |
|---|---|
| Revenue | $5,000,000 |
| Cost of Goods Sold | ($2,000,000) |
| Gross Profit | $3,000,000 |
| Operating Expenses: | |
| Selling & Marketing | ($800,000) |
| General & Administrative | ($600,000) |
| Research & Development | ($400,000) |
| Depreciation | ($100,000) |
| Total Operating Expenses | ($1,900,000) |
| Operating Income (EBIT) | $1,100,000 |
| Interest Expense | ($50,000) |
| Income Before Taxes | $1,050,000 |
| Income Tax Expense (21%) | ($220,500) |
| Net Income | $829,500 |
| Earnings Per Share (EPS) | $4.15 |
| (assuming 200,000 shares outstanding) |
Key Insights from This Statement:
Gross margin of 60% ($3M ÷ $5M) indicates strong pricing power and efficient production
Operating margin of 22% ($1.1M ÷ $5M) shows the core business is healthy
Net margin of 16.6% ($829.5K ÷ $5M) reveals solid overall profitability
EPS of $4.15 gives investors a per-share profitability metric for comparison
How to Read an Income Statement: Step-by-Step Guide
Reading an income statement becomes second nature once you follow this systematic approach:
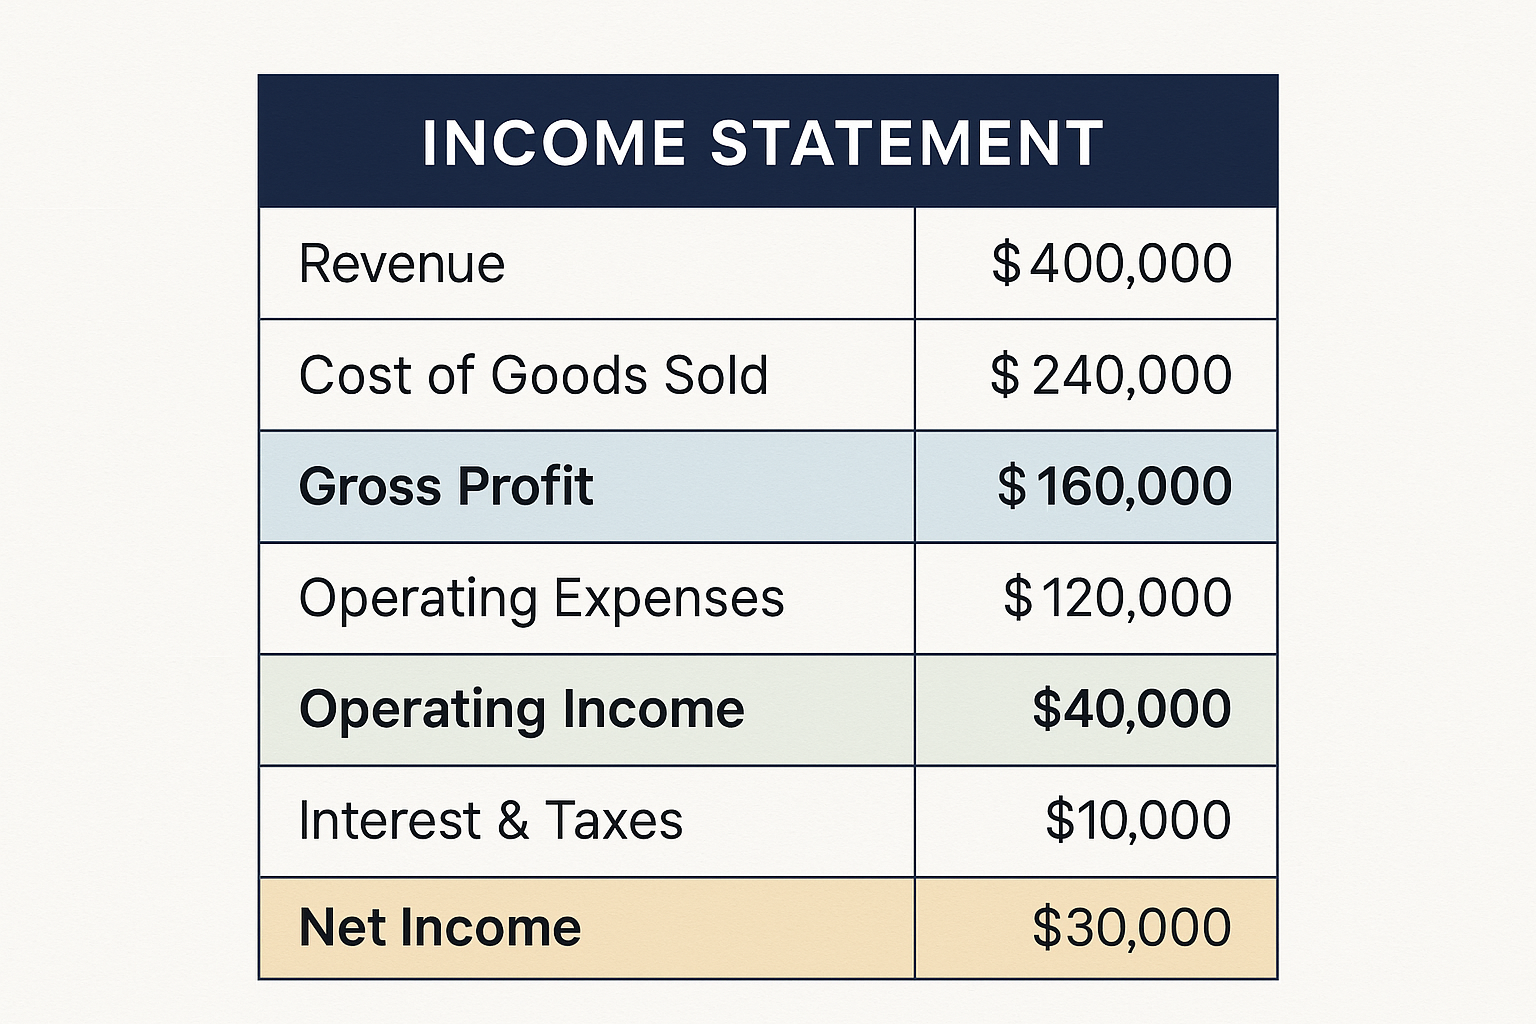
Step 1: Start at the Top—Check Revenue Growth
Look at revenue first and compare it to previous periods:
- Is revenue growing or declining?
- What’s the growth rate year-over-year?
- Is growth accelerating or slowing?
Revenue growth is often the first indicator of business health. Even profitable companies can struggle if revenue growth stalls.
Step 2: Examine Gross Profit Margin
Calculate: (Gross Profit ÷ Revenue) × 100
- Is the margin improving or declining?
- How does it compare to competitors?
- Declining margins might indicate pricing pressure or rising production costs
Step 3: Analyze Operating Expenses
Look for:
- Expense control: Are expenses growing more slowly than revenue?
- Investment areas: High R&D spending might indicate an innovation focus
- Efficiency: Is the company getting more revenue per dollar of expense?
Step 4: Review Operating Income
This shows core business profitability. A company can have great revenue but poor operating income if expenses are too high.
Step 5: Check the Bottom Line—Net Income
- Is the company profitable?
- How does net income compare to previous periods?
- What’s the trend over multiple quarters/years?
Step 6: Calculate Key Ratios
Profit Margins (as percentages of revenue):
- Gross Profit Margin
- Operating Margin
- Net Profit Margin
Earnings Per Share (EPS):
Net Income ÷ Number of Outstanding Shares
These ratios make it easier to compare companies of different sizes.
Income Statement vs Other Financial Statements
The income statement is one of three core financial statements. Here’s how it differs from the others:
| Feature | Income Statement | Balance Sheet | Cash Flow Statement |
|---|---|---|---|
| What it shows | Profitability | Financial position | Cash movements |
| Time frame | Period of time | Single point in time | Period of time |
| Key question | “Did we make money?” | “What do we own/owe?” | “Where did cash come from/go?” |
| Top line | Revenue | Assets | Operating cash flow |
| Bottom line | Net income | Equity | Net change in cash |
| Focus | Performance | Resources | Liquidity |
Why all three matter: The income statement might show profit, but the cash flow statement could reveal cash problems. The balance sheet shows whether the company is financially stable enough to sustain its operations. Smart investors examine all three together for a complete picture.
Common Income Statement Mistakes to Avoid
1: Confusing Revenue with Cash
The problem: Revenue is recorded when earned, not when cash is received (accrual accounting).
Example: A company might report $1 million in revenue but only receive $600,000 in actual cash if customers pay on credit.
Solution: Always check the cash flow statement alongside the income statement.
2: Ignoring One-Time Items
The problem: Special charges, asset sales, or restructuring costs can distort the picture.
Example: A company reports a loss, but it’s only because of a one-time $50 million restructuring charge. The core business is actually profitable.
Solution: Look for “adjusted” or “normalized” earnings that exclude one-time items.
3: Focusing Only on Net Income
The problem: Net income can be manipulated through accounting choices, tax strategies, and one-time items.
Solution: Examine all profit levels (gross, operating, and net) plus the cash flow statement.
4: Not Comparing to Previous Periods
The problem: A single period’s numbers lack context.
Example: $10 million in net income sounds great, but what if it was $15 million last year? That’s a 33% decline!
Solution: Always look at trends over multiple quarters and years.
5: Ignoring Industry Context
The problem: Profit margins vary dramatically by industry.
Example: Software companies often have 70-80% gross margins, while grocery stores operate on 2-3% net margins.
Solution: Compare companies to their industry peers, not to companies in different sectors.
How Investors Use Income Statements
Understanding income statements is essential for making smart investment decisions. Here’s how different investors use them:
Value Investors
Value investors look for companies trading below their intrinsic value. They use income statements to:
- Identify consistent earnings growth
- Calculate price-to-earnings (P/E) ratios
- Find companies with improving profit margins
- Spot undervalued companies with temporary earnings dips
Growth Investors
Growth investors prioritize revenue and earnings growth. They examine:
- Year-over-year revenue growth rates
- Whether growth is accelerating or decelerating
- Investment in R&D and marketing (future growth indicators)
- Path to profitability for unprofitable companies
Dividend Investors
Dividend investors need sustainable earnings to support dividend payments. They analyze:
- Net income trends and stability
- Payout ratio (dividends ÷ net income)
- Free cash flow coverage of dividends
- Earnings consistency over economic cycles
Understanding why the stock market goes up long-term often comes down to growing corporate earnings shown on income statements.
Advanced Income Statement Concepts
EBITDA: A Different Profit Measure
EBITDA stands for Earnings Before Interest, Taxes, Depreciation, and Amortization.
Formula: Net Income + Interest + Taxes + Depreciation + Amortization
EBITDA is popular because it:
- Removes accounting decisions (depreciation methods)
- Eliminates capital structure effects (interest)
- Provides a proxy for cash-generating ability
However, EBITDA has critics who argue it ignores real costs like capital expenditures. Warren Buffett famously asked, “Does management think the tooth fairy pays for capital expenditures?”
Non-GAAP Earnings
Many companies report “adjusted earnings” or “non-GAAP earnings” that exclude certain items they consider one-time or non-operational.
Common adjustments:
- Stock-based compensation
- Restructuring charges
- Acquisition-related costs
- Asset impairments
Investor caution: While adjusted earnings can provide clarity, they can also be used to paint a rosier picture than reality. Always review what’s being adjusted and why.
Earnings Quality
Not all earnings are created equal. High-quality earnings have these characteristics:
Backed by actual cash flow
Sustainable and recurring
Conservative accounting assumptions
Growing revenue, not just cost-cutting
Minimal one-time adjustments
Low-quality earnings warning signs:
Revenue recognition tricks
Frequent “one-time” charges (that happen every year)
Earnings are growing while cash flow declines
Aggressive accounting assumptions
Income Statement for Small Business Owners
If you run a small business, your income statement is crucial for:
1. Tracking Performance
Create monthly income statements to monitor:
- Which products/services are most profitable
- Where expenses are growing too fast
- Seasonal trends in revenue and profit
- Progress toward annual goals
2. Making Decisions
Use your income statement to:
- Decide whether to raise prices
- Identify areas to cut costs
- Determine if you can afford new hires
- Evaluate whether to expand or contract
3. Securing Financing
Banks and investors will request income statements when you:
- Apply for business loans
- Seek investor funding
- Negotiate supplier credit terms
- Apply for business credit cards
4. Tax Planning
Your income statement helps you:
- Estimate quarterly tax payments
- Identify deductible expenses
- Plan year-end tax strategies
- Prepare accurate tax returns
Pro tip: Use accounting software like QuickBooks, Xero, or FreshBooks to automatically generate income statements from your transactions.
Income Statement Red Flags
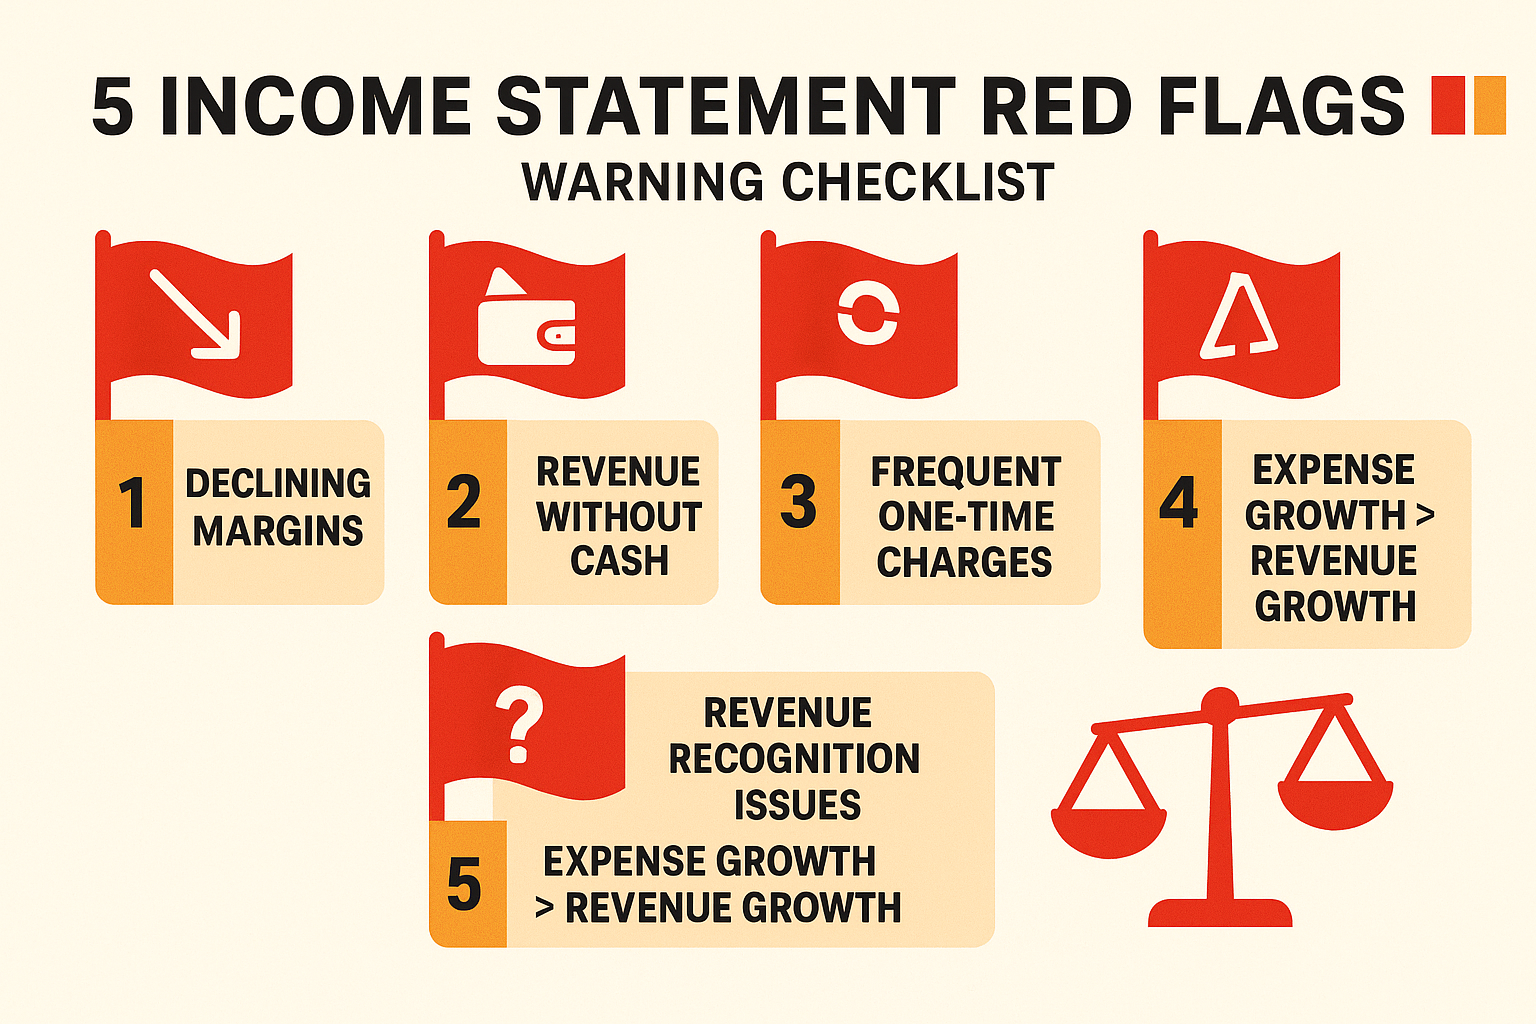
When analyzing income statements, watch for these warning signs:
1: Revenue Recognition Issues
What to watch for:
- Revenue is growing much faster than accounts receivable
- Unusual revenue timing (all at quarter-end)
- Frequent restatements of revenue
Why it matters: Companies sometimes recognize revenue before it’s truly earned to inflate results.
2: Declining Margins
What to watch for:
- Gross margin is shrinking over time
- Operating margin declining while revenue grows
- Net margin compression
Why it matters: Declining margins suggest pricing pressure, rising costs, or both—potential signs of competitive weakness.
3: Excessive One-Time Charges
What to watch for:
- “One-time” charges appear every year
- Large restructuring costs multiple times
- Frequent asset write-downs
Why it matters: Recurring “one-time” items suggest operational problems or aggressive accounting.
4: Revenue Growth Without Profit Growth
What to watch for:
- Revenue is increasing 20% but net income is only up 5%
- Growing top line with shrinking bottom line
- Expenses are growing faster than revenue
Why it matters: Unprofitable growth destroys value and isn’t sustainable.
5: Divergence from Cash Flow
What to watch for:
- Net income is significantly higher than operating cash flow
- Growing gap between earnings and cash over time
- Negative cash flow despite reported profits
Why it matters: Earnings without cash flow often indicate accounting manipulation or uncollectible receivables.
Understanding these red flags helps you avoid losing money in the stock market by identifying troubled companies early.
Practical Exercise: Analyzing a Real Income Statement
Let’s practice with a real-world example. Below is a simplified version of Apple Inc.’s income statement (numbers in millions):
| Apple Inc. | 2024 | 2023 |
|---|---|---|
| Net Sales | $383,285 | $394,328 |
| Cost of Sales | $214,137 | $223,546 |
| Gross Profit | $169,148 | $170,782 |
| Operating Expenses | $55,013 | $54,780 |
| Operating Income | $114,135 | $115,002 |
| Other Income | $269 | ($565) |
| Income Before Taxes | $114,404 | $114,437 |
| Income Tax | $29,749 | $16,741 |
| Net Income | $84,655 | $97,696 |
Analysis Questions:
1. What happened to revenue?
Revenue decreased from $394B to $383B (down 2.8%), a rare decline for Apple.
2. How did margins perform?
- Gross margin: 44.1% (2024) vs. 43.3% (2023)—improved
- Operating margin: 29.8% vs. 29.2%—improved
- Net margin: 22.1% vs. 24.8%—declined
3. What caused the net income decline?
Despite better operating margins, net income fell 13.4% primarily due to:
- Lower revenue
- Significantly higher tax expense ($29.7B vs. $16.7B)
4. Is this concerning?
The revenue decline is notable, but improving operational margins suggest good cost control. The higher tax expense appears to be a one-time issue. Overall: mixed signals requiring further investigation.
This type of analysis is exactly what professional investors do when evaluating potential stock investments.
Tools and Resources for Income Statement Analysis
Free Resources
SEC EDGAR Database (SEC EDGAR)
The official source for public company filings. Search any public company and access their 10-K (annual) and 10-Q (quarterly) reports containing full income statements.
Yahoo Finance (finance.yahoo.com)
Provides easy-to-read income statements for any public company, with historical data and comparison tools.
Morningstar (morningstar.com)
Offers detailed financial analysis, including income statement trends and peer comparisons (free basic access).
Investopedia (investopedia.com)
Excellent educational content explaining income statement concepts and financial ratios.
Paid Tools
Bloomberg Terminal
Professional-grade financial data and analysis (expensive, typically $20,000+/year).
FactSet
Comprehensive financial data and analytics platform used by institutional investors.
S&P Capital IQ
Detailed financial data, comparable company analysis, and screening tools.
Accounting Software for Small Business
QuickBooks
Industry-standard accounting software that automatically generates income statements.
Xero
Cloud-based accounting with excellent reporting and income statement generation.
FreshBooks
User-friendly option for freelancers and small businesses with simple income statement needs.
Building Financial Literacy: Next Steps
Understanding income statements is just the beginning of financial education. Here’s how to continue building your knowledge:
1. Practice with Real Companies
Choose 3-5 companies you’re interested in and:
- Download their latest 10-K annual reports
- Review their income statements for the past 5 years
- Calculate profit margins and growth rates
- Compare them to competitors
2. Learn the Other Financial Statements
Master the complete picture by studying:
- Balance sheets: Assets, liabilities, and equity
- Cash flow statements: Where cash comes from and goes
- Statement of shareholders’ equity: Changes in ownership value
3. Study Financial Ratios
Beyond profit margins, learn to calculate:
- Price-to-earnings (P/E) ratio
- Return on equity (ROE)
- Return on assets (ROA)
- Earnings per share (EPS) growth
4. Follow Financial News
Read quality sources to understand how real companies perform:
- Wall Street Journal
- Financial Times
- Bloomberg
- The Economist
5. Consider Formal Education
For deeper knowledge, explore:
- CFA (Chartered Financial Analyst) certification
- Online courses from Coursera, edX, or Khan Academy
- Local community college accounting or finance courses
- Books like “Financial Statements” by Thomas Ittelson
6. Apply It to Your Own Finances
Create a personal income statement:
- Track your “revenue” (income from all sources)
- Categorize your “expenses” (fixed and variable)
- Calculate your “profit” (savings)
- Monitor trends and make improvements
This practice helps you understand both business and personal finance better. You can even teach these concepts to your children to build generational wealth.
The Emotional Side of Income Statements
While income statements are filled with numbers, they trigger real emotions in investors and business owners. Understanding the cycle of market emotions helps you make rational decisions even when quarterly earnings reports create volatility.
When Results Exceed Expectations
Typical emotional response: Euphoria, overconfidence, greed
Rational approach:
- Celebrate the success, but ask “Is this sustainable?”
- Consider whether high expectations are now baked into the stock price
- Avoid assuming every quarter will be this good
When Results Disappoint
Typical emotional response: Fear, panic, desire to sell
Rational approach:
- Determine if it’s a temporary setback or a fundamental problem
- Review management’s explanation and future guidance
- Consider whether the market overreacted, creating an opportunity
During Consistent Performance
Typical emotional response: Boredom, complacency
Rational approach:
- Appreciate the stability and predictability
- Monitor for early warning signs of change
- Don’t abandon quality companies for exciting but risky alternatives
Remember: The best investors control their emotions and focus on long-term fundamentals revealed in income statements, not short-term market reactions.
Income Statements and Passive Income
For those interested in building passive income streams, income statements are crucial for evaluating dividend-paying stocks.
Evaluating Dividend Sustainability
Before investing in high dividend stocks, check the income statement for:
1. Earnings Coverage
- Payout Ratio = Dividends Paid ÷ Net Income
- Ideally, below 60% for safety
- Higher ratios leave less room for dividend growth or economic downturns
2. Earnings Stability
- Consistent or growing net income over 5+ years
- Minimal volatility in quarterly earnings
- Resilience during economic downturns
3. Earnings Growth
- Growing earnings support growing dividends
- Look for 5-10% annual earnings growth
- Faster growth allows faster dividend increases
4. Quality of Earnings
- Net income supported by operating cash flow
- Minimal one-time adjustments
- Conservative accounting practices
Example: A company with $5 net income per share paying $2 in dividends has a 40% payout ratio—sustainable. If net income grows to $6 per share, the dividend can grow to $2.40 while maintaining the same payout ratio.
Income Statement FAQ
Revenue is the total money earned from sales before any expenses are deducted—it’s the “top line.” Profit is what remains after subtracting all expenses from revenue—it’s the “bottom line.” A company can have high revenue but low (or negative) profit if expenses are too high.
Public companies prepare income statements quarterly (every three months) and annually. They must file these with the SEC and make them publicly available. Private companies may prepare them monthly, quarterly, or annually, depending on their needs and lender requirements.
Profit margins vary dramatically by industry. Software companies often achieve 20-30% net margins, while grocery stores operate on 2-3% margins. Generally, higher margins indicate better profitability, but always compare companies within the same industry. Consistent or improving margins are usually positive signs.
Yes, absolutely. Because of accrual accounting, a company can report profit while having negative cash flow. This happens when revenue is recorded before cash is collected, or when the company invests heavily in inventory or equipment. Always check the cash flow statement alongside the income statement.
Negative net income (a “net loss”) means total expenses exceeded total revenue during the period—the company lost money. This isn’t always bad: many growth companies intentionally operate at a loss while investing in expansion. However, sustained losses eventually require additional funding or business model changes.
For public companies, income statements are available in:
SEC EDGAR database (sec.gov/edgar) – official filings
Company investor relations websites – usually under “Financials” or “Investor Relations”
Financial websites – Yahoo Finance, Google Finance, Morningstar
Quarterly (10-Q) and annual (10-K) reports – comprehensive filings
Operating income comes from the company’s core business activities (selling products or services). Non-operating income comes from secondary sources like investment income, interest, or one-time asset sales. Operating income better reflects sustainable business performance.
Conclusion: Your Income Statement Mastery Checklist
Congratulations! You now understand one of the most important financial documents in business and investing. Let’s recap the essential points:
The income statement shows profitability over a specific time period through three key components: revenue, expenses, and profit
Multiple profit levels matter: Gross profit reveals production efficiency, operating profit shows core business performance, and net income represents the true bottom line
Context is everything: Compare income statements across multiple periods and against industry peers for meaningful insights
Watch for red flags: Declining margins, divergence from cash flow, and excessive “one-time” charges signal potential problems
Use it for decisions: Whether evaluating stocks, running a business, or building passive income, income statements provide crucial data
Your Action Steps
This week:
- Find and review the income statement of one company you’re interested in
- Calculate its gross, operating, and net profit margins
- Compare those margins to a competitor
This month:
- Create a personal income statement, tracking your own income and expenses
- Study the income statements from three companies in the same industry
- Practice identifying red flags and positive signals
This year:
- Build a habit of reviewing income statements quarterly for companies you own or watch
- Integrate income statement analysis into your investment decision process
- Share your knowledge with family or friends interested in financial literacy
Remember, understanding income statements is a skill that compounds over time. Each statement you review builds your pattern recognition and analytical abilities. Whether you’re building wealth through dividend investing, evaluating business opportunities, or simply becoming more financially literate, this knowledge serves you for life.
The income statement isn’t just numbers on a page—it’s the story of how a business performs, where it’s headed, and whether it deserves your investment or attention. Master this document, and you’ll have a superpower that most people never develop.
📊 Income Statement Calculator
Calculate your profit margins and analyze financial performance
Gross Margin
0%
Operating Margin
0%
Net Margin
0%
Financial Disclaimer
This article is for educational purposes only and does not constitute financial advice. The information provided is based on general principles and should not be considered personalized investment recommendations. Income statement analysis is just one component of a comprehensive financial evaluation. Always conduct thorough research and consider consulting with qualified financial professionals before making investment decisions. Past financial performance shown in income statements does not guarantee future results. The author and TheRichGuyMath.com are not responsible for any financial decisions made based on this information.
About the Author
Written by Max Fonji — Your go-to source for clear, data-backed investing education. With over a decade of experience in financial analysis and investment education, Max specializes in breaking down complex financial concepts into actionable insights. His mission is to empower everyday investors with the knowledge and tools needed to build lasting wealth through informed decision-making.
Max believes that financial literacy is the foundation of financial freedom. Through TheRichGuyMath.com, he’s helped thousands of readers understand the fundamentals of investing, from reading income statements to building diversified passive income portfolios.
Connect with Max and continue your financial education journey at TheRichGuyMath.com.
SEO Metadata
Meta Title: Income Statement Simplified: Revenue, Expenses & Profit 2025
Meta Description: Master income statements with this beginner’s guide. Learn revenue, expenses, profit margins, and how to analyze financial statements for smarter investing decisions.
URL Slug: income-statement-simplified-revenue-expenses-profit


