Every dollar trapped in unsold inventory is a dollar that isn’t working for your business. Whether you’re analyzing a company’s financial health as an investor or managing your own retail operation, understanding inventory turnover reveals critical insights about operational efficiency, cash flow management, and competitive positioning.
Inventory Turnover measures how many times a business sells and replaces its entire stock of goods within a specific period, typically one year. This metric sits at the intersection of sales performance and operational efficiency, making it one of the most revealing indicators in financial analysis. A company that turns over inventory rapidly generates cash more quickly, reduces storage costs, and minimizes the risk of obsolescence. Conversely, slow-moving inventory signals potential problems: weak demand, poor purchasing decisions, or operational inefficiencies that drain profitability.
This comprehensive guide is part of our investing fundamentals and breaks down the math behind inventory turnover, explains multiple calculation methods, and teaches you how to analyze this metric like a professional financial analyst. By understanding these principles, you’ll gain data-driven insights into business performance that most beginners overlook. www.federalreserve.gov
Key Takeaways
- Inventory Turnover quantifies how efficiently a business converts inventory into sales, calculated as Cost of Goods Sold divided by Average Inventory
- Higher turnover ratios typically indicate strong sales and efficient operations, while lower ratios may signal excess stock or weak demand
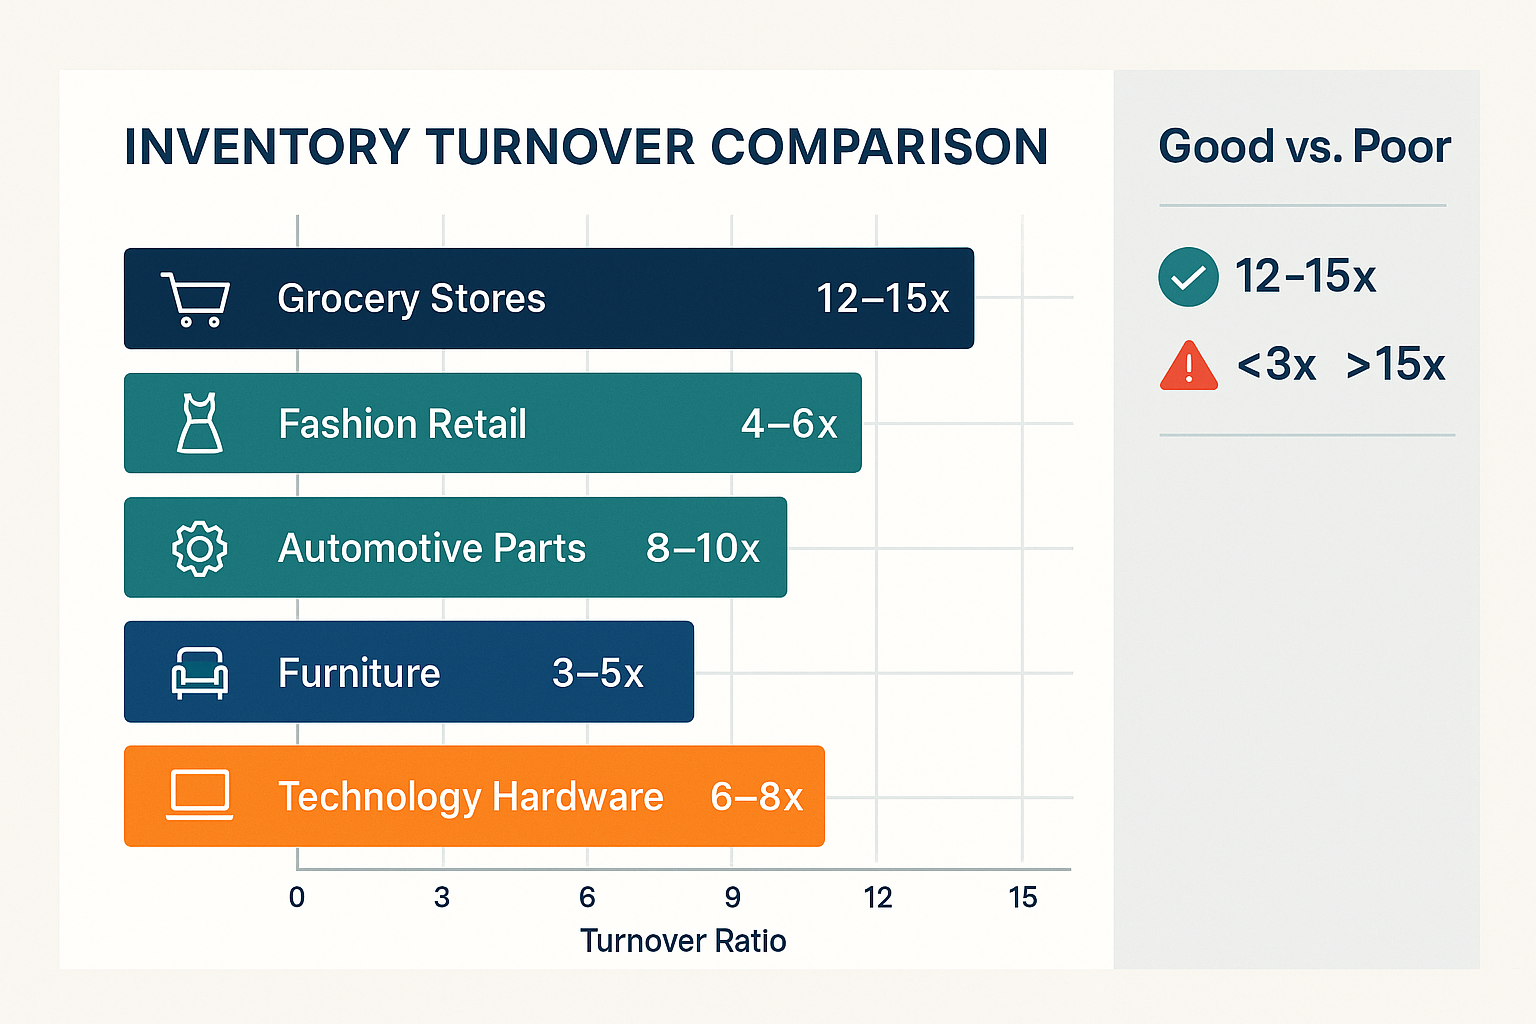
- Industry benchmarks vary significantly; grocery stores average 12-15x annually, while furniture retailers average 3-5x
- Multiple calculation methods exist (COGS-based, sales-based, unit-based), each providing different analytical perspectives
- Effective analysis requires comparing turnover against industry peers, historical trends, and understanding seasonal business patterns
What Is Inventory Turnover?
Inventory turnover represents the number of times a company completely sells through and replaces its stock during a defined period. This fundamental metric measures the relationship between sales velocity and inventory investment.
Think of inventory turnover as the speed at which products move through your business. A retailer with $1,000,000 in annual sales and $250,000 in average inventory achieves a turnover ratio of 4x, meaning the entire inventory stock was sold and replenished four times throughout the year.
Why this metric matters: Inventory ties up capital that could otherwise generate returns elsewhere. Each day products sit unsold, businesses incur storage costs, insurance expenses, and depreciation risk. High-turnover businesses convert inventory to cash quickly, improving cash flow and reducing carrying costs.
The Business Impact of Inventory Turnover
From an operational perspective, inventory turnover directly affects profitability through several mechanisms:
Capital efficiency: Businesses with faster turnover require less working capital to maintain operations. A company turning inventory 12 times annually needs significantly less cash tied up in stock compared to a competitor turning inventory only 3 times.
Storage and holding costs: Every product occupies warehouse space, requires insurance, and may deteriorate over time. Faster turnover minimizes these carrying costs, which typically range from 20-30% of inventory value annually.
Obsolescence risk: Technology products, fashion items, and perishable goods lose value rapidly. Higher turnover reduces the likelihood of being stuck with outdated or unsellable merchandise.
Cash conversion cycle: The faster inventory converts to sales, the quicker businesses generate cash to reinvest in growth, pay suppliers, or return value to shareholders. This concept connects directly to the cash conversion cycle, which measures the time between cash outflow for inventory and cash inflow from sales.
For investors analyzing potential stock purchases, inventory turnover provides early warning signals about business health. Declining turnover ratios often precede earnings disappointments, while improving turnover suggests operational excellence and competitive strength. www.morningstar.com
The Inventory Turnover Formula Explained
The standard Inventory Turnover formula uses two components from a company’s financial statements:
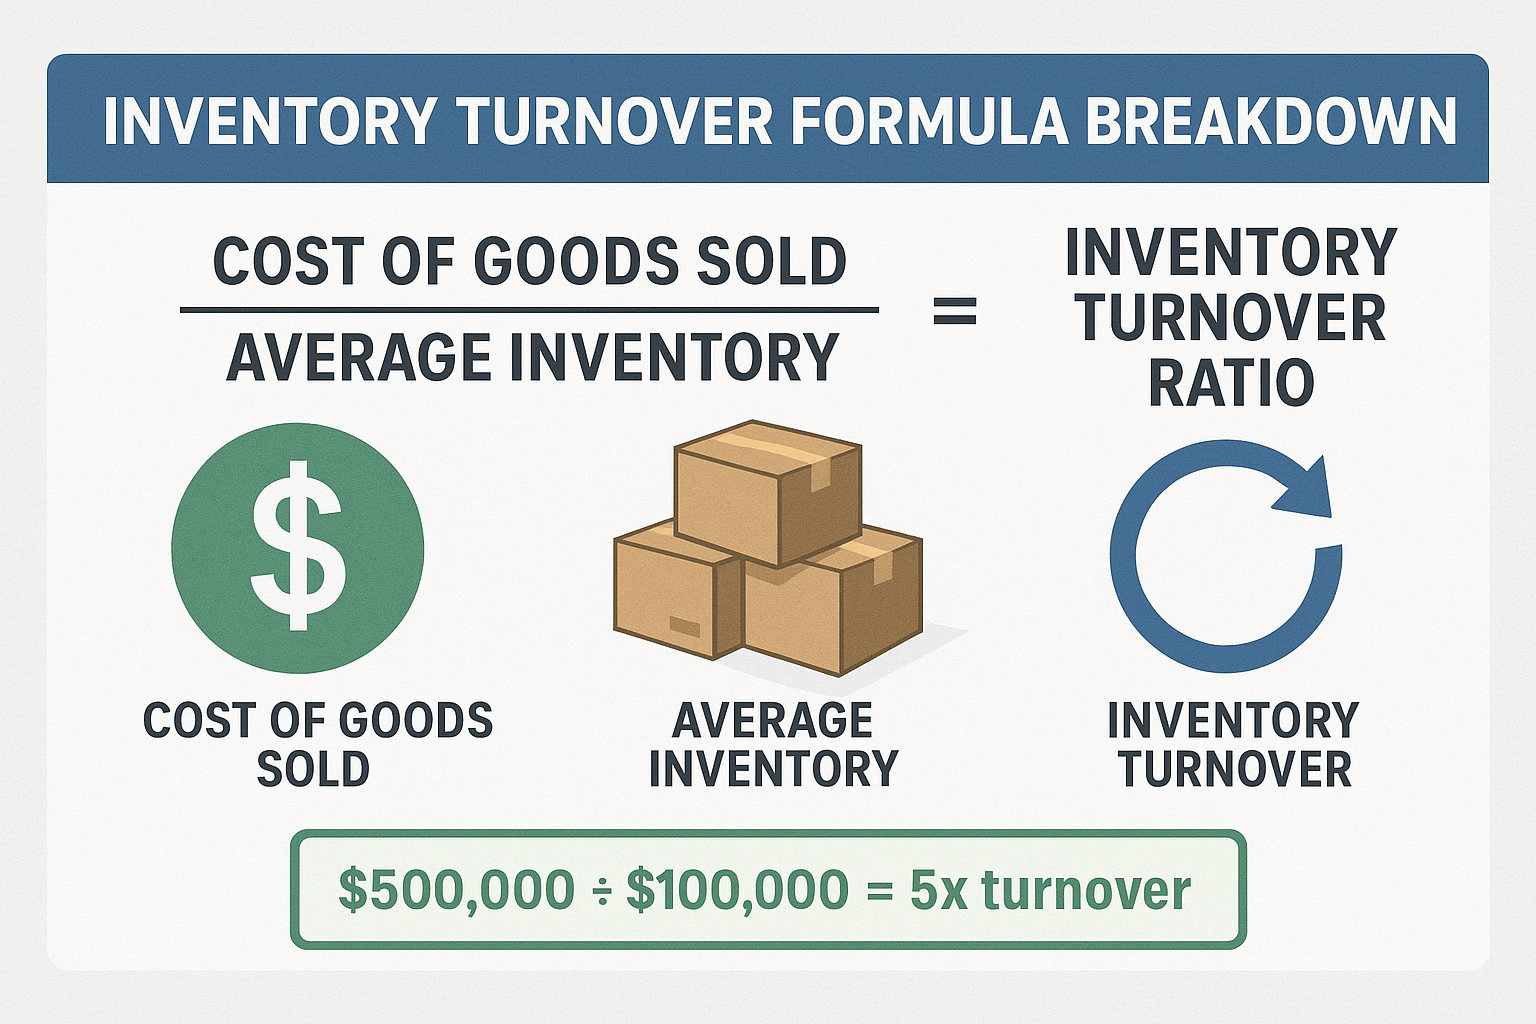
Inventory Turnover Ratio = Cost of Goods Sold (COGS) ÷ Average Inventory
Let’s break down each element:
Cost of Goods Sold (COGS)
COGS represents the direct costs of producing or purchasing the goods a company sells during the period. This figure appears on the income statement and includes:
- Raw materials and components
- Direct labor costs for manufacturing
- Factory overhead directly attributable to production
COGS excludes indirect expenses like marketing, distribution, administrative salaries, and corporate overhead. Using COGS rather than sales revenue creates a more accurate comparison because both COGS and inventory are valued at cost, not retail price.
Average Inventory
Average inventory smooths out fluctuations that occur throughout the year due to seasonal patterns, bulk purchasing, or strategic stockpiling.
Average Inventory = (Beginning Inventory + Ending Inventory) ÷ 2
These inventory values come from the balance sheet, beginning inventory from the start of the period, and ending inventory from the period’s close.
For businesses with significant seasonal variation, calculating the monthly average inventory provides greater accuracy:
Refined Average Inventory = Sum of Monthly Inventory Values ÷ 12
This approach captures mid-year peaks and valleys that a simple two-point average might miss.
Complete Calculation Example
Consider a retail company with the following annual figures:
- Cost of Goods Sold: $2,400,000
- Beginning Inventory (January 1): $400,000
- Ending Inventory (December 31): $600,000
Step 1: Calculate average inventory
Average Inventory = ($400,000 + $600,000) ÷ 2 = $500,000
Step 2: Apply the turnover formula
Inventory Turnover = $2,400,000 ÷ $500,000 = 4.8x
Interpretation: This company sold and replaced its entire inventory approximately 4.8 times during the year, or roughly every 76 days (365 days ÷ 4.8 = 76 days).
Alternative Calculation Methods
Different analytical contexts require different approaches:
Sales-Based Formula (Retail Analysis)
Inventory Turnover = Net Sales ÷ Average Inventory (at retail value)
This method works well for retail operations where inventory is tracked at the selling price rather than the cost. However, it produces higher ratios than the COGS method and isn’t directly comparable.
Unit-Based Formula (Operational Analysis)
Inventory Turnover = Units Sold ÷ Average Units on Hand
Warehouse managers and operations teams often prefer unit-based calculations because they provide tangible, actionable insights independent of price fluctuations.
Days Inventory Outstanding (DIO)
DIO = (Average Inventory ÷ COGS) × 365
Also called Days Sales of Inventory (DSI), this metric inverts the turnover ratio to show how many days inventory sits before selling. Lower DIO indicates faster turnover.
Using the previous example:
DIO = ($500,000 ÷ $2,400,000) × 365 = 76 days
This confirms our earlier calculation; inventory turns approximately every 76 days.
How to Analyze Inventory Turnover Ratios
Calculating inventory turnover is straightforward. Analyzing it effectively requires context, comparison, and critical thinking about what the numbers reveal. www.investopedia.com
Industry Benchmarks Matter
A “good” inventory turnover ratio varies dramatically across industries based on product characteristics, business models, and market dynamics.
| Industry | Typical Turnover Range | Characteristics |
|---|---|---|
| Grocery/Supermarkets | 12-15x | Perishable goods, high volume, low margins |
| Fashion Retail | 4-6x | Seasonal collections, trend-driven |
| Automotive Parts | 8-10x | Standardized products, predictable demand |
| Furniture | 3-5x | High-ticket items, longer sales cycles |
| Technology Hardware | 6-8x | Rapid obsolescence risk |
| Pharmaceuticals | 4-6x | Regulatory requirements, shelf life concerns |
Grocery stores achieve high turnover because products are perishable and customers purchase frequently. Furniture retailers naturally turn inventory more slowly because consumers buy these items infrequently and require longer consideration periods.
Analysis principle: Always compare companies within the same industry. A furniture retailer with 5x turnover may be performing excellently, while a grocery chain with the same ratio faces serious operational problems.
High Turnover: Strengths and Risks
Advantages of high inventory turnover:
Strong cash generation: Products convert to cash quickly, improving liquidity and reducing financing needs
Lower carrying costs: Less money spent on warehousing, insurance, and inventory management
Reduced obsolescence: Minimal risk of being stuck with outdated or unsellable products
Fresh merchandise: Customers encounter newer inventory, particularly important for fashion and technology
Potential risks of excessive turnover:
Stockouts: Insufficient inventory may lead to lost sales when demand spikes
Higher ordering costs: More frequent reordering increases administrative and shipping expenses
Reduced negotiating power: Smaller order quantities may result in higher per-unit costs
Supply chain vulnerability: A smaller inventory buffer means greater exposure to supplier disruptions
A technology retailer achieving 15x turnover demonstrates exceptional efficiency, unless frequent stockouts are driving customers to competitors. Context matters.
Low Turnover: Warning Signs and Valid Reasons
Concerns with low inventory turnover:
Weak sales performance: Products aren’t resonating with customers, or pricing is uncompetitive
Excess inventory: Poor demand forecasting or over-purchasing ties up capital
Obsolescence risk: Slow-moving inventory may become unsellable, requiring markdowns or write-offs
Cash flow strain: Capital locked in inventory isn’t available for growth investments or debt service
Legitimate reasons for lower turnover:
Sometimes lower turnover reflects strategic choices rather than operational problems:
- Luxury goods retailers intentionally maintain extensive inventory to offer selection and exclusivity
- Seasonal businesses must stock up before peak periods, temporarily lowering annual turnover
- Custom manufacturers carry diverse components to fulfill varied customer specifications
- Strategic stockpiling before anticipated price increases or supply shortages
A declining turnover ratio deserves immediate investigation. If a company’s turnover drops from 8x to 5x over two years, this signals deteriorating competitive position, inventory management problems, or weakening demand.
Comparative Analysis Framework
Effective inventory turnover analysis employs multiple comparison points:
1. Peer comparison: How does the company’s turnover compare to direct competitors? A retailer with 6x turnover competing against rivals averaging 8x faces efficiency disadvantages.
2. Historical trends: Is turnover improving or declining over time? Consistent improvement suggests operational excellence, while deterioration indicates emerging problems.
3. Industry evolution: Are industry-wide turnover rates changing? E-commerce has increased turnover expectations across retail sectors as just-in-time inventory becomes more feasible.
4. Profitability correlation: Does higher turnover translate to better profit margins? Sometimes companies sacrifice margin for volume, achieving high turnover but low profitability.
Turnover and Profit Margin Relationship
Inventory turnover and profit margin often move inversely, a fundamental trade-off in retail economics:
High turnover, low margin: Grocery stores, discount retailers, and warehouse clubs operate on thin margins (1-3%) but compensate through rapid turnover (10-15x)
Low turnover, high margin: Luxury retailers, specialty stores, and jewelry businesses accept slower turnover (2-4x) while maintaining substantial margins (40-60%)
The optimal balance depends on the business model and competitive positioning. Neither approach is inherently superior; both can generate excellent returns on invested capital.
Return on Assets (ROA) perspective: A company with 15% profit margin and 3x turnover generates the same return on assets (ROA) as a competitor with 5% margin and 9x turnover (both produce 45% return). Understanding this relationship helps investors evaluate different business models fairly.
Seasonal Adjustments
Many businesses experience dramatic seasonal inventory fluctuations:
- Retailers stock heavily before holiday seasons
- Apparel companies build inventory before seasonal collection launches
- Agricultural businesses carry a high inventory post-harvest
- Toy manufacturers peak before the year-end holidays
For seasonal businesses, quarterly turnover calculations provide misleading results. Annual calculations smooth these variations, but monthly averaging offers the most accurate picture.
Analytical approach: Compare current period turnover to the same period in prior years rather than sequential quarters. A toy retailer’s Q4 turnover will always exceed Q1; the relevant question is whether Q4 2025 improved versus Q4 2024.
Practical Applications for Investors and Business Owners
Understanding inventory turnover creates actionable insights for both investors evaluating stocks and entrepreneurs managing operations.
For Investors: Red Flags and Green Lights
When analyzing potential investments, inventory turnover provides early warning signals about business health:
Warning signs:
- Declining turnover over multiple periods: May indicate weakening demand, increased competition, or operational deterioration
- Turnover significantly below industry peers: Suggests competitive disadvantages or management problems
- Rising inventory with flat sales: Classic symptom of demand forecasting errors or obsolescence issues
- Turnover declining while margins compress: Double pressure on profitability requiring immediate attention
Positive indicators:
- Improving turnover while maintaining margins: Demonstrates operational excellence and competitive strength
- Turnover above industry average: Indicates superior inventory management and strong product-market fit
- Stable turnover during industry disruption: Shows a resilient business model and adaptive management
- Increasing turnover with rising sales: Confirms genuine growth rather than revenue inflation through channel stuffing
Investment strategy application: Combine inventory turnover analysis with other efficiency metrics like accounts receivable turnover and accounts payable management to assess overall working capital efficiency. Companies excelling across all three metrics typically generate superior cash flows and shareholder returns.
For Business Owners: Optimization Strategies
Business operators can actively manage inventory turnover through strategic and tactical decisions:
Demand forecasting improvements:
- Implement data analytics to predict seasonal patterns more accurately
- Use point-of-sale data to identify fast-moving versus slow-moving SKUs
- Adjust purchasing based on historical turnover rates by product category
Inventory management techniques:
- ABC analysis: Categorize inventory by value and turnover, managing high-value, fast-moving items most intensively
- Just-in-time (JIT) ordering: Reduce inventory levels by coordinating closely with suppliers for frequent, smaller deliveries
- Safety stock optimization: Balance stockout prevention against carrying cost minimization
Product portfolio decisions:
- Discontinue slow-moving SKUs that depress overall turnover
- Expand offerings in high-turnover categories that generate strong returns
- Negotiate consignment arrangements for slow-moving specialty items
Pricing and promotion strategies:
- Use targeted markdowns to clear aging inventory before obsolescence
- Implement dynamic pricing to accelerate turnover during slow periods
- Bundle slow-moving items with popular products to improve overall velocity
Supplier relationship management:
- Negotiate shorter lead times to enable lower inventory levels
- Establish vendor-managed inventory programs for commodity items
- Secure flexible order quantities to respond quickly to demand changes
Similar to how the 50/30/20 budgeting rule helps individuals allocate resources efficiently, inventory management requires disciplined allocation of capital across product categories based on turnover potential and profitability contribution.
Connecting to Broader Financial Analysis
Inventory turnover doesn’t exist in isolation—it connects to multiple aspects of financial performance:
Working capital management: Inventory represents a major component of working capital alongside accounts receivable and accounts payable. The cash conversion cycle integrates all three to measure how quickly businesses convert invested capital back into cash.
Profitability analysis: Inventory carrying costs directly reduce accounting profit. Businesses that improve turnover while maintaining sales volume automatically enhance profitability by reducing these costs.
Liquidity assessment: The current ratio includes inventory as a current asset, but slow-moving inventory provides less liquidity than the ratio suggests. Analysts often prefer the quick ratio, which excludes inventory, for companies with turnover concerns.
Valuation implications: Companies with superior inventory turnover often command higher valuation multiples because they generate stronger cash flows and require less working capital to grow. This efficiency creates competitive advantages that translate into sustainable economic profit.
Real-World Case Study
Consider two competing electronics retailers:
Company A:
- Annual sales: $10,000,000
- COGS: $7,000,000
- Average inventory: $1,000,000
- Inventory turnover: 7x
- Gross margin: 30%
Company B:
- Annual sales: $10,000,000
- COGS: $7,000,000
- Average inventory: $1,750,000
- Inventory turnover: 4x
- Gross margin: 30%
Both generate identical sales and margins, but Company A turns inventory 75% faster. This efficiency creates significant advantages:
Capital efficiency: Company A operates with $750,000 less capital tied up in inventory—funds available for expansion, debt reduction, or shareholder returns.
Carrying cost savings: Assuming 25% annual carrying costs, Company A saves approximately $187,500 annually ($750,000 × 25%) compared to Company B.
Obsolescence risk: In the fast-moving electronics sector, Company A’s inventory averages 52 days old (365 ÷ 7) versus 91 days for Company B (365 ÷ 4), significantly reducing markdown risk.
Competitive positioning: Company A’s superior turnover suggests better product selection, more effective marketing, or superior customer service, competitive advantages that compound over time.
For investors, Company A likely deserves a valuation premium despite identical current financial results, because operational efficiency creates sustainable competitive advantages.
Common Mistakes and Misconceptions
Even experienced analysts sometimes misinterpret inventory turnover. Avoiding these pitfalls improves analytical accuracy:
Mistake #1: Ignoring Industry Context
The error: Assuming higher turnover is always better without considering industry norms.
The reality: A furniture retailer achieving 6x turnover demonstrates exceptional performance, while a grocery chain with the same ratio faces serious problems. Industry economics determine appropriate benchmarks.
Correction: Always compare against industry peers and understand the structural factors affecting turnover in each sector.
Mistake #2: Using Inconsistent Valuation Methods
The error: Comparing COGS-based turnover for one company against sales-based turnover for another.
The reality: Sales-based calculations produce ratios approximately 1.5-2x higher than COGS-based calculations (depending on gross margin), making direct comparison meaningless.
Correction: Ensure all compared companies use identical calculation methods, or adjust ratios to create comparable metrics.
Mistake #3: Overlooking Accounting Methods
The error: Failing to account for different inventory valuation methods (FIFO vs. LIFO vs. weighted average).
The reality: During inflationary periods, LIFO (Last In, First Out) accounting produces lower inventory values than FIFO (First In, First Out), artificially inflating turnover ratios.
Correction: Review accounting policy footnotes and adjust for comparability when analyzing companies using different inventory accounting methods.
Mistake #4: Focusing Solely on Turnover
The error: Optimizing for maximum turnover without considering profitability, customer satisfaction, or strategic positioning.
The reality: Extreme turnover optimization can lead to chronic stockouts, customer frustration, lost sales, and damaged brand reputation.
Correction: Balance turnover efficiency against service level objectives and profitability targets. The optimal turnover rate maximizes long-term shareholder value, not the turnover ratio itself.
Mistake #5: Ignoring Product Mix Changes
The error: Interpreting changing turnover ratios without investigating underlying product mix shifts.
The reality: A retailer expanding into higher-margin, slower-turning luxury goods will experience declining turnover even if operations improve across all categories.
Correction: Analyze turnover by product category and adjust for mix changes when evaluating historical trends.
Advanced Analytical Techniques
For sophisticated investors and analysts, several advanced approaches provide deeper insights:
Inventory Turnover by Segment
Large companies often operate multiple business segments with vastly different turnover characteristics. Segment-level analysis reveals operational performance that consolidated figures obscure.
Example: A conglomerate operating both grocery stores (12x turnover) and furniture showrooms (4x turnover) might report consolidated turnover of 8x. This aggregate figure masks excellent grocery performance and problematic furniture operations.
Application: Review segment reporting in 10-K filings to calculate turnover by business unit, revealing which operations drive value and which destroy it.
Inventory Composition Analysis
Balance sheet footnotes often break inventory into categories:
- Raw materials
- Work-in-process
- Finished goods
Analytical insight: Rising raw materials relative to finished goods may indicate production slowdowns or demand weakness. Increasing finished goods relative to sales suggests inventory buildup and potential obsolescence.
Turnover Trend Analysis
Plot inventory turnover over 5-10 years to identify long-term patterns:
Improving trend: Suggests operational excellence, market share gains, or successful business model evolution
Declining trend: Indicates competitive pressure, operational deterioration, or strategic challenges
Cyclical pattern: Reveals sensitivity to economic cycles, helping predict performance during expansions and contractions
Stable trend: Demonstrates consistent execution and a mature business model
Combine trend analysis with industry benchmark evolution to distinguish company-specific performance from sector-wide changes.
Integration with DuPont Analysis
The DuPont framework decomposes Return on Equity (ROE) into component drivers, including asset turnover (which incorporates inventory turnover):
ROE = Net Margin × Asset Turnover × Equity Multiplier
Improving inventory turnover directly enhances asset turnover, which increases ROE—demonstrating how operational efficiency translates to shareholder value creation.
This connection illustrates why inventory management isn’t merely an operational concern but a strategic driver of financial performance and valuation.
Inventory Turnover Across Business Models
Different business models create distinct inventory turnover patterns and optimization strategies:
Retail Operations
Traditional retailers balance selection breadth against inventory efficiency. Department stores carry extensive inventory to offer a comprehensive selection, accepting lower turnover (3-5x) as the cost of customer convenience.
Specialty retailers focus on narrow categories, achieving higher turnover (6-10x) through deep expertise and targeted merchandising.
E-Commerce Businesses
Online retailers often achieve superior turnover through:
- Centralized distribution: Fewer locations concentrate inventory, improving turnover
- Data-driven merchandising: Real-time sales data enables rapid inventory adjustments
- Drop-shipping: Eliminating inventory for some products
- Dynamic pricing: Algorithmic price optimization accelerates slow-moving inventory
Leading e-commerce companies achieve turnover rates 20-30% higher than traditional retail competitors.
Manufacturing Operations
Manufacturers manage three inventory categories, each with different turnover characteristics:
Raw materials turnover: Depends on production schedules and supplier lead times
Work-in-process turnover: Reflects production cycle length and manufacturing efficiency
Finished goods turnover: Driven by customer demand and distribution channel dynamics
Lean manufacturing principles aim to minimize all three inventory types, maximizing overall capital efficiency.
Service Businesses
Service companies typically carry minimal inventory, making turnover analysis less relevant. However, professional service firms can apply similar concepts to “intellectual inventory”, the utilization rate of billable professionals.
Here’s a polished Conclusion section tailored for your Inventory Turnover article and brand voice ready to paste directly into the final article.
Conclusion
Inventory turnover is one of the clearest windows into a company’s operational health. It shows how efficiently a business converts inventory into sales, how well it manages demand, and how quickly it frees up cash. By using the correct formula, comparing turnover only within the same industry, and pairing it with metrics like DIO and the Cash Conversion Cycle, investors and operators can uncover meaningful insights that raw sales numbers alone can’t reveal.
A high turnover ratio can signal strong demand and disciplined inventory control; a low ratio may point to weak sales, overstocking, or forecasting issues that deserve deeper analysis. Regardless of sector, the goal isn’t simply to chase a higher number—it’s to achieve the right turnover based on the business model, margins, and product cycle.
For beginners and professionals alike, mastering inventory turnover builds stronger financial judgment and helps you evaluate companies with greater clarity and confidence.
Disclaimer
This article is for educational purposes only and not financial advice. Readers should consult a licensed financial professional before making investment or business decisions.
Author Bio
Written by Max Fonji, a finance educator and founder of TheRichGuyMath.com, specializing in simplifying financial ratios, investment strategies, and wealth-building systems. Blending data-backed analysis with clear explanations, Max helps readers understand the math behind smarter money decisions.
Frequently Asked Questions
Is high inventory turnover always good?
Not always. Extremely high turnover may signal frequent stockouts, lost sales, and poor forecasting accuracy.
Does inventory turnover include work-in-progress?
Yes — if WIP is included in total inventory, which is common in manufacturing environments.
Is inventory turnover the same as sell-through rate?
No. Sell-through rate measures items sold divided by items received, while turnover measures COGS relative to average inventory.
How often should businesses calculate inventory turnover?
At least quarterly. Retailers and fast-moving industries often calculate it monthly for tighter control.
Does inflation affect inventory turnover?
Yes. Rising prices increase COGS, which can artificially inflate turnover if inventory levels stay the same.
What’s the best metric to pair with inventory turnover?
Days Inventory Outstanding (DIO) and Gross Margin Return on Investment (GMROI) provide deeper insight into efficiency and profitability.
Related posts:
 Dividend Portfolio: How to Build One for Steady Passive Income
 Why Should You Invest? The Benefits of Long-Term Investing Explained
 What Is a Hedge Fund? How It Works, Strategies, and Risks Explained
 S&P 500 Total Return 2024: Full Performance Breakdown
 Margin Investing: How It Works, Risks, Examples, and Smart Strategies
 Robinhood vs Fidelity: Which Brokerage Is Better for Investors?