

Picture this: A company reports $10 million in annual revenue and appears profitable on paper. Yet three months later, it filed for bankruptcy because it couldn’t pay a $500,000 supplier invoice. Revenue doesn’t equal survival; cash flow does. This is why understanding liquidity ratios represents one of the most critical skills in financial literacy and risk management.
Liquidity ratios measure a company’s ability to meet short-term obligations using available assets. They answer a fundamental question: Can this business pay its bills when they come due? For investors, creditors, and business owners, these metrics provide early warning signals about financial health that profit margins alone cannot reveal.
The math behind money demands we look beyond surface-level profitability. A business can show accounting profit while simultaneously running out of cash, a phenomenon that has destroyed countless enterprises. Liquidity analysis prevents this blindness by quantifying the relationship between what a company owns and what it owes in the near term.
This comprehensive guide breaks down the three primary liquidity ratios, their formulas, interpretation frameworks, and practical analysis techniques. Whether evaluating investment opportunities or managing business operations, mastering these metrics builds the foundation for evidence-based financial decision-making.
Key Takeaways
- Liquidity ratios measure short-term financial health by comparing current assets to current liabilities, revealing whether a company can meet immediate obligations
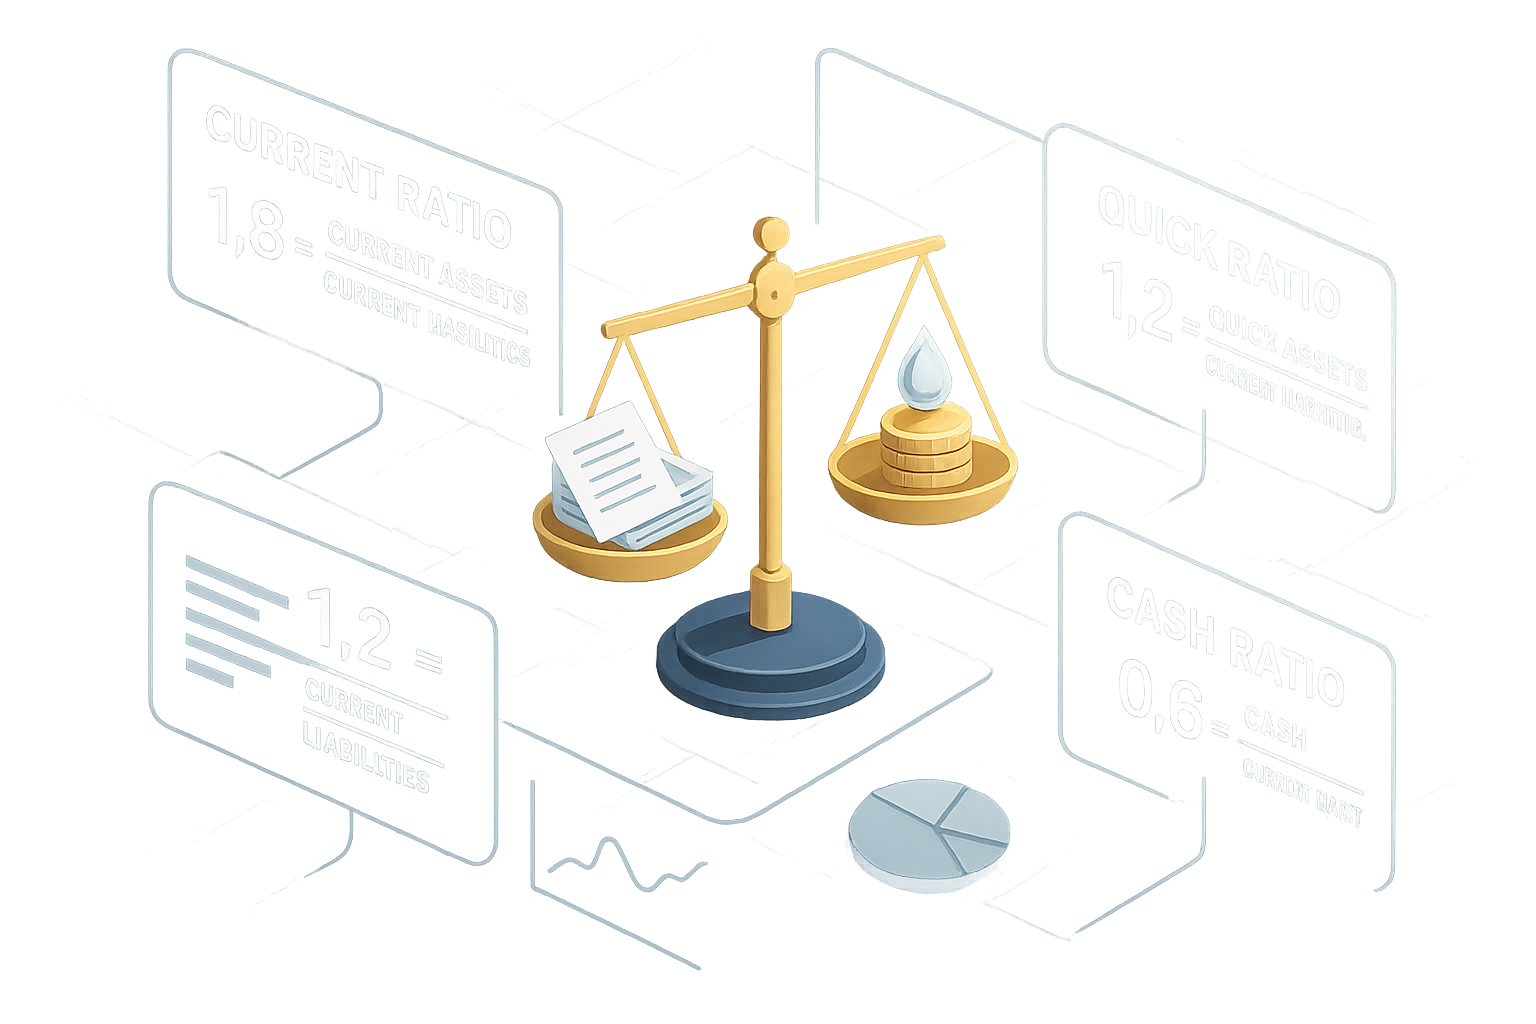
- The three core ratios, current, quick, and cash, provide increasingly conservative views of liquidity by progressively excluding less liquid assets from calculations
- Industry context matters significantly because acceptable liquidity levels vary dramatically across sectors based on business models and cash conversion cycles
- Trend analysis outweighs single-period snapshots as improving or deteriorating liquidity over time signals management effectiveness and operational health
- Liquidity analysis complements profitability metrics to create a complete financial picture, preventing the dangerous assumption that profitable companies always have sufficient cash
What Are Liquidity Ratios? Understanding the Foundation

Liquidity ratios are financial metrics that quantify a company’s capacity to satisfy short-term debts using assets convertible to cash within one year. These ratios form a cornerstone of fundamental analysis because they measure survival capability; the most basic requirement before growth or profitability even matters.
The Liquidity Concept Explained
Liquidity describes how quickly an asset converts to cash without significant value loss. Cash itself represents perfect liquidity. Marketable securities rank second, typically convertible within days. Accounts receivable follow, usually collectible within 30-90 days. Inventory sits lower on the liquidity spectrum, requiring time to sell and convert to cash.
This hierarchy matters because not all current assets provide equal payment capability. A company with $1 million in slow-moving inventory faces different liquidity realities than one holding $1 million in treasury bills, even though both appear identical on a balance sheet total.
Why Liquidity Ratios Matter
Financial distress rarely announces itself through profit warnings alone. Instead, it manifests as an inability to meet payroll, pay suppliers, or service debt, all liquidity failures. The 2008 financial crisis demonstrated this principle dramatically when profitable institutions collapsed within days due to liquidity evaporation.
For investors, liquidity ratios provide risk assessment tools. Companies with strong liquidity weather economic downturns better, maintain operational flexibility, and avoid forced asset sales at unfavorable prices. For creditors, these metrics predict default probability more accurately than profitability measures.
Business owners use liquidity analysis to prevent cash crunches before they become existential threats. Understanding the relationship between assets and liabilities enables proactive management of working capital, the lifeblood of operations.
The Balance Sheet Connection
All liquidity ratios derive from balance sheet basics, specifically the current assets and current liabilities sections. Current assets include cash, marketable securities, accounts receivable, and inventory, resources expected to convert to cash within 12 months. Current liabilities encompass accounts payable, short-term debt, accrued expenses, and other obligations due within one year.
The relationship between these two categories determines liquidity health. When current assets substantially exceed current liabilities, the company maintains a cushion for unexpected expenses or revenue shortfalls. When liabilities approach or exceed assets, financial stress looms.
Insight: Liquidity represents financial oxygen. Profitability matters for long-term value creation, but liquidity determines whether a company survives to realize that value. Both metrics serve essential but distinct purposes in comprehensive financial analysis.
The Three Primary Liquidity Ratios: Formulas and Calculations
Three ratios dominate liquidity analysis, each offering progressively conservative perspectives on payment capability. Understanding their formulas, differences, and appropriate applications builds analytical precision.
Current Ratio: The Broad Liquidity Measure
The current ratio provides the most comprehensive liquidity assessment by comparing all current assets to all current liabilities.
Formula:
Current Ratio = Current Assets ÷ Current LiabilitiesExample Calculation:
- Current Assets: $800,000
- Current Liabilities: $400,000
- Current Ratio: $800,000 ÷ $400,000 = 2.0
A current ratio of 2.0 indicates the company holds $2 in current assets for every $1 of current liabilities. This 2:1 relationship traditionally signals healthy liquidity, though optimal levels vary by industry.
The current ratio’s strength lies in its comprehensiveness; it captures the full spectrum of near-term resources. Its weakness stems from this same attribute. Including inventory assumes it will convert to cash quickly, an assumption that fails during economic slowdowns or for businesses with obsolete stock.
Quick Ratio (Acid-Test Ratio): The Conservative View
The quick ratio eliminates inventory and prepaid expenses from current assets, focusing exclusively on highly liquid resources. This conservative approach earned it the nickname “acid-test ratio”; it tests whether a company survives immediate financial pressure.
Formula:
Quick Ratio = (Current Assets - Inventory - Prepaid Expenses) ÷ Current LiabilitiesAlternative Formula:
Quick Ratio = (Cash + Marketable Securities + Accounts Receivable) ÷ Current LiabilitiesExample Calculation:
- Cash: $200,000
- Marketable Securities: $150,000
- Accounts Receivable: $250,000
- Current Liabilities: $400,000
- Quick Ratio: ($200,000 + $150,000 + $250,000) ÷ $400,000 = 1.5
A quick ratio of 1.5 means the company can cover current liabilities 1.5 times using only its most liquid assets. This metric proves particularly valuable for businesses with slow inventory turnover or seasonal sales patterns.
The quick ratio addresses the current ratio’s inventory assumption problem. However, it still assumes accounts receivable will convert to cash at face value, an assumption challenged by collection difficulties or customer defaults.
Cash Ratio: The Ultra-Conservative Standard
The cash ratio represents the most stringent liquidity test, considering only cash and cash equivalents against current liabilities. This metric answers the question: Can the company pay all short-term debts immediately using only available cash?
Formula:
Cash Ratio = (Cash + Cash Equivalents) ÷ Current LiabilitiesExample Calculation:
- Cash: $200,000
- Cash Equivalents (marketable securities): $150,000
- Current Liabilities: $400,000
- Cash Ratio: ($200,000 + $150,000) ÷ $400,000 = 0.875
A cash ratio of 0.875 indicates the company holds $0.88 in immediate cash resources for every $1 of current liabilities. While this appears low, cash ratios typically fall below 1.0 because maintaining excess cash reduces return on assets.
The cash ratio provides the clearest picture of immediate payment capability. Its limitation lies in excessive conservatism; few companies need to pay all liabilities simultaneously, making this metric most relevant during severe financial stress.
Comparison Table: Understanding the Differences
| Ratio | Assets Included | Conservatism Level | Best Used For |
|---|---|---|---|
| Current Ratio | All current assets | Least conservative | General liquidity screening |
| Quick Ratio | Cash, securities, receivables | Moderately conservative | Businesses with inventory concerns |
| Cash Ratio | Cash and equivalents only | Most conservative | Crisis scenarios, high-risk situations |
Takeaway: Each ratio serves specific analytical purposes. Comprehensive liquidity analysis examines all three metrics together, understanding that the gaps between them reveal important information about asset composition and quality.
How to Interpret Liquidity Ratios: Benchmarks and Context
Calculating ratios represents only the first step. Interpretation requires understanding industry norms, temporal trends, and business model specifics. A ratio that signals distress in one context might indicate health in another.
General Interpretation Guidelines
Current Ratio Benchmarks:
- Below 1.0: Warning signal, current liabilities exceed current assets, indicating potential payment difficulties
- 1.0 to 1.5: Adequate for many industries, though context-dependent
- 1.5 to 3.0: Generally healthy, providing a reasonable safety margin
- Above 3.0: Potentially excessive, may indicate inefficient asset utilization
Quick Ratio Benchmarks:
- Below 0.5: Concerning, limited liquid resources relative to obligations
- 0.5 to 1.0: Acceptable for many businesses with reliable cash flows
- 1.0 to 2.0: Strong liquidity position
- Above 2.0: Very conservative, possibly holding excess liquid assets
Cash Ratio Benchmarks:
- Below 0.2: Common for many healthy businesses
- 0.2 to 0.5: Solid immediate liquidity
- 0.5 to 1.0: Exceptional cash position
- Above 1.0: Unusual, may signal strategic cash accumulation or inefficient capital deployment
These benchmarks provide starting points, not absolute standards. Context transforms numbers into insights.
Industry Variations Matter Significantly
Retail businesses typically maintain lower liquidity ratios than technology companies because inventory turnover generates continuous cash flow. Utilities operate with minimal liquidity because revenue arrives predictably. Construction firms require higher ratios due to project-based cash flow volatility.
Consider two companies, both with current ratios of 1.2:
- Grocery Store: Excellent, inventory turns over weekly, generating constant cash
- Aircraft Manufacturer: Concerning production cycles that span months, requiring substantial liquidity cushions
The identical ratio carries opposite implications based on business model differences. This demonstrates why comparative analysis within industries provides more meaningful insights than absolute number interpretation.
Trend Analysis: The Time Dimension
A single ratio calculation captures one moment. Trend analysis reveals the trajectory, whether liquidity strengthens or deteriorates over time. This temporal perspective often matters more than absolute levels.
Improving Trends Signal:
- Effective working capital management
- Growing operational efficiency
- Strengthening competitive position
- Reduced financial risk
Deteriorating Trends Indicate:
- Potential cash flow problems are developing
- Inventory accumulation or collection difficulties
- Increasing reliance on short-term debt
- Operational challenges requiring investigation
Quarterly trend analysis over 2-3 years provides context that quarterly snapshots cannot. Seasonal businesses particularly require multi-year comparisons to distinguish normal patterns from concerning developments.
The Goldilocks Principle: Too High Can Signal Problems
Counterintuitively, excessively high liquidity ratios sometimes indicate problems rather than strength. A current ratio of 5.0 might suggest:
- Inefficient capital allocation: Excess cash earns minimal returns
- Missed growth opportunities: Resources sitting idle rather than funding expansion
- Inventory obsolescence: Unsold stock inflates current assets
- Poor working capital management: Uncollected receivables are accumulating
Optimal liquidity balances safety with efficiency. Companies should maintain sufficient buffers for unexpected challenges while deploying capital productively. This balance varies by risk tolerance, growth stage, and industry dynamics.
Understanding cash conversion cycles helps determine appropriate liquidity levels for specific business models. Fast-converting businesses require less liquidity cushion than those with extended operating cycles.
Insight: Numbers gain meaning through context. Industry comparison, trend analysis, and business model understanding transform raw ratios into actionable intelligence. The goal isn’t achieving specific numbers but maintaining appropriate liquidity for operational requirements and risk profile.
Practical Analysis: Using Liquidity Ratios for Decision-Making
Theory becomes valuable when applied to real decisions. Investors, creditors, and managers use liquidity analysis differently, but all seek to quantify financial risk and operational health.
For Investors: Assessing Company Health
Equity investors use liquidity ratios to evaluate financial stability before committing capital. Companies with strong liquidity demonstrate:
Operational Resilience: The ability to weather revenue disruptions without forced asset sales or emergency financing at unfavorable terms. During the 2020 pandemic, businesses with robust liquidity positions survived lockdowns while leveraged competitors failed.[2]
Management Quality: Consistent liquidity maintenance signals competent financial stewardship. Management teams that allow liquidity deterioration often exhibit broader operational weaknesses.
Dividend Safety: Companies paying dividends require sufficient liquidity to sustain payments during earnings volatility. Dividend investing strategies should incorporate liquidity analysis to avoid dividend cuts.
Investment Opportunity: Temporarily depressed stock prices for companies with strong liquidity but temporary earnings challenges can present compelling value opportunities. The market often overreacts to short-term problems, creating mispricings when fundamental liquidity remains solid.
When analyzing potential investments, compare liquidity ratios against:
- Industry peers: Relative positioning within sector
- Historical company performance: Trend direction and consistency
- Business cycle stage: Economic conditions affecting all companies
- Debt maturity schedule: Upcoming refinancing requirements
For Creditors: Evaluating Lending Risk
Banks, bondholders, and suppliers use liquidity ratios to assess repayment probability. Strong liquidity reduces default risk by ensuring cash availability for debt service.
Loan Underwriting: Credit decisions incorporate liquidity requirements, often mandating minimum current or quick ratios as loan covenants. Violations trigger technical defaults, enabling lenders to demand immediate repayment or renegotiate terms.
Credit Terms: Suppliers extend more favorable payment terms to customers with strong liquidity because collection risk decreases. This creates a virtuous cycle, good liquidity enables better terms, improving cash flow, and further strengthening liquidity.
Interest Rates: Borrowing costs correlate inversely with liquidity strength. Companies demonstrating robust liquidity can access capital at lower rates because lenders perceive reduced risk.
Understanding the relationship between debt ratios and liquidity provides a comprehensive credit risk assessment. High leverage becomes particularly dangerous when combined with weak liquidity.
For Business Owners: Managing Operations
Internal management uses liquidity analysis for operational decision-making and strategic planning.
Cash Flow Forecasting: Current liquidity levels inform realistic cash flow projections. A company with a 0.9 current ratio faces different planning constraints than one at 2.5.
Growth Decisions: Expansion requires capital. Liquidity analysis determines whether growth can be self-funded or requires external financing. Premature expansion with inadequate liquidity has destroyed countless businesses.
Supplier Negotiations: Understanding your liquidity position relative to payment obligations strengthens negotiating leverage for extended terms or early payment discounts.
Risk Management: Liquidity buffers provide insurance against unexpected challenges—customer defaults, supply disruptions, or market downturns. Determining appropriate buffer size requires analyzing historical volatility and forward-looking risks.
Implementing systematic liquidity monitoring prevents surprises. Monthly ratio calculations with variance analysis against targets enable proactive management before problems escalate. This connects to broader budgeting strategies that ensure financial discipline.
Red Flags: Warning Signs in Liquidity Analysis
Certain patterns demand immediate attention:
Declining Ratios Across All Three Metrics: Simultaneous deterioration in current, quick, and cash ratios signals serious problems requiring urgent investigation.
Widening Gaps Between Ratios: If the current ratio remains stable while quick and cash ratios decline, inventory or receivables issues likely exist.
Ratio Improvement Through Liability Reduction Only: Paying down payables while assets remain flat might indicate supplier pressure rather than genuine improvement.
Seasonal Patterns Breaking Down: Businesses with predictable seasonal liquidity cycles showing unexpected deviations face operational disruptions.
Industry Divergence: Company ratios moving opposite to industry trends suggest company-specific problems or opportunities requiring explanation.
Complementary Metrics for Complete Analysis
Liquidity ratios work best alongside other financial metrics:
- Debt-to-Equity Ratio: Assesses capital structure and long-term solvency
- Operating Cash Flow: Validates whether operations generate cash or consume it
- Days Sales Outstanding: Measures receivables collection efficiency
- Inventory Turnover: Evaluates how quickly inventory converts to sales
- Cash Flow Statement: Reveals sources and uses of cash beyond balance sheet snapshots
Comprehensive analysis integrates multiple perspectives. Liquidity ratios answer “Can they pay?” while profitability metrics address “Do they earn?” and leverage ratios examine “How much do they owe?” Together, these create complete financial pictures.
Takeaway: Liquidity analysis transforms from an academic exercise to a practical tool when applied to specific decisions. Whether investing capital, extending credit, or managing operations, these ratios quantify financial risk and inform evidence-based choices. The key lies in understanding what questions each ratio answers and how context shapes interpretation.
Advanced Considerations: Limitations and Nuances
Like all financial metrics, liquidity ratios contain limitations and require nuanced interpretation. Recognizing these constraints prevents overreliance and encourages comprehensive analysis.
The Static Nature Problem
Balance sheets capture single moments in time, typically quarter-end or year-end dates. Companies can manipulate these snapshots through “window dressing”—temporarily improving ratios for reporting dates.
Example Window Dressing Tactics:
- Delaying purchases until after period-end to reduce payables
- Accelerating collections before reporting dates to boost cash
- Postponing inventory acquisitions to lower current assets artificially
- Paying down short-term debt temporarily using credit lines
This manipulation means period-end ratios might not reflect typical operating conditions. Analyzing average balances throughout periods provides a more accurate picture than point-in-time snapshots.
Asset Quality Assumptions
Liquidity ratios assume assets convert to cash at book values. Reality often differs:
Accounts Receivable: Collectability varies dramatically. A company with $1 million in receivables from creditworthy customers differs fundamentally from one with $1 million owed by financially distressed clients. Allowance for doubtful accounts provides some adjustment, but management discretion affects these estimates.
Inventory: Book value rarely equals liquidation value. Fashion retailers holding last season’s inventory, technology companies with obsolete products, or manufacturers with specialized components face significant markdowns during forced sales. The difference between FIFO and LIFO accounting also affects inventory valuation.
Marketable Securities: While generally liquid, market conditions affect conversion values. During financial crises, even treasury securities can experience temporary liquidity constraints.
Liability Timing Matters
Current liabilities due tomorrow create different pressures than those due in 11 months, yet both receive identical treatment in ratio calculations. Analyzing debt maturity schedules alongside ratios provides crucial context.
A company with $10 million in current liabilities faces vastly different situations if:
- Scenario A: $8 million comes due next month
- Scenario B: Obligations spread evenly across 12 months
Identical current ratios mask this critical timing difference.
Industry-Specific Considerations
Certain industries require specialized liquidity interpretation:
Financial Institutions: Traditional ratios don’t apply because banks operate with high leverage by design. Regulatory capital ratios and loan-to-deposit ratios replace conventional liquidity metrics.
Real Estate Investment Trusts (REITs): Property holdings classified as non-current assets despite representing substantial value. Standard liquidity ratios understate true financial flexibility. Understanding REIT fundamentals requires different analytical frameworks.
Subscription Businesses: Deferred revenue appears as a liability but represents prepaid customer commitments, differing from traditional payables. This inflates liabilities, depressing ratios despite strong cash positions.
The Growth Stage Factor
Rapidly growing companies often show weak liquidity ratios while remaining fundamentally healthy. Growth consumes cash for inventory, receivables, and capacity expansion. These investments depress liquidity temporarily but create future value.
Conversely, declining businesses might show improving liquidity as they liquidate inventory and collect receivables without replacement, a temporary improvement masking deterioration.
Off-Balance-Sheet Considerations
Modern finance includes obligations not appearing on balance sheets:
- Operating Leases: Create payment obligations without corresponding liabilities (though recent accounting changes have reduced this issue)
- Letters of Credit: Represent contingent liabilities affecting true obligations
- Factoring Arrangements: Selling receivables removes them from assets while potentially masking collection problems
- Supply Chain Financing: Extends payables through third-party arrangements, artificially improving ratios
Comprehensive analysis examines footnotes and management discussion sections to identify these hidden factors.
The Working Capital Perspective
Analyzing absolute working capital (current assets minus current liabilities) alongside ratios provides additional insight. Two companies with identical current ratios of 2.0 face different realities if:
- Company A: $2 million assets, $1 million liabilities = $1 million working capital
- Company B: $200 million assets, $100 million liabilities = $100 million working capital
Company B’s larger absolute cushion provides greater flexibility despite identical ratios.
Insight: Financial analysis requires skepticism and context. Liquidity ratios provide valuable signals but not complete answers. Effective analysis combines multiple metrics, examines trends, considers industry specifics, and investigates underlying assumptions. The goal isn’t finding perfect metrics but building a comprehensive understanding through triangulation of imperfect measures.
Building Your Liquidity Analysis Framework
Developing systematic approaches to liquidity analysis creates consistency and prevents oversight. Whether analyzing investments or managing businesses, structured frameworks improve decision quality.
Step 1: Gather Accurate Data
Quality analysis requires quality inputs. Source financial data from:
Primary Sources:
- SEC filings (10-K, 10-Q reports) for public companies
- Audited financial statements for private companies
- Company investor relations websites
- Direct financial statements for owned businesses
Verification Steps:
- Cross-reference balance sheet totals against cash flow statements
- Confirm current asset and liability classifications match accounting standards
- Review footnotes for reclassifications or unusual items
- Check for restatements affecting historical comparisons
Step 2: Calculate All Three Ratios
Compute current, quick, and cash ratios for:
- Current period: Most recent quarter or year
- Historical periods: At least 8-12 quarters for trend analysis
- Peer companies: 3-5 direct competitors for context
Document calculations clearly, maintaining audit trails for future reference.
Step 3: Establish Benchmarks
Determine appropriate comparison standards:
Industry Averages: Research sector norms through:
- Industry association reports
- Financial data providers (Bloomberg, FactSet, S&P Capital IQ)
- Peer company analysis
- Academic research on sector-specific ratios
Company History: Establish the company’s normal range by analyzing 3-5 year historical patterns, adjusting for known operational changes.
Theoretical Minimums: Set absolute floors below which concern escalates regardless of industry norms (e.g., current ratio below 1.0).
Step 4: Analyze Trends and Patterns
Plot ratios over time, identifying:
- Direction: Improving, stable, or deteriorating
- Volatility: Consistent or erratic patterns
- Seasonality: Predictable cycles vs. irregular movements
- Inflection Points: When trends reversed and why
Connect ratio changes to operational events, such as acquisitions, product launches, market expansions, or competitive pressures.
Step 5: Investigate Composition
Decompose current assets and liabilities to understand what drives ratios:
Asset Breakdown:
- Cash percentage of current assets
- Receivables as a percentage (and days sales outstanding trend)
- Inventory as percentage (and turnover trend)
- Other current assets and their nature
Liability Breakdown:
- Accounts payable percentage and payment terms
- Short-term debt and refinancing requirements
- Accrued expenses and their predictability
- Other current liabilities and timing
This composition analysis reveals whether ratio changes reflect operational improvements or accounting shifts.
Step 6: Consider Qualitative Factors
Integrate non-numerical considerations:
Management Quality: Track record of financial stewardship and capital allocation decisions
Competitive Position: Market share trends and pricing power affecting cash generation
Economic Environment: Cycle stage and sector-specific headwinds or tailwinds
Strategic Initiatives: Planned expansions, acquisitions, or restructurings affecting future liquidity
Access to Capital: Banking relationships, credit ratings, and capital market access, providing backup liquidity
Step 7: Synthesize and Conclude
Combine quantitative and qualitative analysis into coherent assessments:
For Investment Decisions:
- Does liquidity support or contradict the investment thesis?
- What liquidity-related risks require monitoring?
- How does liquidity compare to valuation? Are you paying for safety or getting it free?
For Credit Decisions:
- What probability of payment difficulties exists?
- What covenant levels protect lender interests?
- What monitoring frequency and metrics ensure early problem detection?
For Operational Management:
- What liquidity target balances safety with efficiency?
- What early warning indicators trigger management action?
- What contingency plans address potential liquidity stress?
Creating Monitoring Dashboards
Systematic monitoring prevents surprises. Effective dashboards include:
Monthly Tracking:
- Current, quick, and cash ratios with trend charts
- Working capital absolute amount and trend
- Days’ sales outstanding and days payable outstanding
- Cash flow from operations (monthly and trailing 12-month)
Quarterly Deep Dives:
- Peer comparison updates
- Composition analysis of asset and liability changes
- Covenant compliance verification
- Forward-looking liquidity projections
Annual Reviews:
- Comprehensive ratio analysis across multiple years
- Benchmark recalibration based on strategic changes
- Stress testing under adverse scenarios
- Target adjustment based on evolving risk tolerance
This systematic approach transforms liquidity analysis from a periodic exercise to a continuous management discipline.
Takeaway: Frameworks create consistency and completeness. By following structured processes, analysts avoid overlooking critical factors and build institutional knowledge that improves over time. The investment in systematic approaches pays dividends through better decisions and fewer surprises.
Common Mistakes in Liquidity Analysis and How to Avoid Them
Even experienced analysts fall into predictable traps when evaluating liquidity. Recognizing these common errors improves analytical rigor.
Mistake 1: Relying on Single Ratios
The Error: Examining only the current ratio while ignoring quick and cash ratios creates incomplete pictures. Companies can maintain acceptable current ratios while holding excessive slow-moving inventory or uncollectible receivables.
The Solution: Always calculate all three primary liquidity ratios. The relationships between them reveal asset quality. Large gaps between current and quick ratios indicate inventory concerns. Gaps between quick and cash ratios suggest receivables issues.
Mistake 2: Ignoring Industry Context
The Error: Applying universal benchmarks across different industries leads to false conclusions. A 1.5 current ratio signals strength for grocery retailers but weakness for software companies.
The Solution: Always compare companies to industry peers and sector norms. Understand business model differences affecting appropriate liquidity levels. Research industry-specific working capital requirements before concluding.
Mistake 3: Snapshot Analysis Without Trends
The Error: Evaluating single-period ratios without historical context misses deteriorating or improving trajectories. A currently acceptable ratio might represent a dangerous decline from previously strong levels.
The Solution: Analyze a minimum of 8-12 quarters of historical data. Plot trends visually to identify patterns. Investigate inflection points where trends changed direction. Consider whether current ratios represent peaks, troughs, or sustainable levels.
Mistake 4: Overlooking Seasonal Patterns
The Error: Comparing ratios from different seasonal periods creates false alarms or misplaced confidence. Retailers naturally show different liquidity in November (pre-holiday inventory buildup) versus January (post-holiday cash collection).
The Solution: Compare the same periods year-over-year (Q4 2025 vs. Q4 2024) rather than sequential quarters. Understand normal seasonal patterns before flagging deviations. Analyze full-year averages to smooth seasonal volatility.
Mistake 5: Assuming Book Values Equal Market Values
The Error: Treating all current assets as equally liquid ignores collectability, obsolescence, and market conditions affecting conversion values.
The Solution: Investigate asset composition and quality. Review allowances for doubtful accounts and inventory obsolescence. Consider industry conditions affecting liquidation values. Apply haircuts to book values when appropriate for conservative analysis.
Mistake 6: Neglecting Liability Timing
The Error: Treating all current liabilities identically, regardless of payment timing, creates false equivalence between immediate obligations and those due months away.
The Solution: Review debt maturity schedules in financial statement footnotes. Identify concentrated payment requirements. Consider whether refinancing options exist for maturing debt. Analyze payment terms with major suppliers.
Mistake 7: Ignoring Cash Flow Statements
The Error: Focusing exclusively on balance sheet ratios without examining whether operations generate or consume cash misses fundamental sustainability questions.
The Solution: Always review operating cash flow alongside liquidity ratios. Positive operating cash flow validates balance sheet strength. Negative operating cash flow, despite acceptable ratios, signals asset liquidation rather than operational health. Understanding cash flow fundamentals prevents this oversight.
Mistake 8: Missing Off-Balance-Sheet Obligations
The Error: Analyzing only reported balance sheet items while ignoring contingent liabilities, operating leases, or other commitments understates true obligations.
The Solution: Read financial statement footnotes thoroughly. Identify operating leases, letters of credit, guarantees, and other commitments. Adjust mental models of true liquidity to reflect these obligations.
Mistake 9: Forgetting the Business Model
The Error: Applying identical analytical frameworks to fundamentally different business models produces misleading conclusions.
The Solution: Understand how the specific business generates and uses cash. Subscription models, project-based businesses, and product companies require different liquidity levels. Tailor analysis to operational realities rather than forcing universal templates.
Mistake 10: Analysis Paralysis
The Error: Becoming so focused on ratio precision that broader context and judgment get lost. Financial analysis supports decisions; it doesn’t replace judgment.
The Solution: Remember that ratios provide signals requiring investigation, not definitive answers. Combine quantitative metrics with qualitative assessment. Develop a point of view based on the preponderance of evidence rather than waiting for perfect certainty that never arrives.
Insight: Awareness of common mistakes represents the first step toward avoiding them. Systematic analytical frameworks, peer review processes, and intellectual humility reduce error rates. The goal isn’t perfection but continuous improvement in analytical quality and decision-making outcomes.
Conclusion: Mastering Liquidity Analysis for Better Financial Decisions
Liquidity ratios represent fundamental tools in the financial analysis toolkit. They answer critical questions about short-term financial health that profitability metrics alone cannot address. A company might generate impressive profits while simultaneously facing cash shortages that threaten survival; liquidity analysis prevents this blindness.
The three primary ratios, current, quick, and cash, provide progressively conservative views of payment capability. Together, they reveal not just whether a company can meet obligations but also the quality of assets backing those capabilities. The current ratio offers a comprehensive assessment, the quick ratio tests without inventory reliance, and the cash ratio measures immediate payment capacity.
Yet numbers alone tell incomplete stories. Context transforms data into insight. Industry norms, historical trends, business model specifics, and qualitative factors all shape interpretation. A 1.2 current ratio might signal strength for one company and weakness for another based on these contextual elements.
Practical application matters more than theoretical knowledge. Investors use liquidity analysis to assess financial stability before committing capital. Creditors evaluate repayment probability and set lending terms accordingly. Business owners monitor liquidity to prevent cash crunches and maintain operational flexibility. Each constituency applies the same metrics toward different decisions, but all benefit from quantifying financial risk.
The limitations of liquidity ratios demand recognition. Static balance sheet snapshots, asset quality assumptions, timing considerations, and off-balance-sheet obligations all affect interpretation. Comprehensive analysis combines multiple metrics, examines trends over time, and integrates qualitative judgment with quantitative measurement.
Building systematic analytical frameworks improves consistency and completeness. Following structured processes for data gathering, calculation, benchmarking, trend analysis, and synthesis prevents oversight and builds institutional knowledge. Monitoring dashboards enable proactive management rather than reactive crisis response.
Common mistakes, single ratio reliance, ignoring industry context, snapshot analysis, and overlooking cash flows, plague even experienced analysts. Awareness of these pitfalls, combined with disciplined processes, reduces error rates and improves decision quality.
The path forward requires action:
- Calculate liquidity ratios for companies you invest in, lend to, or manage
- Establish benchmarks based on industry research and historical patterns
- Monitor trends quarterly to identify improving or deteriorating trajectories
- Investigate the composition to understand what drives ratio changes
- Integrate with other metrics for a comprehensive financial assessment
- Apply judgment based on business model understanding and qualitative factors
Financial literacy builds wealth through better decisions. Understanding liquidity ratios represents one component of comprehensive financial knowledge. Combined with profitability analysis, valuation principles, and risk management frameworks, these tools enable evidence-based investing and business management.
The math behind money reveals itself through systematic analysis. Liquidity ratios quantify the relationship between resources and obligations, providing early warning signals about financial stress. Companies with strong liquidity weather storms, seize opportunities, and avoid forced decisions at unfavorable times.
Master these metrics. Apply them consistently. Combine them with broader financial knowledge. The result: better investment selections, more informed credit decisions, and more effective business management. Financial success stems from understanding how money works—and liquidity analysis provides crucial insight into that understanding.
Start today. Pull financial statements for a company you’re interested in. Calculate the three ratios. Compare them to industry peers. Analyze the trend. Investigate what drives the numbers. Transform theoretical knowledge into practical skill through application.
The companies that survive and thrive demonstrate not just profitability but liquidity. The investors who build wealth recognize this distinction. The creditors who avoid losses assess payment capability. The business owners who succeed maintain adequate liquidity buffers.
Join them by mastering liquidity analysis, a fundamental skill in the data-driven approach to financial decision-making.
💧 Liquidity Ratio Calculator
Calculate and analyze your company’s liquidity position
References
[1] Federal Reserve Bank of St. Louis. (2009). “The Financial Crisis: Causes and Consequences.” Economic Research Division.
[2] McKinsey & Company. (2021). “How COVID-19 Has Pushed Companies Over the Technology Tipping Point, and Transformed Business Forever.” McKinsey Global Survey.
Author Bio
Max Fonji is the founder of The Rich Guy Math, a data-driven financial education platform dedicated to teaching the mathematical principles behind wealth building, investing, and risk management. With expertise in financial analysis and valuation, Max translates complex financial concepts into clear, actionable insights for investors and business owners. His evidence-based approach emphasizes understanding cause and effect in financial decisions rather than following trends or hype.
Educational Disclaimer
This article provides educational information about liquidity ratios and financial analysis techniques. It does not constitute financial, investment, or professional advice. Financial ratios represent analytical tools requiring context, judgment, and comprehensive analysis. Individual circumstances, risk tolerance, and objectives vary significantly.
Before making investment, lending, or business decisions, consult qualified financial professionals who understand your specific situation. Past financial performance does not guarantee future results. All investments and business activities involve risk, including potential loss of principal.
The Rich Guy Math provides educational content to improve financial literacy and analytical skills. Readers bear sole responsibility for their financial decisions and should conduct thorough due diligence before committing capital or making material business changes.
Frequently Asked Questions
What is a good liquidity ratio?
A good liquidity ratio depends on industry and business model, but general guidelines suggest a current ratio between 1.5 and 3.0, a quick ratio above 1.0, and a cash ratio above 0.5. However, these benchmarks vary significantly—retailers often operate successfully with lower ratios due to fast inventory turnover, while construction companies require higher ratios due to project-based cash flows. Compare ratios to industry peers rather than universal standards for meaningful assessment.
What’s the difference between current ratio and quick ratio?
The current ratio includes all current assets (cash, marketable securities, accounts receivable, and inventory) divided by current liabilities, while the quick ratio excludes inventory and prepaid expenses from current assets. The quick ratio provides a more conservative liquidity measure because inventory requires time to sell and convert to cash. The gap between these ratios reveals how much liquidity depends on inventory—larger gaps indicate greater inventory reliance.
Can a company have too much liquidity?
Yes, excessively high liquidity ratios can indicate inefficient capital deployment. While adequate liquidity provides safety, excess cash earns minimal returns compared to productive investments in growth, equipment, or returning capital to shareholders. A current ratio above 3.0 or cash ratio above 1.0 might suggest management is too conservative or lacks profitable investment opportunities. Optimal liquidity balances safety with efficiency.
How often should liquidity ratios be calculated?
Public companies should calculate liquidity ratios quarterly when financial statements are released. Private businesses benefit from monthly calculations to enable proactive management. Investors should review ratios quarterly for portfolio holdings and annually for broader market screening. More frequent monitoring makes sense during periods of financial stress, rapid growth, or significant operational changes.
What causes liquidity ratios to decline?
Liquidity ratios decline when current liabilities grow faster than current assets. Common causes include: increasing accounts payable due to payment delays, accumulating short-term debt, growing inventory without corresponding sales increases, deteriorating accounts receivable collection, or declining cash from operations. Investigating which specific balance sheet items changed reveals the root cause and appropriate management response.
Do liquidity ratios apply to personal finance?
Yes, individuals can apply liquidity concepts to personal financial management. Personal liquidity equals liquid assets (cash, savings, money market funds) divided by monthly expenses. A personal liquidity ratio of 6–12 represents a healthy emergency fund covering 6–12 months of expenses. This concept parallels business liquidity analysis—ensuring resources exist to meet obligations even during income disruptions.