Picture this: You’re running a lemonade stand on a hot summer day. You’ve sold 50 cups at $2 each, and you’re wondering—if I sell one more cup, how much extra money will I actually make? That simple question is the foundation of one of the most powerful concepts in business and economics: marginal revenue. Whether you’re a small business owner, an aspiring entrepreneur, or someone trying to understand how companies make smart financial decisions, understanding marginal revenue is your secret weapon for maximizing profits and making data-driven decisions.
TL;DR
- Marginal revenue is the additional income earned from selling one more unit of a product or service
- The basic marginal revenue formula is: MR = Change in Total Revenue ÷ Change in Quantity Sold
- In perfect competition, marginal revenue equals the selling price, but in most real-world markets, marginal revenue decreases as you sell more units
- Businesses use marginal revenue alongside marginal cost to determine the optimal production level and maximize profits
- Understanding marginal revenue helps investors analyze company pricing strategies and evaluate business performance more effectively
What Is Marginal Revenue? The Simple Definition
In simple terms, marginal revenue means the extra money a business earns when it sells one additional unit of its product or service.
Marginal revenue (MR) is a fundamental economic concept that measures the change in total revenue resulting from selling one more unit. It’s the financial answer to the question: “What happens to my income if I increase sales by just one item?”
Think of it this way: If your bakery earns $1,000 from selling 100 cupcakes, and then earns $1,009 from selling 101 cupcakes, your marginal revenue for that 101st cupcake is $9. Notice it’s not the full selling price—that’s the key insight that makes marginal revenue so powerful for business decisions.
Why Marginal Revenue Matters
Understanding marginal revenue is crucial for several reasons:
- Profit optimization: It helps businesses determine the ideal production quantity
- Pricing strategy: Companies use it to set competitive prices that maximize revenue
- Resource allocation: It guides decisions about where to invest time, money, and effort
- Market analysis: Investors use marginal revenue trends to evaluate company performance and growth potential
- Economic efficiency: It reveals when producing more actually hurts profitability
According to the CFA Institute, marginal analysis—which includes marginal revenue—is one of the core principles of microeconomics and financial decision-making that every business professional should master.
The Marginal Revenue Formula: How to Calculate It
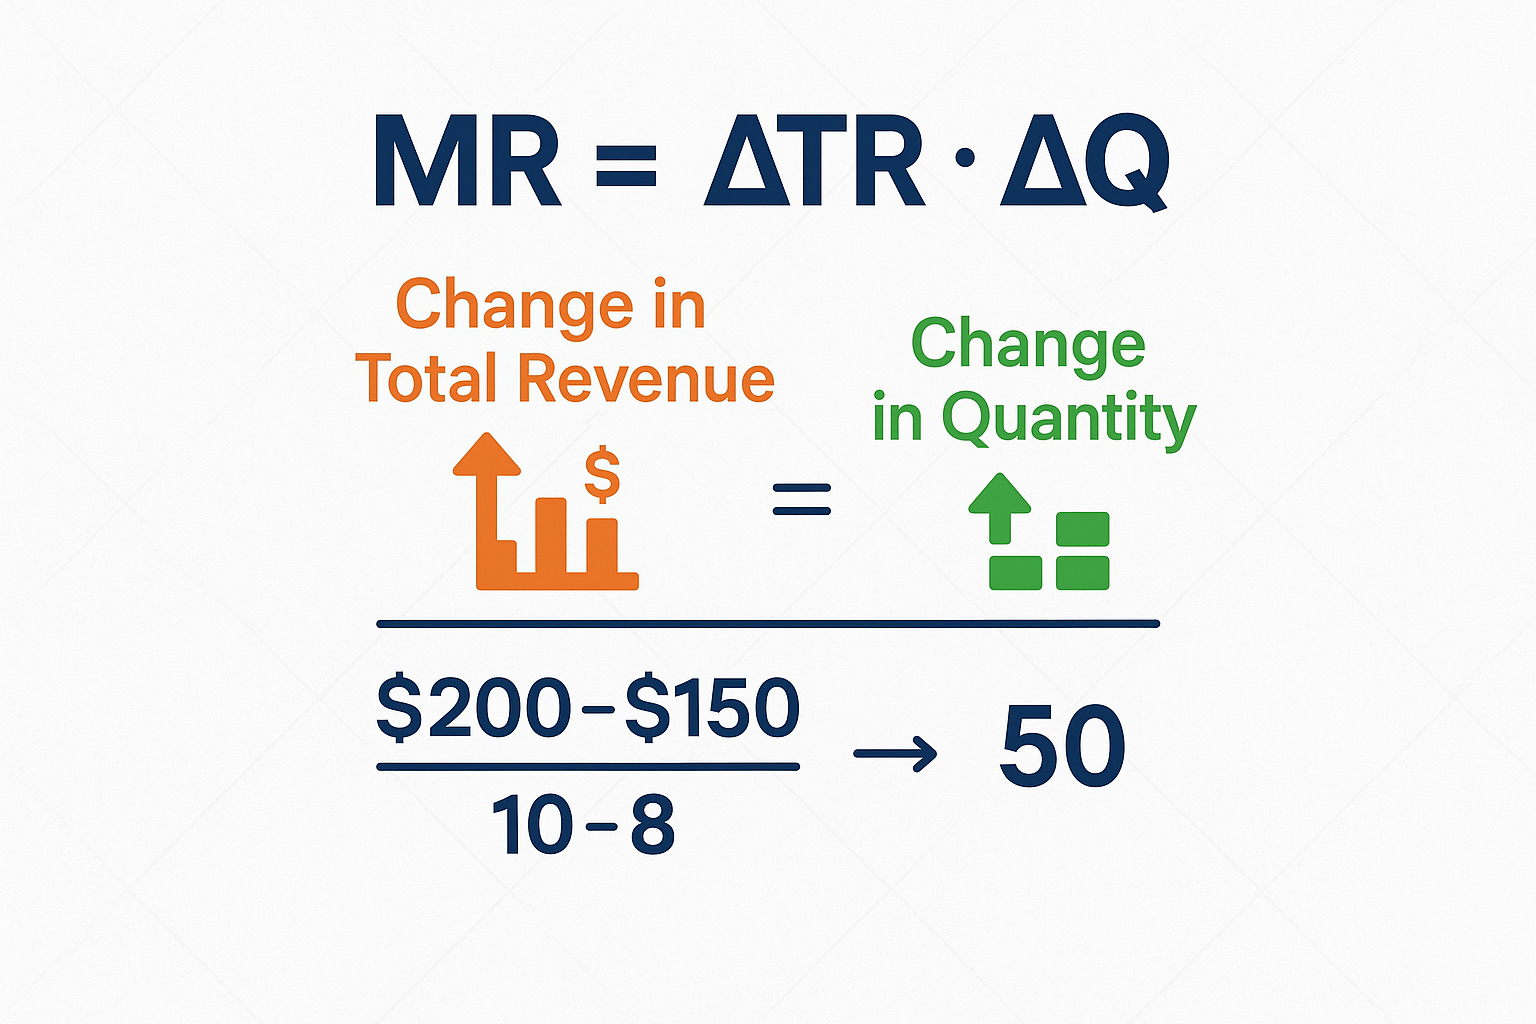
The formula for marginal revenue is: MR = ΔTR ÷ ΔQ
Where:
- MR = Marginal Revenue
- ΔTR = Change in Total Revenue
- ΔQ = Change in Quantity Sold
- Δ (delta) = “change in”
Breaking Down the Formula
Let’s make this crystal clear with a step-by-step breakdown:
- Calculate your initial total revenue: Multiply the number of units sold by the price per unit
- Calculate your new total revenue: After selling additional units, multiply the new quantity by the new price
- Find the change in total revenue: Subtract the initial revenue from the new revenue
- Find the change in quantity: Subtract the initial quantity from the new quantity
- Divide: Change in revenue ÷ Change in quantity = Marginal Revenue
Alternative Formula for Price-Takers
In perfectly competitive markets where businesses are “price-takers” (they can’t influence market price), the formula simplifies beautifully:
MR = Price
This happens because in perfect competition, a company can sell as many units as it wants at the market price without affecting that price. Each additional unit sold brings in exactly the market price as additional revenue.
However, most real-world businesses operate in imperfectly competitive markets, where selling more units typically requires lowering prices, making the standard formula more applicable.
Marginal Revenue Examples: Real-World Calculations
Let’s work through several practical examples to cement your understanding.
Example 1: The Coffee Shop
Sarah’s Coffee Shop currently sells 200 lattes per day at $5 each.
- Current situation: 200 lattes × $5 = $1,000 total revenue
- New situation: Sarah lowers the price to $4.95 and sells 210 lattes = $1,039.50 total revenue
Calculating marginal revenue:
- Change in total revenue: $1,039.50 – $1,000 = $39.50
- Change in quantity: 210 – 200 = 10 lattes
- Marginal revenue: $39.50 ÷ 10 = $3.95 per latte
Notice that the marginal revenue ($3.95) is less than the selling price ($4.95). This happens because Sarah had to lower the price on all units to sell more, not just the additional ones.
Example 2: The Software Company
TechFlow Inc. sells project management software subscriptions.
| Quantity Sold | Price per Subscription | Total Revenue | Marginal Revenue |
|---|---|---|---|
| 100 | $50 | $5,000 | — |
| 101 | $50 | $5,050 | $50 |
| 102 | $50 | $5,100 | $50 |
| 103 | $50 | $5,150 | $50 |
In this example, TechFlow operates in a competitive market where it can sell additional subscriptions without changing the price. Here, marginal revenue equals the price ($50) for each additional subscription.
Example 3: The Declining Marginal Revenue Scenario
Premium Headphones Co. faces decreasing marginal revenue as it expands sales:
| Units Sold | Price | Total Revenue | Marginal Revenue |
|---|---|---|---|
| 10 | $200 | $2,000 | — |
| 20 | $190 | $3,800 | $180 |
| 30 | $180 | $5,400 | $160 |
| 40 | $170 | $6,800 | $140 |
| 50 | $160 | $8,000 | $120 |
This table illustrates the law of diminishing marginal revenue: as the company sells more units, it must progressively lower prices, causing marginal revenue to decline. This is typical for businesses with pricing power in monopolistic or oligopolistic markets.
Marginal Revenue vs Marginal Cost: The Profit-Maximizing Connection
Understanding marginal revenue alone isn’t enough—the real magic happens when you compare it to marginal cost (MC).
What Is Marginal Cost?
Marginal cost is the additional expense incurred from producing one more unit. It includes materials, labor, and variable overhead directly tied to that extra unit.
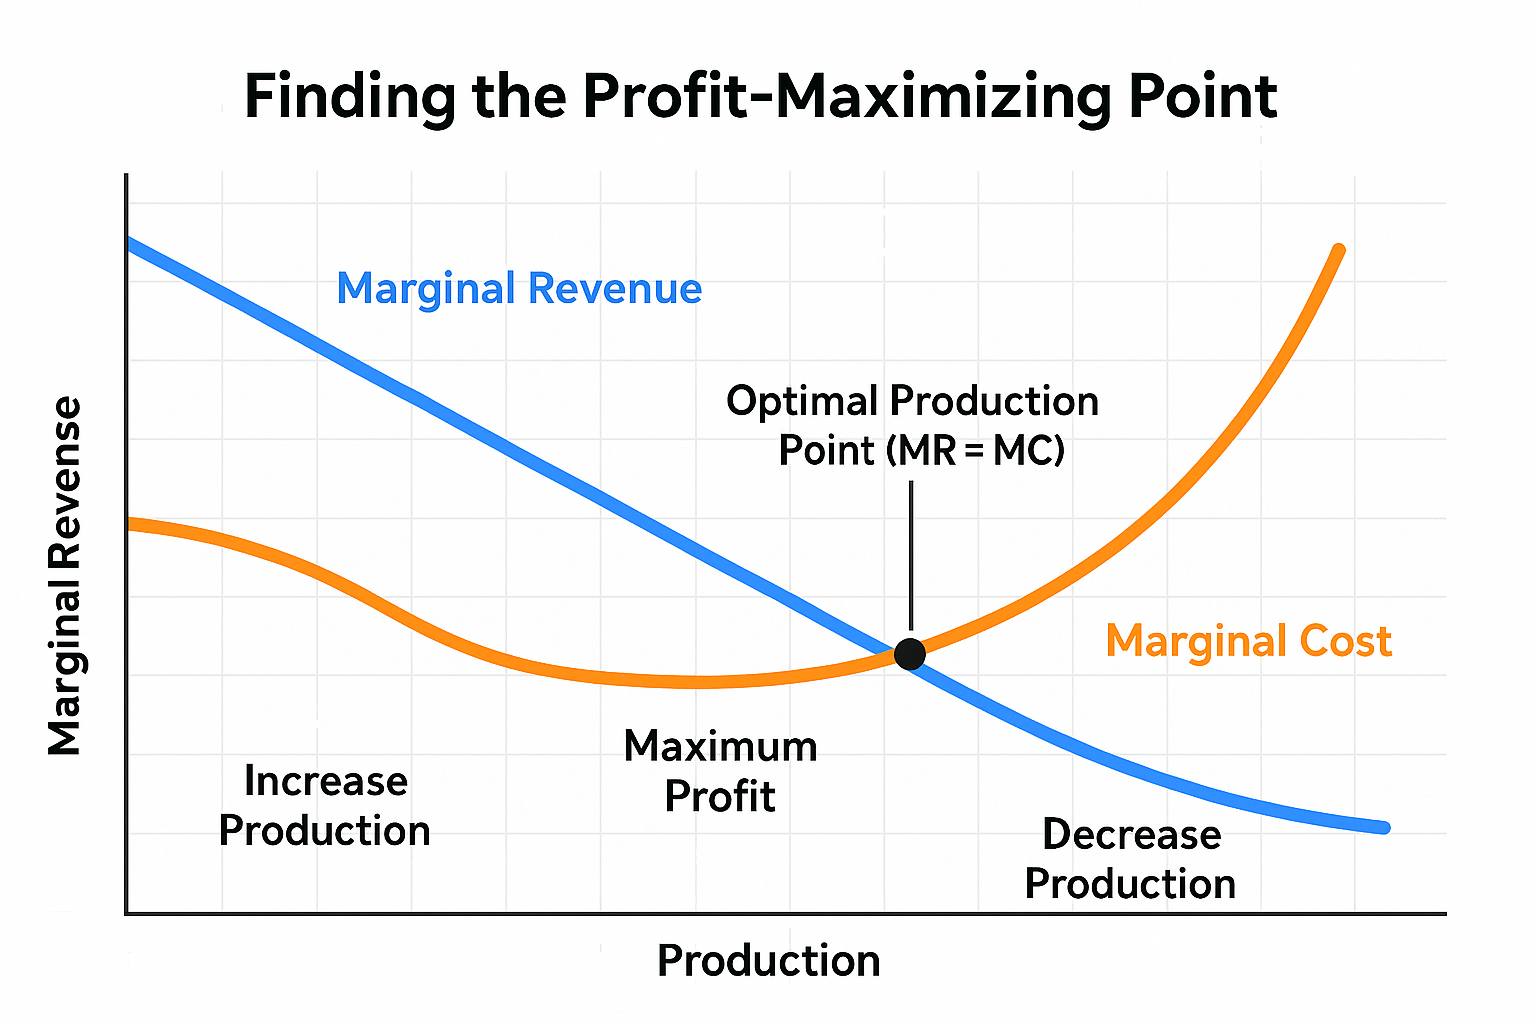
The Golden Rule of Profit Maximization
“A business maximizes profit when marginal revenue equals marginal cost (MR = MC).”
Here’s why this rule works:
- When MR > MC: The revenue from selling one more unit exceeds the cost of making it—produce more!
- When MR < MC: The cost of producing one more unit exceeds the revenue it generates—produce less!
- When MR = MC: You’ve hit the sweet spot—this is your optimal production level
Practical Example: The T-Shirt Business
Urban Threads manufactures custom t-shirts:
| Quantity | Total Revenue | Total Cost | Marginal Revenue | Marginal Cost | Profit |
|---|---|---|---|---|---|
| 0 | $0 | $500 | — | — | -$500 |
| 100 | $2,000 | $1,500 | $20 | $10 | $500 |
| 200 | $3,800 | $2,400 | $18 | $9 | $1,400 |
| 300 | $5,400 | $3,600 | $16 | $12 | $1,800 |
| 400 | $6,800 | $5,200 | $14 | $16 | $1,600 |
| 500 | $8,000 | $7,200 | $12 | $20 | $800 |
Analysis: Profit peaks at 300 units ($1,800). Beyond that point, marginal cost exceeds marginal revenue, and total profit actually declines. This demonstrates why businesses shouldn’t always produce and sell as much as possible—there’s an optimal point determined by the MR = MC principle.
This concept is fundamental to making smart financial decisions in business and investing.
Types of Market Structures and Their Impact on Marginal Revenue
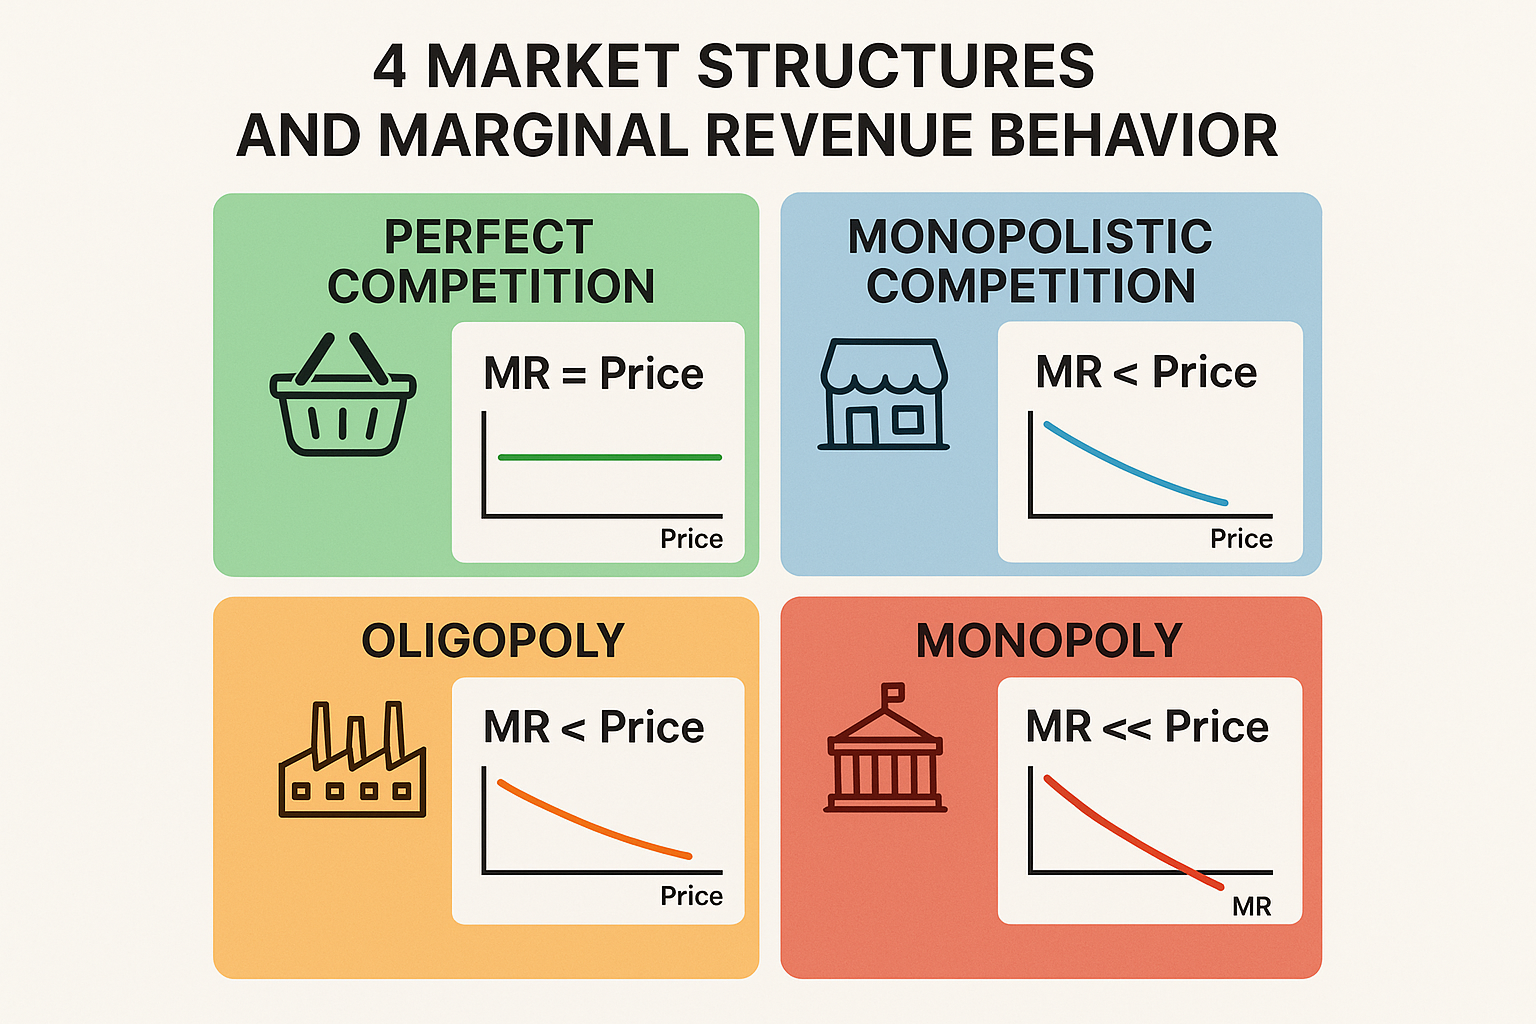
Marginal revenue behaves differently depending on the market structure a business operates in. Let’s explore the four main types:
1. Perfect Competition
Characteristics:
- Many small sellers
- Identical products
- No barriers to entry
- Businesses are price-takers
Marginal Revenue Behavior:
- MR = Market Price (constant)
- Perfectly horizontal demand curve
- Companies can sell unlimited quantities at market price
Example: Agricultural commodities like wheat or corn
2. Monopolistic Competition
Characteristics:
- Many sellers with differentiated products
- Some pricing power
- Low barriers to entry
Marginal Revenue Behavior:
- MR < Price
- MR decreases as the quantity increases
- Downward-sloping demand curve
Example: Restaurants, clothing brands, local services
3. Oligopoly
Characteristics:
- A few large sellers
- Significant barriers to entry
- Interdependent pricing decisions
Marginal Revenue Behavior:
- MR < Price
- Can be unpredictable due to competitor reactions
- Strategic pricing considerations
Example: Automobile manufacturers, airlines, telecommunications
4. Monopoly
Characteristics:
- Single seller
- Unique product with no close substitutes
- High barriers to entry
Marginal Revenue Behavior:
- MR < Price (significantly)
- MR can become negative at high quantities
- Maximum pricing power
Example: Utility companies, patented pharmaceuticals (temporarily)
According to Investopedia, understanding these market structures helps investors analyze competitive positioning and pricing power—key factors in evaluating stock market opportunities.
How to Interpret Marginal Revenue: Reading the Signals
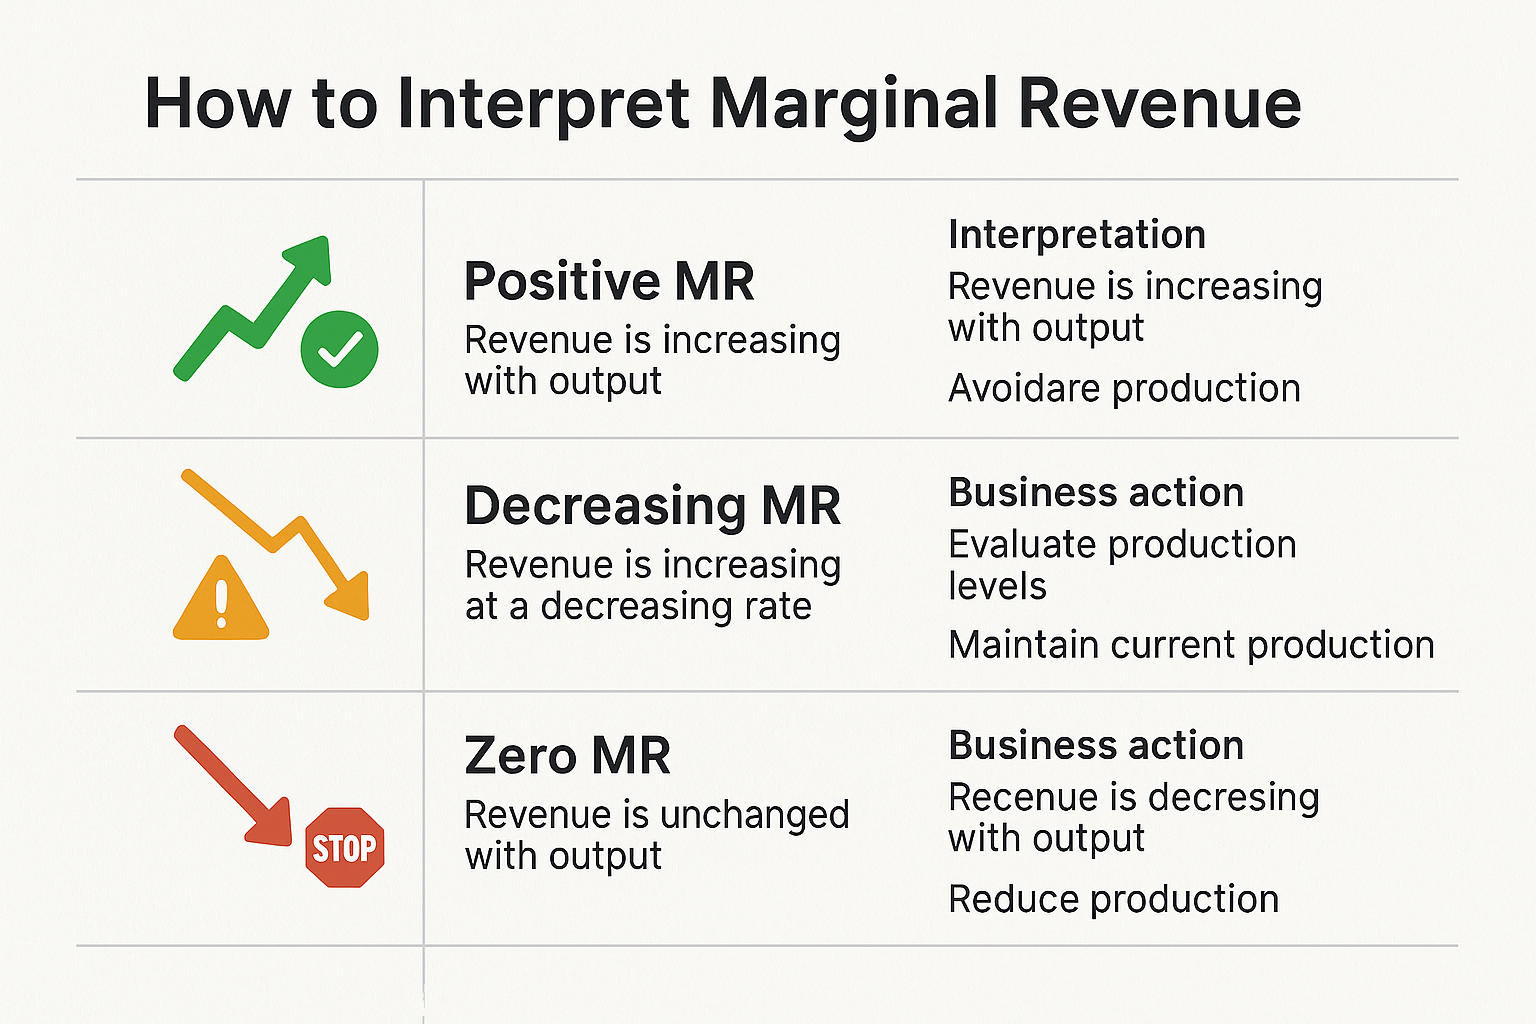
Marginal revenue tells you a story about your business or investment. Here’s how to read those signals:
Positive Marginal Revenue
What it means: Each additional unit sold increases total revenue.
Business implication: There’s still room to grow sales profitably (assuming MR > MC).
Investor insight: The company has pricing power and growth potential.
Decreasing Marginal Revenue
What it means: Each additional unit adds less revenue than the previous one.
Business implication: Market saturation or price competition is intensifying.
Investor insight: The company may need to innovate, enter new markets, or improve efficiency to maintain growth.
Zero Marginal Revenue
What it means: Selling one more unit doesn’t change total revenue.
Business implication: You’ve reached the revenue-maximizing quantity (but not necessarily profit-maximizing).
Investor insight: Revenue growth may stall unless the company pivots its strategy.
Negative Marginal Revenue
What it means: Selling additional units actually decreases total revenue.
Business implication: You’re producing too much, and price cuts are overwhelming volume gains.
Investor insight: This is a red flag indicating a poor pricing strategy or oversupply.
Marginal Revenue in Business Decision-Making
Smart businesses use marginal revenue analysis for multiple strategic decisions:
1. Pricing Strategy Optimization
By understanding how price changes affect marginal revenue, companies can:
- Set prices that maximize total revenue
- Identify the optimal discount levels
- Determine when premium pricing is sustainable
2. Production Planning
Marginal revenue guides:
- How many units to manufacture
- When to expand or contract operations
- Whether to invest in additional capacity
3. Marketing Investment Decisions
Businesses evaluate:
- Whether advertising spending generates sufficient marginal revenue
- Which customer segments offer the highest marginal revenue
- When to launch promotional campaigns
4. Product Line Decisions
Companies assess:
- Whether to introduce new products
- Which products to discontinue
- How to allocate resources across product lines
According to the U.S. Federal Reserve, businesses that effectively use marginal analysis demonstrate better resilience during economic cycles and market volatility.
Advantages and Limitations of Marginal Revenue Analysis
Advantages
1. Precision in Decision-Making
- Provides quantitative data for production and pricing decisions
- Removes guesswork from strategic planning
2. Profit Optimization
- Identifies the exact point of maximum profitability
- Prevents overproduction and underproduction
3. Resource Efficiency
- Helps allocate capital, labor, and materials optimally
- Reduces waste and improves operational efficiency
4. Competitive Analysis
- Reveals market positioning and pricing power
- Helps investors compare companies within industries
5. Scalability Assessment
- Shows whether growth strategies will actually increase profits
- Identifies natural limits to expansion
Limitations and Challenges
1. Assumes Rational Behavior
- Real consumers don’t always act predictably
- Market conditions can change rapidly
2. Data Requirements
- Requires accurate cost and revenue tracking
- Small businesses may lack sophisticated data systems
3. Short-Term Focus
- May overlook long-term strategic value
- Doesn’t account for brand building or customer lifetime value
4. Complexity in Multi-Product Businesses
- Difficult to isolate the marginal revenue for individual products
- Interdependencies between product lines complicate analysis
5. External Factors
- Doesn’t account for competitor reactions
- Economic conditions, regulations, and technology shifts can disrupt calculations
6. Fixed Cost Blind Spot
- Marginal analysis focuses on variable costs
- Can lead to underestimating the total cost structure
The SEC emphasizes in corporate filings that investors should consider marginal revenue trends alongside other financial metrics for comprehensive analysis.
Marginal Revenue vs Related Concepts: Clearing the Confusion
Let’s distinguish marginal revenue from similar but distinct concepts:
Marginal Revenue vs Total Revenue
| Aspect | Marginal Revenue | Total Revenue |
|---|---|---|
| Definition | Revenue from one additional unit | Revenue from all units sold |
| Formula | ΔTR ÷ ΔQ | Price × Quantity |
| Purpose | Optimization decisions | Overall business performance |
| Focus | Incremental change | Aggregate result |
See our full guide on Total Revenue
Marginal Revenue vs Average Revenue
| Aspect | Marginal Revenue | Average Revenue |
|---|---|---|
| Definition | Revenue from next unit | Revenue per unit sold |
| Formula | ΔTR ÷ ΔQ | Total Revenue ÷ Quantity |
| Relationship | Can be above or below average | Always equals price |
| Use Case | Production decisions | Pricing analysis |
Marginal Revenue vs Marginal Profit
| Aspect | Marginal Revenue | Marginal Profit |
|---|---|---|
| Definition | Additional revenue | Additional profit |
| Formula | ΔTR ÷ ΔQ | MR – MC |
| Focus | Revenue side only | Complete profitability picture |
| Optimal Point | Not necessarily maximum profit | Maximum at zero |
Understanding these distinctions helps investors make smarter decisions when analyzing company financials.
Common Mistakes to Avoid When Using Marginal Revenue
Even experienced business owners and investors make these errors:
Mistake #1: Confusing Marginal Revenue with Price
The error: Assuming marginal revenue always equals the selling price.
The reality: Only true in perfectly competitive markets. In most cases, MR < Price because you must lower prices to sell more.
How to avoid: Always calculate actual marginal revenue using the formula; don’t assume.
Mistake #2: Ignoring Marginal Cost
The error: Maximizing revenue instead of profit.
The reality: High marginal revenue means nothing if marginal cost is even higher.
How to avoid: Always analyze MR and MC together. Profit maximization requires MR = MC.
Mistake #3: Using Outdated Data
The error: Basing decisions on historical marginal revenue without considering market changes.
The reality: Consumer preferences, competition, and economic conditions constantly shift.
How to avoid: Regularly update your marginal revenue calculations and market analysis.
Mistake #4: Overlooking Capacity Constraints
The error: Assuming you can produce unlimited quantities at the same marginal cost.
The reality: Production capacity limits exist, and marginal cost often increases beyond certain volumes.
How to avoid: Consider operational constraints when applying marginal revenue analysis.
Mistake #5: Neglecting Long-Term Effects
The error: Making decisions purely on short-term marginal revenue.
The reality: Aggressive price cuts for volume can damage brand value and customer expectations.
How to avoid: Balance marginal analysis with strategic brand positioning and long-term value creation.
Marginal Revenue for Investors: What to Look For
Understanding marginal revenue isn’t just for business owners—savvy investors use it to evaluate companies:
1. Pricing Power Analysis
What to examine:
- Can the company maintain prices while growing volume?
- Does marginal revenue stay close to price?
Investment signal:
- Strong pricing power suggests competitive advantages (moats)
- Companies with high marginal revenue relative to price often have better margins
2. Growth Sustainability Assessment
What to examine:
- Is marginal revenue declining as the company scales?
- How quickly does marginal revenue decrease with volume?
Investment signal:
- Stable or slowly declining marginal revenue indicates sustainable growth
- Rapidly falling marginal revenue may signal market saturation
3. Competitive Position Evaluation
What to examine:
- How does the company’s marginal revenue compare to competitors?
- Is the company a price-taker or price-maker?
Investment signal:
- Higher marginal revenue suggests better competitive positioning
- Price-making ability indicates market leadership
4. Profitability Trends
What to examine:
- The relationship between marginal revenue and marginal cost trends
- Whether the gap is widening or narrowing
Investment signal:
- Widening the MR-MC gap indicates improving unit economics
- Narrowing the gap suggests margin pressure
When evaluating stocks, combine marginal revenue analysis with other financial metrics for comprehensive due diligence.
Real-World Case Study: Tech Company Pricing Strategy
Let’s examine how a real company might use marginal revenue analysis:
The Scenario: CloudStorage Plus
CloudStorage Plus offers cloud storage subscriptions with the following data:
Current State:
- 10,000 subscribers at $10/month
- Total monthly revenue: $100,000
- Marginal cost per subscriber: $2/month
Strategic Question:
Should they lower prices to $9/month to attract 13,000 subscribers?
The Analysis
Option A: Current Pricing
- Revenue: 10,000 × $10 = $100,000
- Total Cost: 10,000 × $2 = $20,000
- Profit: $80,000
Option B: Lower Pricing
- Revenue: 13,000 × $9 = $117,000
- Total Cost: 13,000 × $2 = $26,000
- Profit: $91,000
Marginal Revenue Calculation:
- Change in revenue: $117,000 – $100,000 = $17,000
- Change in quantity: 13,000 – 10,000 = 3,000
- Marginal revenue: $17,000 ÷ 3,000 = $5.67 per new subscriber
The Decision
Analysis:
- Marginal revenue ($5.67) > Marginal cost ($2.00)
- Total profit increases by $11,000
- Decision: Lower the price
However, the company should also consider:
- Can they handle 30% more users with the current infrastructure?
- Will existing customers expect continued price decreases?
- What are competitors’ likely responses?
This demonstrates why marginal revenue is a powerful tool but must be used alongside broader strategic thinking.
Advanced Marginal Revenue Concepts
For those ready to dive deeper, here are some advanced applications:
Marginal Revenue Product (MRP)
Definition: The additional revenue generated by employing one more unit of input (like labor).
Formula: MRP = Marginal Revenue × Marginal Product
Application: Helps businesses decide how many employees to hire or whether to invest in additional equipment.
Price Discrimination and Marginal Revenue
Concept: Charging different prices to different customers based on willingness to pay.
Examples:
- Student discounts
- Senior citizen pricing
- Geographic pricing variations
- Time-based pricing (peak vs. off-peak)
Marginal revenue impact: Price discrimination allows companies to capture more consumer surplus and maintain higher marginal revenue across different market segments.
Marginal Revenue in Digital Products
Unique characteristic: Digital products often have near-zero marginal cost.
Implication: Almost any positive marginal revenue justifies selling additional units, leading to:
- Freemium models
- Aggressive volume strategies
- Platform-based business models
This is why many tech companies prioritize user growth over immediate profitability.
Tools and Resources for Marginal Revenue Analysis
Software Solutions
Excel/Google Sheets
- Create custom marginal revenue calculators
- Build scenario analysis models
- Track revenue and cost data
Business Intelligence Platforms
- Tableau, Power BI for visualization
- Automated marginal analysis dashboards
- Real-time decision support
Accounting Software
- QuickBooks, Xero, FreshBooks
- Integrated cost and revenue tracking
- Built-in reporting features
Educational Resources
Recommended Reading:
- Investopedia – Comprehensive marginal revenue guides and examples
- CFA Institute – Professional-level financial analysis frameworks
- SEC.gov – Corporate filings showing real-world revenue analysis
- Morningstar – Company analysis incorporating marginal economics
Online Courses:
- Microeconomics fundamentals
- Managerial accounting
- Financial modeling
📊 Marginal Revenue Calculator
Calculate the additional revenue from selling one more unit
Conclusion: Putting Marginal Revenue to Work
Understanding marginal revenue transforms how you think about business decisions, whether you’re running a company or investing in the stock market. This powerful concept reveals the hidden dynamics of pricing, production, and profitability that aren’t obvious from looking at total revenue alone.
The key insights to remember:
Marginal revenue measures the extra income from selling one more unit—it’s your guide to optimal production levels
The MR = MC rule is your profit-maximization compass—produce where these two meet for maximum profitability
Market structure matters—marginal revenue behaves differently in competitive versus monopolistic markets
Declining marginal revenue is normal—but how fast it declines reveals market saturation and competitive pressure
Marginal revenue isn’t the whole picture—combine it with cost analysis, strategic considerations, and long-term thinking
Your Action Steps
If you’re a business owner:
- Start tracking your actual marginal revenue by product or service line
- Calculate your marginal cost for each product
- Identify where MR = MC to find your optimal production level
- Test different pricing strategies and measure the marginal revenue impact
- Use the calculator above to model different scenarios before making changes
If you’re an investor:
- Look for companies with stable or slowly declining marginal revenue—it signals pricing power
- Analyze how competitors’ marginal revenue compares within industries
- Watch for warning signs like rapidly falling marginal revenue or negative margins
- Consider marginal revenue trends when evaluating dividend-paying stocks and growth companies
- Use marginal analysis to understand company strategy announcements and earnings reports
For everyone:
- Practice calculating marginal revenue with real-world examples
- Apply the concept to everyday decisions (it works for time management too!)
- Develop your economic thinking by analyzing businesses you encounter
- Stay curious about how markets work and how companies make decisions
Marginal revenue isn’t just an abstract economic concept—it’s a practical tool that drives millions of business decisions every day. From the pricing of your morning coffee to the production strategies of Fortune 500 companies, marginal revenue analysis shapes the economic landscape around you.
By mastering this concept, you’ve added a powerful analytical tool to your financial toolkit. Whether you’re making passive income decisions, evaluating business opportunities, or simply understanding why markets behave the way they do, marginal revenue gives you the insight to see beyond surface-level numbers and understand the true economics at play.
Now it’s time to put this knowledge to work. Start small—calculate the marginal revenue for your side hustle, analyze a company you’re interested in, or simply observe how businesses around you apply these principles. The more you practice, the more natural this thinking becomes, and the better your financial decisions will be.
FAQ
A good marginal revenue exceeds marginal cost. As long as MR > MC, producing additional units adds to total profit. In competitive markets, marginal revenue close to or equal to the selling price indicates strong pricing power. For most businesses, marginal revenue that stays positive and doesn’t decline too rapidly signals healthy demand and sustainable growth potential.
The marginal revenue formula is: MR = (Change in Total Revenue) ÷ (Change in Quantity Sold). To calculate it: (1) Find your initial total revenue by multiplying quantity sold by price, (2) Calculate your new total revenue after selling additional units, (3) Subtract initial revenue from new revenue to get the change, (4) Divide that change by the number of additional units sold. The result is your marginal revenue per unit.
Marginal revenue is less than the price in imperfectly competitive markets because businesses must lower prices to sell more units. When you reduce the price to attract additional customers, you don’t just lower the price on the new units—you lower it on all units sold. This revenue loss on existing sales reduces the net revenue gain from new sales, making marginal revenue less than the selling price. Only in perfectly competitive markets, where businesses are price-takers, does marginal revenue equal price.
Yes, marginal revenue can be negative when the price reduction needed to sell more units causes total revenue to actually decrease. This happens when demand is inelastic or when you’ve oversaturated the market. Negative marginal revenue signals that you’re producing too much and should reduce output. It’s a critical warning sign that your pricing strategy needs adjustment.
Marginal revenue is directly related to the price elasticity of demand. When demand is elastic (consumers are price-sensitive), marginal revenue is positive—lowering prices increases total revenue. When demand is inelastic (consumers aren’t price-sensitive), marginal revenue is negative—lowering prices decreases total revenue. At the point where demand has unit elasticity, marginal revenue equals zero. Understanding this relationship helps businesses optimize pricing strategies.
Investors use marginal revenue to assess a company’s pricing power, competitive position, and growth sustainability. By analyzing whether marginal revenue is declining rapidly or staying stable as companies scale, investors can evaluate business model quality. Companies maintaining high marginal revenue relative to price typically have competitive advantages and better profit margins, making them more attractive investments. This analysis complements traditional stock market evaluation methods.
Marginal revenue specifically measures the revenue from one additional unit, while incremental revenue refers to the revenue from any increase in sales volume (which could be multiple units). Marginal revenue is a precise economic concept used in optimization, whereas incremental revenue is a broader business term. However, they’re calculated similarly: change in revenue divided by change in quantity. The key distinction is that marginal revenue focuses on the per-unit impact.
Disclaimer
This article is for educational purposes only and does not constitute financial, investment, or business advice. The information provided is based on general economic principles and should not be relied upon as the sole basis for financial decisions. Marginal revenue analysis is one tool among many for evaluating business and investment opportunities. Individual circumstances vary, and what works for one business or investor may not work for another.
Before making significant business or investment decisions, consult with qualified financial advisors, accountants, or business consultants who understand your specific situation. Past performance and theoretical models do not guarantee future results. All business and investment activities carry risk, including the potential loss of capital.
The examples and case studies presented are simplified for educational purposes and may not reflect the full complexity of real-world scenarios. Market conditions, competitive dynamics, regulatory environments, and consumer behavior can change rapidly and unpredictably.
About the Author
Written by Max Fonji — Your go-to source for clear, data-backed investing education.
With over a decade of experience in financial analysis and investment strategy, Max Fonji has helped thousands of readers understand complex financial concepts through practical, accessible education. Max specializes in breaking down economic principles into actionable insights for everyday investors and business owners.
At TheRichGuyMath.com, we’re committed to providing trustworthy, evidence-based financial education that empowers you to make smarter money decisions. Whether you’re just starting your investment journey or refining your business strategy, our goal is to give you the knowledge and confidence to build lasting wealth.
Related posts:
 What Is SmartPass? Raptor Digital Hall Pass Explained for K-12 Schools
 What Is the 3x Rent Rule & How to Calculate It (With Examples)
 Types of Income: A Complete Guide to Earning and Growing Wealth
 Tax Filing: A Clear, Step-by-Step Guide for Stress-Free Taxes
 Return on Assets (ROA): Definition, Formula & How to Improve It
 How to Save Money Fast: A Smart Savings Plan That Actually Works