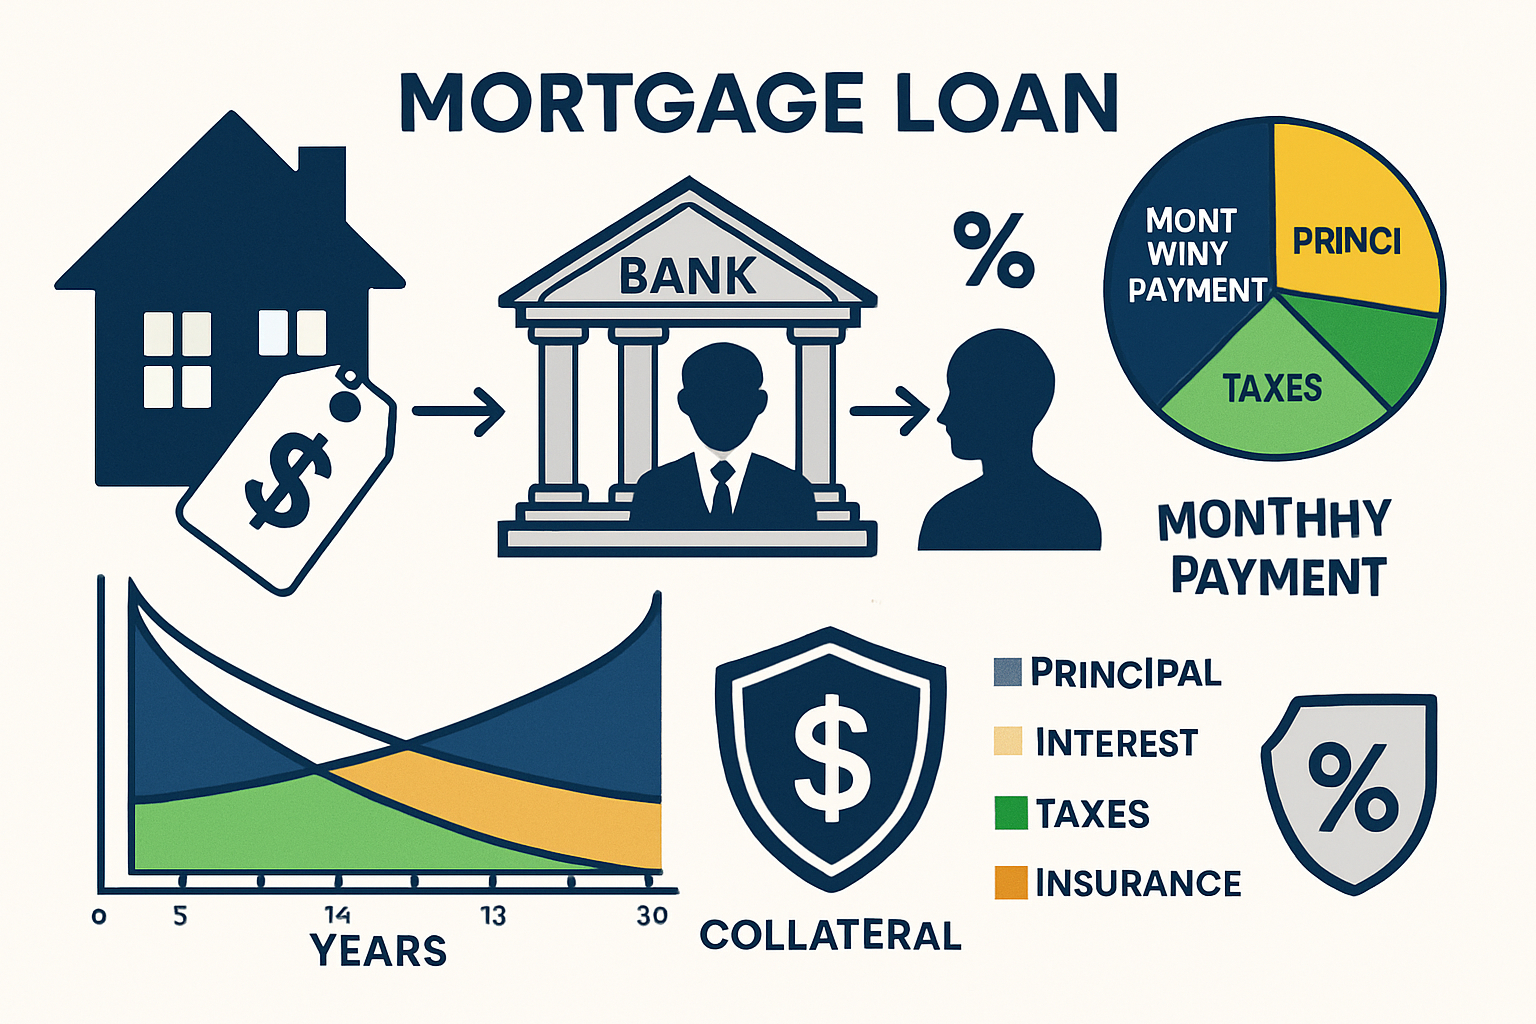
Mortgages are specialized loans designed to help individuals purchase real estate by spreading the cost over many years, with the property itself serving as collateral. Understanding how mortgages work represents one of the most important financial literacy skills because housing typically becomes the largest single expense and potentially the most valuable asset in a person’s lifetime.
The math behind mortgages reveals why seemingly small differences in interest rates, loan terms, and down payments create massive variations in total cost over time. A single percentage point difference on a $300,000 mortgage can mean paying tens of thousands more in interest over 30 years. This guide breaks down the mechanics, costs, and qualification requirements so readers can approach home financing with data-driven confidence rather than confusion.
Most first-time buyers focus exclusively on the home price without understanding the total loan cost, payment structure, or long-term cash flow implications. This creates preventable mistakes that compound over decades. By examining mortgages through clear cause-and-effect relationships, borrowers gain the analytical framework needed to make evidence-based decisions that align with their broader wealth-building strategy.
Key Takeaways
- Mortgages are collateral-based loans where the property secures the debt, resulting in lower interest rates than unsecured borrowing.
- Amortization front-loads interest costs, meaning early payments go primarily toward interest rather than building equity.
- Small rate differences create massive cost variations over 15-30 year terms due to compound interest mathematics.
- Debt-to-income ratios determine affordability, with lenders typically requiring housing costs below 28% and total debt below 43% of gross income.
- Down payment size affects multiple costs, including PMI requirements, interest rates, and monthly payment amounts.
What Is a Mortgage?
A mortgage is a loan specifically used to purchase real estate, where the property being bought serves as collateral for the debt. This means the lender holds a legal claim against the home until the borrower repays the full loan amount plus interest.
The collateral structure fundamentally changes the risk equation for lenders. Because they can foreclose and recover their capital by selling the property if borrowers default, mortgages carry significantly lower interest rates than credit cards, personal loans, or other unsecured debt[2].
Why Collateral Matters to Your Interest Rate
When lenders face lower risk, they charge lower rates. A typical mortgage in 2025 might carry a 6-7% interest rate, while credit card debt exceeds 20% and personal loans range from 10-15%. This spread exists entirely because of the collateral backing.
The property appraisal process ensures the home’s value exceeds the loan amount, creating a buffer that protects the lender’s investment. This loan-to-value (LTV) ratio becomes a critical factor in determining both approval and pricing.
Insight: The collateral mechanism explains why mortgages represent the cheapest form of consumer debt available. Understanding this relationship helps borrowers recognize that home equity functions as both an asset and a risk management tool within the lending system.
Learn more: What is a mortgage?
Foundation concepts: personal finance fundamentals
How Mortgages Work Behind the Scenes
The mortgage ecosystem involves multiple parties beyond just the borrower and lender. Understanding these relationships clarifies why certain processes exist and where costs originate.
The Key Players
Lenders (banks, credit unions, mortgage companies) originate the loan by evaluating creditworthiness and funding the purchase. They assess risk through credit scores, income verification, employment history, and debt-to-income calculations.
Servicers collect monthly payments, manage escrow accounts for taxes and insurance, and handle customer service after origination. The servicer may differ from the original lender because mortgages are frequently sold in secondary markets.
Investors purchase bundled mortgages as securities, providing capital that allows lenders to issue new loans. This secondary market liquidity keeps mortgage rates competitive and capital flowing to borrowers[3].
Principal vs Interest: The Payment Breakdown
Every mortgage payment contains two core components that shift in proportion over time:
Principal = the amount borrowed that reduces the loan balance
Interest = the cost of borrowing, calculated as a percentage of the remaining balance
Early in the loan term, interest dominates because it’s calculated on the full original balance. As principal decreases through payments, interest charges shrink, and more payment dollars apply to principal reduction.
Amortization: The Mathematical Schedule
Amortization refers to the predetermined payment schedule that ensures the loan reaches zero balance by the final payment. Lenders calculate this using the loan amount, interest rate, and term length.
Example: A $300,000 mortgage at 7% for 30 years requires a monthly payment of approximately $1,996. In month one, about $1,750 goes to interest and only $246 to principal. By year 15, the split approaches 50/50. In the final year, nearly the entire payment reduces principal.
This front-loaded interest structure means borrowers build equity slowly in early years, which has important implications for refinancing decisions and total cost calculations.
Takeaway: Understanding the amortization curve explains why paying extra toward principal in early years creates disproportionate long-term savings; each dollar reduces the balance that future interest calculations use as their base.
Deep dive: how mortgages work
Authority source: Consumer Financial Protection Bureau – Mortgages
Mortgage Interest Rates Explained
Interest rates represent the single most impactful variable in total mortgage cost. Small rate differences compound into enormous payment variations over 15-30 year periods.
What Influences Your Rate
Federal Reserve policy sets baseline interest rate levels through monetary policy decisions. When the Fed raises rates to combat inflation, mortgage rates typically increase. When the Fed lowers rates to stimulate economic growth, mortgage rates generally decline[4].
A credit score directly affects the rate lenders offer. Borrowers with scores above 740 receive the best rates, while scores below 620 face significantly higher costs or difficulty qualifying. A 100-point score difference can mean 0.5-1.5% rate variation.
Down payment size influences rates because larger down payments reduce lender risk. Putting down 20% or more typically unlocks better pricing than 5-10% down payments.
Loan type and term create rate differences. Fifteen-year mortgages carry lower rates than 30-year loans because lenders face less long-term risk. Government-backed loans may offer competitive rates despite lower down payments.
Economic conditions, including inflation expectations, bond market yields, and housing market strength, all feed into the rate environment. Mortgage rates loosely track the 10-year Treasury yield with a spread for risk and servicing costs.
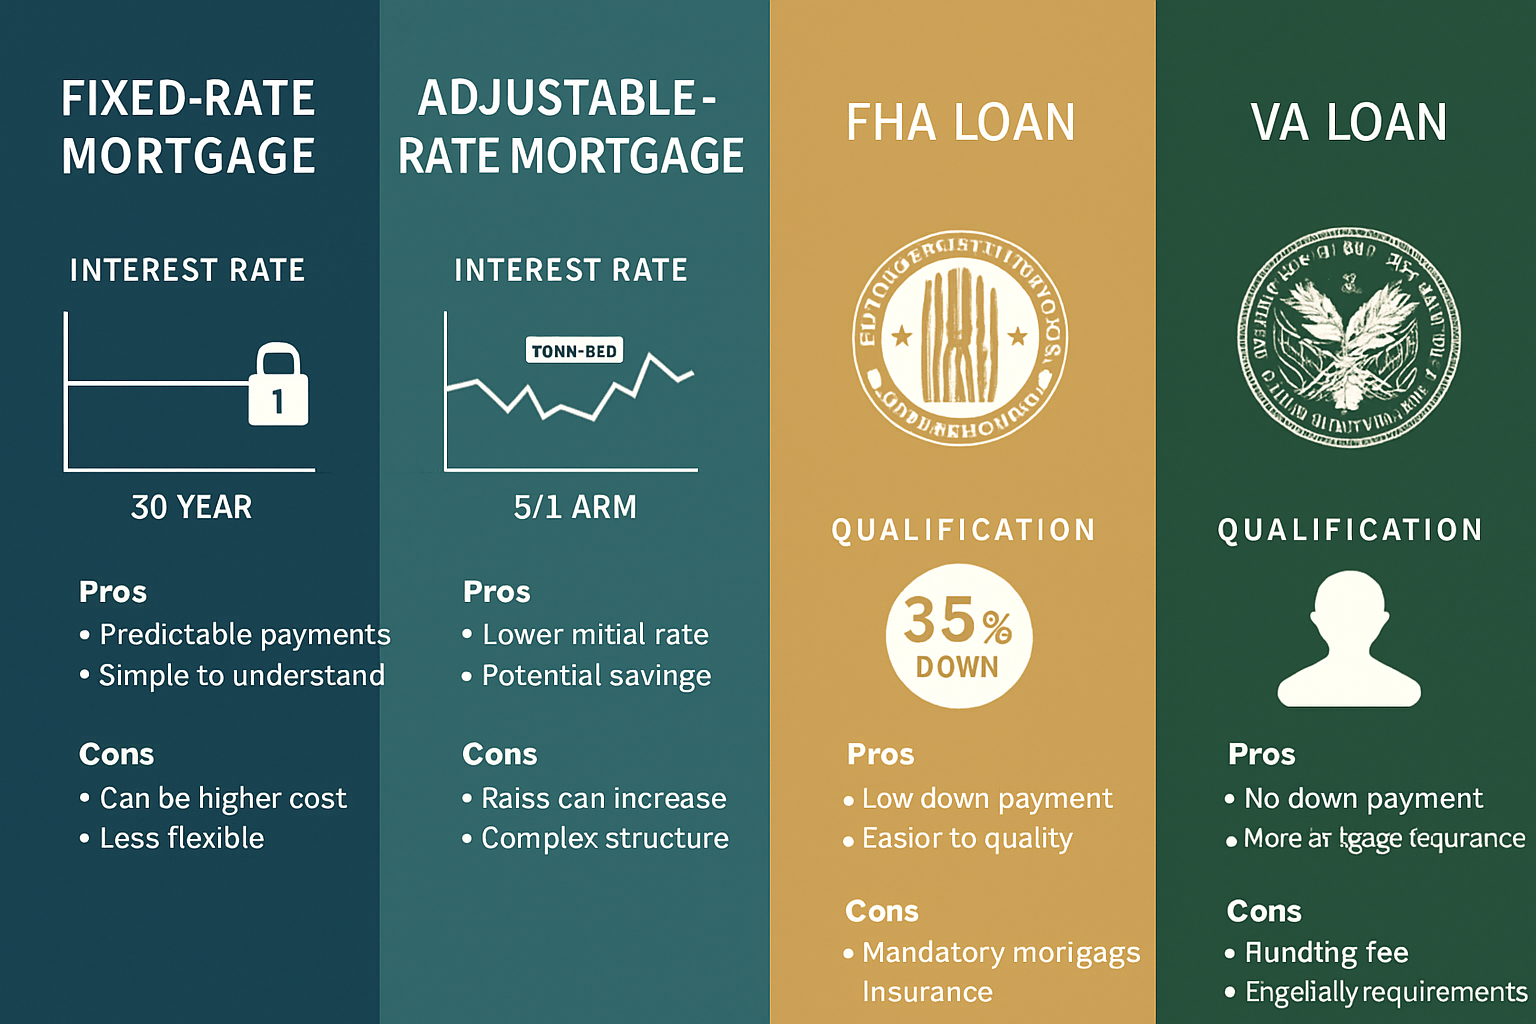
Fixed vs Variable Rate Dynamics
Fixed-rate mortgages lock in one interest rate for the entire loan term. Monthly principal and interest payments remain constant, providing payment predictability and protection against rising rates. Borrowers sacrifice the potential benefit of falling rates unless they refinance.
Adjustable-rate mortgages (ARMs) start with a fixed period (commonly 5, 7, or 10 years), then adjust periodically based on market index rates plus a margin. Initial rates typically run 0.5-1% below comparable fixed rates, creating lower early payments.
The trade-off centers on certainty versus potential savings. ARMs benefit borrowers who plan to sell or refinance before adjustment periods, or who expect rates to decline. Fixed rates protect against payment shock if rates rise significantly.
Why Small Rate Changes Matter
The compound mathematics of long-term loans amplifies rate differences dramatically.
Example calculation:
- $300,000 loan at 6.5% for 30 years = $1,896/month, $382,633 total interest
- $300,000 loan at 7.5% for 30 years = $2,098/month, $455,089 total interest
- Difference: $202/month, $72,456 total cost increase from just 1% rate difference
Over 30 years, that single percentage point costs an additional $72,456—nearly 25% of the original loan amount. This mathematical reality explains why rate shopping and timing decisions carry such weight in mortgage planning.
Insight: Because interest compounds over decades, even quarter-point rate differences justify significant effort in credit score improvement, down payment increases, or market timing considerations. The math behind money reveals that mortgage rates represent one of the highest-leverage variables in personal finance.
Rate analysis: mortgage interest rates explained
Types of Mortgages
Different mortgage products serve different financial situations, risk tolerances, and homeownership timelines. Selecting the appropriate structure requires matching loan characteristics to individual circumstances.
Fixed-Rate Mortgages
Fixed-rate mortgages maintain the same interest rate and monthly payment throughout the entire loan term, typically 15 or 30 years. This structure provides maximum payment predictability and inflation protection.
30-year fixed mortgages offer the lowest monthly payments by spreading repayment over three decades. This maximizes affordability but results in the highest total interest cost and slowest equity building. Best for buyers prioritizing low payments or planning to invest excess cash flow elsewhere.
15-year fixed mortgages carry lower interest rates (typically 0.5-0.75% below 30-year rates) and build equity rapidly through higher monthly payments. Total interest paid drops dramatically, often 60% less than 30-year equivalents. Ideal for buyers with strong cash flow who prioritize wealth building through home equity.
Advantages:
- Payment certainty for budgeting
- Protection against rising interest rates
- Simplified financial planning
- Easier qualification than ARMs in some cases
Disadvantages:
- Higher initial rates than ARM teaser rates
- No benefit if market rates decline without refinancing
- Less flexibility if income fluctuates
Complete analysis: fixed-rate mortgage explained
Adjustable-Rate Mortgages (ARM)
Adjustable-rate mortgages feature an initial fixed period followed by periodic rate adjustments based on market indices. Common structures include 5/1, 7/1, and 10/1 ARMs (fixed for 5, 7, or 10 years, then adjusting annually).
Initial rate advantage: ARMs typically start 0.5-1.5% below comparable fixed rates, creating lower early payments and potentially significant savings during the fixed period.
Adjustment mechanics: After the fixed period, rates adjust based on an index (commonly SOFR or Treasury rates) plus a fixed margin. Rate caps limit how much rates can increase per adjustment and over the loan lifetime—typically 2% per adjustment and 5-6% lifetime caps.
Strategic use cases:
- Buyers planning to sell before the adjustment period
- Professionals expecting income growth to offset potential payment increases
- Markets where rate decreases seem likely
- Borrowers who will refinance within the fixed period
Risk considerations: Payment shock becomes real if rates rise substantially. A $300,000 ARM starting at 6% could adjust to 8-9% if market conditions deteriorate, increasing monthly payments by $400-600.
Takeaway: ARMs function as a calculated risk-reward trade-off. The savings during fixed periods can be substantial, but borrowers must have financial flexibility to handle potential payment increases or a clear exit strategy through sale or refinance.
ARM mechanics: adjustable-rate mortgage explained
Government-Backed Loans
Government programs reduce lender risk through insurance or guarantees, enabling more flexible qualification standards and lower down payments.
FHA Loans (Federal Housing Administration)
- Down payment as low as 3.5%
- Credit scores accepted down to 580 (sometimes lower)
- Higher debt-to-income ratios allowed
- Mortgage insurance is required for the life of the loan on most
- Loan limits vary by county ($498,257 in most areas for 2025)[5]
Best for: First-time buyers with limited savings or credit challenges
VA Loans (Department of Veterans Affairs)
- Zero down payment option
- No mortgage insurance requirement
- Competitive interest rates
- Funding fee (1.25-3.3%) can be rolled into the loan
- Available to eligible veterans, active military, and surviving spouses
Best for: Qualified military borrowers seeking maximum leverage
USDA Loans (U.S. Department of Agriculture)
- Zero down payment in eligible rural/suburban areas
- Income limits apply (typically 115% of the area median)
- Below-market interest rates
- Guarantee fee and annual fee required
Best for: Moderate-income buyers in qualifying locations
Trade-offs: Government-backed loans expand access through lower down payments and flexible credit, but often require mortgage insurance that increases total cost. The math shows these programs make sense when they enable purchases that otherwise wouldn’t happen, but conventional loans with 20% down typically cost less long-term.
Program comparison: government-backed mortgage loans
How Much House Can You Afford?
Affordability calculations require examining the relationship between income, debt obligations, and housing costs through specific ratio frameworks that lenders use.
The 28/36 Rule (Front-End and Back-End Ratios)
Front-end ratio measures housing costs as a percentage of gross monthly income. Lenders typically require this to stay at or below 28%.
Housing costs include:
- Principal and interest payment
- Property taxes
- Homeowners insurance
- HOA fees (if applicable)
- Mortgage insurance (if required)
Example: $6,000 monthly gross income × 28% = $1,680 maximum housing payment
Back-end ratio measures total debt obligations as a percentage of gross income, typically capped at 36-43% depending on loan type and compensating factors.
Total debts include:
- All housing costs above
- Car loans
- Student loans
- Credit card minimum payments
- Personal loans
- Child support/alimony
Example: $6,000 monthly gross income × 43% = $2,580 maximum total debt payments
These ratios exist because statistical analysis shows default rates increase significantly when borrowers exceed these thresholds. Lenders use historical data to set boundaries that balance access with risk management[6].
Income vs Price vs Payment
Many buyers mistakenly focus on home price rather than on monthly payment sustainability. The actual affordability question centers on cash flow, not purchase price.
Calculation framework:
- Determine the maximum monthly payment using a 28% front-end ratio
- Subtract estimated taxes, insurance, HOA, and PMI
- Remaining amount of funds, principal, and interest
- Use the mortgage calculator to determine the loan amount that this payment supports
- Add your own payment to find the maximum purchase price
Example:
- Gross income: $7,000/month
- Maximum housing payment: $1,960 (28%)
- Estimated taxes/insurance/PMI: $460
- Available for P&I: $1,500
- At 7% for 30 years: ~$225,000 loan amount
- With $45,000 down (20%): ~$270,000 purchase price
This reverse-engineering approach reveals true affordability based on sustainable cash flow rather than aspirational price points.
Avoiding Payment Shock
Payment shock occurs when housing costs dramatically exceed previous rent or when buyers stretch to maximum qualification limits without margin for error.
Risk factors:
- Moving from $1,200 rent to $2,400 mortgage payment
- Qualifying at 43% back-end ratio with no buffer
- Failing to account for maintenance, utilities, and unexpected repairs
- Assuming dual income continues without interruption
- Ignoring property tax increases and insurance premium growth
Protection strategies:
- Keep housing payment within 25% of gross income instead of 28%
- Maintain a 3-6 months emergency fund after down payment and closing costs
- Account for 1-2% of the home value annually for maintenance
- Stress-test the budget against job loss or income reduction scenarios
Insight: The math behind sustainable homeownership shows that qualifying for a loan differs from comfortably affording it. Building margin into affordability calculations protects against financial stress and preserves capacity for other wealth-building activities like retirement investing.
🔗 Affordability tools: how much house can I afford
Mortgage Preapproval vs Prequalification
These terms sound similar but represent fundamentally different processes with distinct strategic implications for home buyers.
Prequalification: The Preliminary Estimate
Prequalification involves a basic conversation with a lender where borrowers self-report income, assets, and debts. The lender provides an informal estimate of the potential loan amount without verification or commitment.
Process:
- Borrower provides a verbal or written financial summary
- No documentation required
- No credit check (typically)
- Completed in minutes to hours
- Non-binding estimate
Value: Helps buyers understand the general price range and identify potential issues before serious house hunting.
Limitations: Carries minimal weight with sellers because it lacks verification. Actual approval may differ significantly from prequalification estimates.
Preapproval: The Verified Commitment
Preapproval requires submitting complete financial documentation for lender verification and underwriting review. The lender issues a conditional commitment to lend a specific amount.
Process:
- Submit tax returns, W-2s, pay stubs, bank statements
- Authorization for credit check
- Employment and income verification
- Asset verification
- Debt obligation confirmation
- Underwriter review
- Conditional approval letter issued
Timeline: 1-3 days for initial approval, though full underwriting may continue
Value: Demonstrates serious buyer status to sellers, strengthens offers in competitive markets, and identifies potential issues before finding a home.
Documentation Differences
| Aspect | Prequalification | Preapproval |
|---|---|---|
| Documentation | Self-reported | Verified |
| Credit Check | Usually no | Yes |
| Underwriting | None | Preliminary |
| Commitment | Non-binding estimate | Conditional commitment |
| Timeline | Minutes to hours | 1-3 days |
| Seller Weight | Minimal | Significant |
Seller Perception and Competitive Advantage
In competitive markets, sellers often receive multiple offers. Preapproval letters signal that buyers have:
- Verified financing capacity
- Serious purchase intent
- Lower closing risk
- Professional preparation
Real estate agents frequently advise sellers to prioritize preapproved buyers over prequalified ones because the financing risk drops substantially. In bidding situations, preapproval can differentiate equivalent offers.
Timing Implications
Optimal timing: Obtain preapproval before serious house hunting begins. This prevents emotional attachment to unaffordable properties and enables quick action when the right home appears.
Expiration: Preapprovals typically remain valid for 60-90 days, though lenders may require updated documentation if circumstances change or the timeline extends.
Rate locks: Preapproval doesn’t lock interest rates. Rate locks typically occur when buyers have a signed purchase contract, lasting 30-60 days through closing.
Takeaway: Preapproval represents a strategic investment of time that strengthens negotiating position, accelerates closing timelines, and prevents wasted effort on properties beyond financial reach. The verification process also surfaces potential issues while time exists to address them.
🔗 Process guide: preapproval vs prequalification
Private Mortgage Insurance (PMI) Explained
Private Mortgage Insurance (PMI) protects lenders against loss if borrowers default on loans with less than a 20% down payment. Borrowers pay the premium, but the coverage benefits the lender exclusively.
When PMI Applies
PMI requirements trigger when loan-to-value (LTV) ratios exceed 80%, meaning down payments fall below 20% of the purchase price.
Example:
- $300,000 purchase price
- $30,000 down payment (10%)
- $270,000 loan amount
- LTV = 90% → PMI required
Government-backed loans use different insurance structures (FHA mortgage insurance, VA funding fee) but serve similar purposes.
How Much PMI Costs
PMI typically ranges from 0.5% to 1.5% of the original loan amount annually, paid monthly. The exact rate depends on:
- Credit score (lower scores = higher PMI)
- Down payment size (lower down payment = higher PMI)
- Loan type and term
Cost example:
- $270,000 loan amount
- 0.8% annual PMI rate
- Annual cost: $2,160
- Monthly cost: $180
Over time, this adds significant expense. Five years of $180/month PMI totals $10,800 in payments that build zero equity and provide no direct borrower benefit.
How to Remove PMI
Automatic termination: Lenders must cancel PMI when LTV reaches 78% based on the original amortization schedule, assuming payments remain current[7].
Borrower-requested cancellation: Homeowners can request PMI removal once LTV reaches 80% through:
- Regular payment amortization
- Property value appreciation (requires new appraisal)
- Extra principal payments that accelerate equity building
Requirements for removal:
- Good payment history (no 30-day late payments in the past year)
- No other liens on property
- Appraisal showing sufficient value (if claiming appreciation)
- Written request to servicer
Refinancing option: If property value increases substantially, refinancing into a new loan with LTV below 80% eliminates PMI, though closing costs must justify the savings.
PMI vs Larger Down Payment Trade-Off
The decision between accepting PMI or delaying purchase to save a larger down payment involves multiple variables:
Accepting PMI advantages:
- Enter the market sooner
- Benefit from appreciation during the saving period
- Lock in current interest rates
- Begin building equity immediately
Waiting for 20% down advantages:
- Avoid PMI costs ($150-300/month saved)
- Lower monthly payment
- Better interest rates in some cases
- Reduced total borrowing
Mathematical comparison:
Scenario A: Buy now with 10% down + PMI
Scenario B: Wait 2 years to save 20% down
The optimal choice depends on:
- Property appreciation rates during the waiting period
- Interest rate trajectory
- Rent costs while saving
- Opportunity cost of down payment funds
- Risk tolerance for market timing
Insight: PMI represents a cost that enables market access with limited capital. The trade-off analysis requires comparing PMI expense against the combined costs of delayed entry (continued rent, missed appreciation, potential rate changes). In rapidly appreciating markets, PMI costs often prove worthwhile. In flat or declining markets, waiting may optimize total costs.
PMI analysis: PMI explained
Common Mortgage Mistakes to Avoid
Understanding frequent errors helps borrowers sidestep preventable financial damage that compounds over decades.
Shopping by Home Price Only
The mistake: Focusing exclusively on purchase price rather than total monthly payment and long-term cost.
Why it matters: Two homes at identical prices can have vastly different monthly costs based on property taxes, insurance, HOA fees, and required maintenance. A $350,000 home with $8,000 annual taxes costs $667/month more than one with $2,000 taxes.
Correction: Evaluate total monthly housing costs, including all recurring expenses, then calculate total interest paid over the loan term.
Ignoring Total Loan Cost
The mistake: Comparing mortgages based on the monthly payment alone without examining the total interest paid.
Why it matters: A 30-year mortgage may offer lower monthly payments than a 15-year, but total interest often exceeds double.
Example:
- $250,000 at 6.5% for 30 years = $1,580/month, $318,861 total interest
- $250,000 at 6.0% for 15 years = $2,110/month, $129,823 total interest
- Difference: $530/month but $189,038 in interest savings
Correction: Calculate total cost (principal + interest) across the loan term, not just the monthly payment convenience.
Stretching Debt-to-Income Ratios
The mistake: Qualifying at a maximum 43% back-end ratio without margin for error.
Why it matters: Maximum qualification assumes perfect conditions—no job changes, income reductions, unexpected expenses, or life changes. Operating at the limit eliminates financial flexibility.
Consequences:
- Inability to handle emergencies
- Forced neglect of retirement savings
- High stress from payment pressure
- Vulnerability to minor income disruptions
Correction: Target 28-36% back-end ratio instead of 43%, preserving capacity for savings, investing, and unexpected costs.
Overlooking Closing Costs
The mistake: Budgeting for down payment only, then scrambling to cover $8,000-15,000 in closing costs.
Typical closing costs:
- Origination fees: 0.5-1% of loan amount
- Appraisal: $400-600
- Title insurance: $1,000-4,000
- Attorney fees: $500-2,000
- Credit report: $25-50
- Recording fees: $100-300
- Prepaid taxes and insurance: varies
- Survey: $300-500
Total: Usually 2-5% of the purchase price
Correction: Budget for down payment, PLUS closing costs, PLUS a 3-6 month emergency fund before committing to purchase.
Rate-Lock Misunderstandings
The mistake: Assuming preapproval locks in interest rates, or failing to understand rate lock timing and expiration.
Reality: Rate locks typically occur after a purchase contract is signed and last 30-60 days. If closing delays beyond the lock period, rates may increase or extension fees may apply.
Correction: Understand rate lock timing, duration, and extension costs. Consider longer lock periods (45-60 days) in uncertain markets, accepting slightly higher rates for certainty.
Skipping the Home Inspection
The mistake: Waiving inspection to strengthen offers in competitive markets.
Risk: Purchasing properties with $20,000-50,000+ in hidden structural, mechanical, or systems problems that become the buyer’s responsibility immediately after closing.
Correction: Maintain inspection contingency except in extraordinary circumstances. The $400-600 inspection cost provides asymmetric risk protection.
Forgetting About Maintenance and Repairs
The mistake: Budgeting for mortgage payment only without reserves for ongoing maintenance, repairs, and replacements.
Reality: Homes require 1-2% of value annually for maintenance. A $300,000 home needs $3,000-6,000/year for:
- HVAC servicing and eventual replacement
- Roof repairs and replacement (15-25 year lifespan)
- Appliance replacements
- Plumbing and electrical repairs
- Exterior maintenance
- Landscaping
Correction: Include maintenance reserves in affordability calculations and maintain separate savings for home repairs.
Takeaway: Most mortgage mistakes stem from focusing on immediate affordability rather than long-term sustainability. The math behind successful homeownership requires examining total costs, maintaining financial margins, and planning for both expected and unexpected expenses.
Mortgage Tools and Calculators That Help
Effective financial tools transform abstract concepts into concrete numbers, enabling data-driven decisions rather than emotional guesses.
Essential Mortgage Calculators
The mortgage payment calculator determines monthly principal and interest based on loan amount, rate, and term. This foundational tool shows how changing any variable affects payment size.
Use case: Compare 15-year vs 30-year payments, or evaluate how different interest rates impact affordability.
The affordability calculator works backward from income and debts to determine the maximum sustainable home price using front-end and back-end ratio rules.
Use case: Establish a realistic price range before house hunting begins, preventing emotional attachment to unaffordable properties.
The amortization calculator displays the complete payment schedule, showing principal vs interest breakdown for every payment across the loan term.
Use case: Understand equity-building timeline, evaluate extra payment impact, or analyze refinancing timing.
Comparison and Analysis Tools
The rent vs buy calculator compares the total costs of renting versus purchasing over specific timeframes, accounting for:
- Opportunity cost of down payment
- Tax benefits of the mortgage interest deduction
- Appreciation assumptions
- Transaction costs
- Maintenance expenses
Refinance calculator determines whether refinancing makes financial sense by comparing:
- Current vs new interest rate
- Remaining loan term vs new term
- Closing costs vs monthly savings
- Break-even timeline
The extra payment calculator shows how additional principal payments accelerate payoff and reduce total interest.
Example impact: Adding $200/month to a $250,000, 7%, 30-year mortgage saves $82,000 in interest and shortens the term by 8 years.
Using Tools Effectively
Start broad, then narrow: Begin with affordability calculators to establish realistic ranges, then use payment calculators to compare specific scenarios, and finally, examine amortization schedules for chosen options.
Test multiple scenarios: Run calculations with varying down payments (5%, 10%, 15%, 20%), different terms (15, 20, 30 years), and rate assumptions (best case, expected, worst case).
Account for all costs: Include property taxes, insurance, HOA fees, PMI, and maintenance in total cost calculations, not just principal and interest.
Verify assumptions: Use conservative appreciation rates (2-3% annually), realistic maintenance costs (1-2% of value), and current market interest rates rather than optimistic projections.
Insight: Calculators transform mortgage decisions from vague feelings into quantified trade-offs. The math behind money becomes visible when borrowers can see exactly how each variable affects monthly payments, total costs, and long-term wealth building.
How Mortgages Fit Into Your Bigger Financial Plan
Housing decisions create ripple effects across every aspect of personal finance because they represent the largest single expense and potentially the most valuable asset most people will ever own.
Housing as Both Expense and Asset
The dual nature of homeownership creates unique financial dynamics:
As an expense: Monthly payments, taxes, insurance, maintenance, and repairs consume cash flow that could otherwise fund investments, retirement savings, or discretionary spending.
As an asset: Property ownership builds equity through principal paydown and potential appreciation, creating net worth that can be accessed through sale, refinancing, or home equity borrowing.
This duality means housing decisions require balancing current cash flow constraints against long-term wealth accumulation goals.
Trade-Offs with Investing and Retirement
Every dollar allocated to housing costs reduces capacity for other wealth-building activities.
Opportunity cost example:
- Scenario A: $2,000/month mortgage payment
- Scenario B: $1,500/month mortgage + $500/month invested
Assuming 8% annual investment returns, the $500 monthly difference compounds to $366,000 over 25 years. This represents real wealth sacrificed for additional housing consumption.
Retirement savings impact: Buyers who maximize housing budgets often reduce or eliminate retirement contributions, creating long-term security risks. A 30-year-old who delays retirement savings for 5 years while house-poor loses approximately $500,000 in retirement assets by age 65 (assuming $500/month at 8% returns).
Strategic balance: Optimal housing decisions preserve capacity for:
- 15-20% gross income toward retirement accounts
- Emergency fund maintenance (6 months’ expenses)
- Additional investment contributions
- Education savings for children
- Career development and skill building
Long-Term Cash Flow Impact
Mortgage decisions made at age 30 affect financial flexibility until age 60 with 30-year loans. This timeline encompasses:
- Career changes and income fluctuations
- Family expansion and education costs
- Health issues and insurance needs
- Economic cycles and market volatility
- Retirement planning and execution
Fixed obligations vs flexibility: High mortgage payments create fixed obligations that persist regardless of income changes. Lower payments preserve flexibility to reduce work hours, change careers, or weather income disruptions.
Equity building timeline: Front-loaded interest means meaningful equity accumulation doesn’t occur until years 10-15 of a 30-year mortgage. Buyers who move frequently never reach the high-equity-building phase, potentially losing money to transaction costs and early-payment interest dominance.
Integration with Comprehensive Planning
Debt hierarchy: Mortgages represent “good debt” with low rates and asset backing, but still compete with debt elimination priorities. High-interest debt (credit cards, personal loans) should be eliminated before maximizing housing budgets.
Tax considerations: Mortgage interest deduction benefits diminish after the 2017 tax law changes that increased standard deductions. Many homeowners no longer itemize, reducing the tax advantage of mortgage debt.
Estate planning: Home equity represents a significant portion of many estates. Decisions about payoff timing, reverse mortgages, or downsizing affect inheritance and legacy planning.
Risk management: Homeownership concentrates wealth in a single, illiquid, geographically-specific asset. This concentration creates a risk that diversified investment portfolios avoid. Balancing home equity with liquid investments reduces overall financial risk.
Insight: The math behind sustainable wealth building shows that housing decisions should align with comprehensive financial plans rather than driving them. Optimizing for maximum house often suboptimizes for maximum wealth, retirement security, and financial flexibility.
💰 Mortgage Affordability Calculator
Calculate how much house you can afford based on income, debts, and down payment
Conclusion
Mortgages represent the most significant financial commitment most people make, creating decades-long obligations that affect every aspect of personal finance, from retirement savings to investment capacity to lifestyle flexibility. Understanding the mechanics, costs, and qualification requirements transforms this complex process from overwhelming to manageable.
The math behind mortgages reveals critical insights: small interest rate differences compound into massive cost variations, amortization front-loads interest payments, and debt-to-income ratios determine sustainable affordability rather than aspirational home prices. These mathematical realities should drive decision-making rather than emotional attachments to specific properties.
Actionable Next Steps
1. Calculate true affordability using the 28/36 rule and comprehensive cost accounting that includes taxes, insurance, maintenance, and PMI. Use calculators to determine maximum sustainable home prices based on income and existing debts.
2. Improve qualification position by increasing credit scores above 740, reducing debt-to-income ratios below 36%, and accumulating down payments approaching 20% to eliminate PMI and secure better rates.
3. Compare loan products across fixed-rate, adjustable-rate, and government-backed options to identify structures that match financial situations, risk tolerance, and ownership timelines.
4. Obtain preapproval before serious house hunting to establish credible budgets, strengthen negotiating positions, and identify potential issues while time exists to address them.
5. Integrate housing decisions with comprehensive financial plans that preserve capacity for retirement savings, emergency funds, and investment diversification rather than maximizing housing consumption.
6. Use data-driven tools, including mortgage calculators, amortization schedules, and affordability analyzers, to quantify trade-offs and make evidence-based decisions rather than emotional guesses.
The path to successful homeownership runs through understanding rather than confusion, through mathematical analysis rather than hopeful assumptions, and through comprehensive planning rather than isolated housing decisions. Mortgages become powerful wealth-building tools when borrowers approach them with clarity, discipline, and data-driven confidence.
Related Guides
- Understanding mortgage rates and how they're determined
- Choosing the right home loan for your situation
- Avoiding common homebuyer mistakes that cost thousands
- Planning housing costs within your financial plan
References
[1] Consumer Financial Protection Bureau. (2025). "What is a mortgage?" Retrieved from https://www.consumerfinance.gov/ask-cfpb/what-is-a-mortgage-en-99/
[2] Federal Reserve Bank of St. Louis. (2025). "Mortgage Rates vs Other Consumer Debt." FRED Economic Data. Retrieved from https://fred.stlouisfed.org/
[3] Federal Housing Finance Agency. (2025). "Secondary Mortgage Market Overview." Retrieved from https://www.fhfa.gov/
[4] Board of Governors of the Federal Reserve System. (2025). "Monetary Policy and Mortgage Rates." Retrieved from https://www.federalreserve.gov/
[5] Federal Housing Administration. (2025). "FHA Loan Limits for 2025." U.S. Department of Housing and Urban Development. Retrieved from https://www.hud.gov/
[6] Consumer Financial Protection Bureau. (2025). "Debt-to-Income Ratio and Mortgage Qualification." Retrieved from https://www.consumerfinance.gov/
[7] Homeowners Protection Act of 1998. "PMI Cancellation Requirements." 12 U.S.C. § 4901 et seq.
Author Bio
Max Fonji is the founder of The Rich Guy Math, a financial education platform dedicated to explaining the mathematical principles behind wealth building, investing, and risk management. With a focus on data-driven insights and evidence-based analysis, Max breaks down complex financial concepts into clear, actionable frameworks that empower readers to make informed decisions. His work emphasizes understanding cause-and-effect relationships in personal finance, from mortgage mathematics to investment valuation, always prioritizing clarity and analytical precision over marketing hype.
Educational Disclaimer
This content is provided for educational and informational purposes only and does not constitute financial, mortgage, or lending advice. Mortgage products, interest rates, qualification requirements, and lending standards vary significantly by lender, location, and individual circumstances. Readers should consult with licensed mortgage professionals, financial advisors, and legal counsel before making home financing decisions. The Rich Guy Math does not endorse specific lenders, loan products, or financial strategies. All calculations and examples are illustrative and may not reflect actual costs or terms available to individual borrowers. Past performance and historical data do not guarantee future results.
Frequently Asked Questions
Is a 15-year or 30-year mortgage better?
The optimal mortgage term depends on your cash flow capacity and wealth-building priorities. Fifteen-year mortgages typically offer interest rates that are 0.5%–0.75% lower than 30-year loans, build equity much faster, and save approximately 60%–70% in total interest costs over the life of the loan. The trade-off is significantly higher monthly payments—often 50%–75% more than a comparable 30-year mortgage.
Thirty-year mortgages prioritize affordability and flexibility. Lower required payments preserve cash flow for emergency savings, investing, or other financial goals, but result in substantially higher total interest paid over time.
Decision framework: Choose a 15-year mortgage when your income comfortably supports higher payments and rapid equity building aligns with your goals. Choose a 30-year mortgage when flexibility matters more or when investing excess cash flow can generate returns higher than the mortgage interest rate.
How much should I put down on a home?
The ideal down payment balances affordability, risk management, and opportunity cost.
Advantages of putting 20% down:
- Eliminates private mortgage insurance (PMI), often saving $150–$300 per month
- Qualifies for better interest rates
- Lowers monthly payments
- Strengthens negotiating power with sellers
Advantages of a lower down payment:
- Allows faster entry into the housing market
- Preserves liquidity for emergencies
- Enables diversification into other investments
- Captures appreciation while saving the remaining down payment
Optimal strategy: Put down 20% if you can do so without draining emergency funds or retirement savings. Accept PMI with a 5%–10% down payment when appreciation, rent savings, or market timing outweigh the insurance cost.
Can I get a mortgage with student loans?
Yes. Student loans do not prevent mortgage approval, but they affect affordability through debt-to-income (DTI) calculations.
Lenders include required student loan payments in your back-end DTI ratio, which reduces the maximum housing payment you can qualify for.
Example:
- $6,000 gross monthly income
- $400 student loan payment
- 43% maximum DTI = $2,580 total allowable debt
- $2,180 remaining for housing costs
Ways to improve qualification:
- Increase income through raises or side work
- Pay down other consumer debts
- Use income-driven repayment plans when appropriate
- Explore loan forgiveness options
- Improve credit score for better rate access
Does paying mortgage points make sense?
Mortgage points allow borrowers to pay upfront fees—typically 1% of the loan amount per point—to lower the interest rate by about 0.25% per point.
Break-even example:
- $300,000 loan
- 1 point cost: $3,000
- Rate reduction: 7.00% to 6.75%
- Monthly savings: approximately $48
- Break-even period: about 63 months (5.25 years)
Points make sense when:
- You plan to keep the loan beyond the break-even point
- Upfront cash does not reduce emergency reserves
- Tax deductions apply
- The rate reduction meaningfully improves cash flow
Skip points when:
- You expect to sell or refinance within 5–7 years
- Cash is better used for a larger down payment
- Future rate declines are likely
Should I refinance or keep my current mortgage?
Refinancing makes sense when long-term savings exceed total refinancing costs within a reasonable time frame.
Evaluation framework:
- Compare your current interest rate to available refinance rates
- Calculate monthly payment savings
- Estimate total closing costs (typically 2%–5% of loan balance)
- Determine break-even months (costs ÷ monthly savings)
- Compare break-even timeline to expected ownership duration
Refinance when:
- Rate reduction is at least 0.75%–1.0%
- Break-even occurs within 2–3 years
- You’re switching from an adjustable-rate to fixed-rate loan
- You can eliminate PMI through higher equity
Keep your current loan when:
- Rate improvement is under 0.5%
- You plan to move before reaching break-even
- You are deep into the loan term (year 20+ of a 30-year loan)
- Closing costs outweigh near-term savings
Important note: Refinancing resets amortization, meaning early payments again go mostly toward interest rather than principal. This is especially relevant later in the loan term.