Picture this: Two coffee shops sit side by side on the same street. Both bring in $500,000 in revenue each year. Yet one owner drives a luxury car while the other struggles to pay rent. What’s the difference? It’s not about how much money comes in; it’s about how much stays in your pocket after all the bills are paid. That’s exactly what net profit margin reveals, and understanding this single number can transform how you evaluate businesses, whether you’re investing in the stock market or running your own company.
Net profit margin is the ultimate reality check for any business. While revenue might look impressive on paper, this metric cuts through the noise to show you the actual profitability story. In 2025, as investors become increasingly savvy about looking beyond surface-level numbers, understanding net profit margin has become essential for making smart financial decisions.
Key Takeaways
- Net profit margin measures how much profit a company keeps from every dollar of revenue after all expenses, taxes, and costs are paid; it’s the ultimate profitability metric
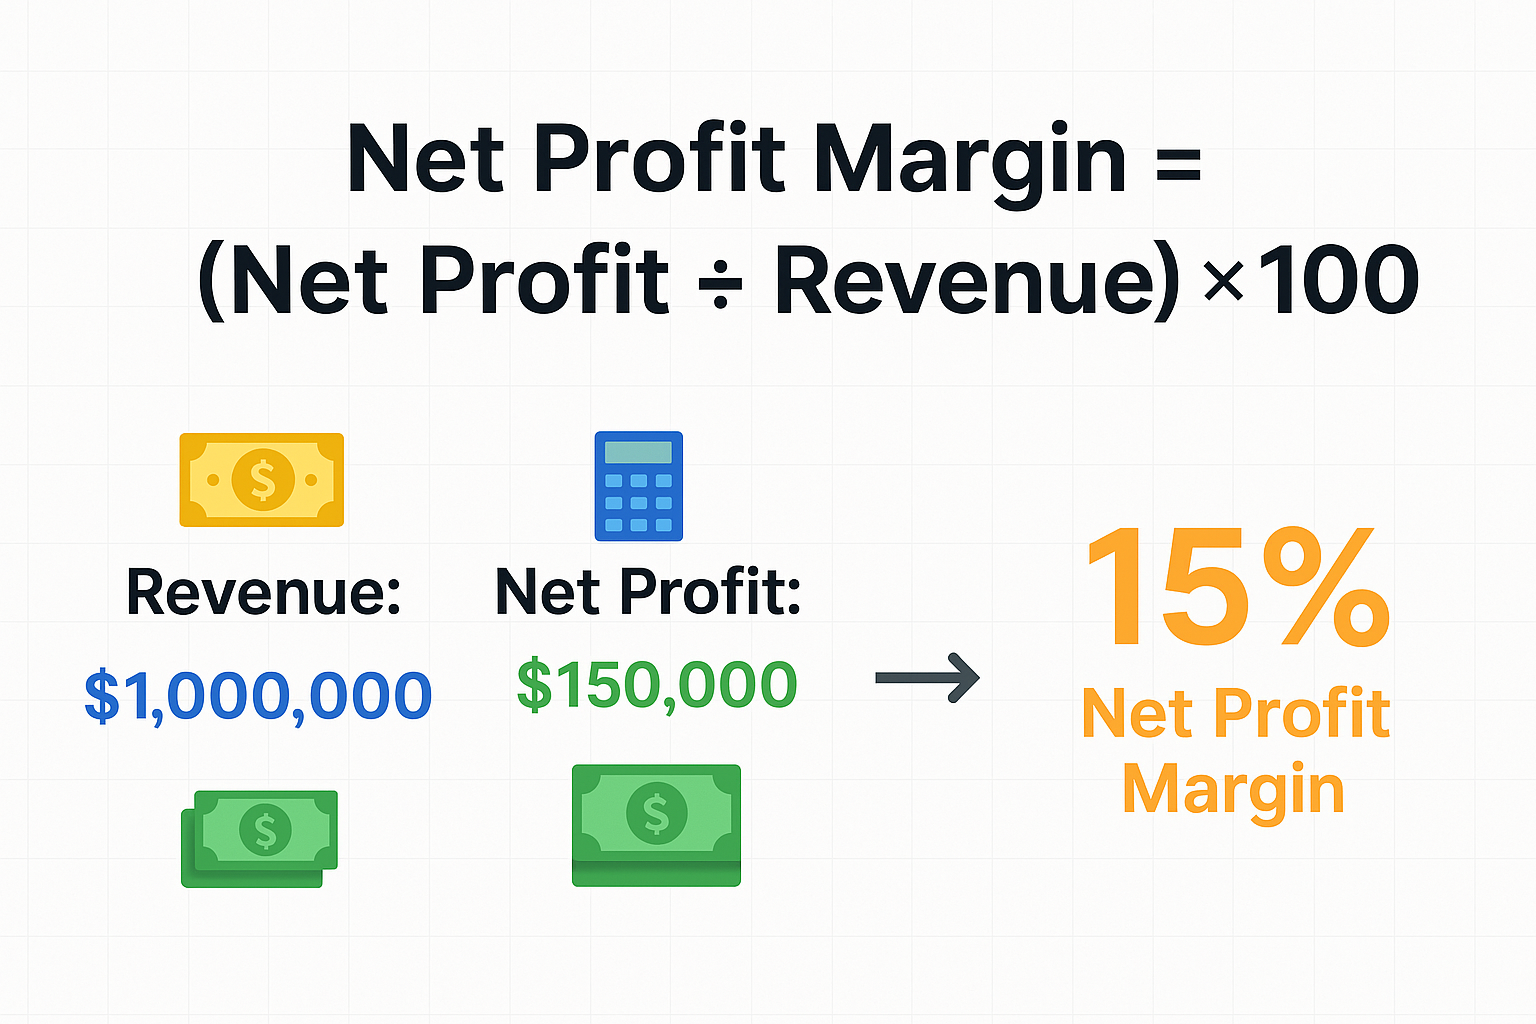
- The formula is simple: (Net Profit ÷ Revenue) × 100 = Net Profit Margin %
- Industry benchmarks vary dramatically: Software companies often see 15-25% margins while grocery stores typically run at 1-3%
- Higher margins indicate better efficiency and stronger competitive positioning, making them attractive for dividend investing
- Comparing margins across time and competitors reveals more insights than looking at a single number in isolation
What Is Net Profit Margin?
Net profit margin is a profitability ratio that tells you what percentage of revenue becomes actual profit after accounting for every single expense a business faces. Think of it as the “bottom line” metric, literally, because it comes from the bottom line of the income statement. According to Investopedia – Net Profit Margin Definition, it measures how much of each dollar in revenue translates into profit after all expenses.
When a company generates revenue, that money doesn’t all become profit. First, it pays for the cost of goods sold (materials, manufacturing). Then come operating expenses (salaries, rent, marketing). After that, interest on debt is paid. Finally, Uncle Sam takes his cut through taxes. Whatever remains is net profit, and when you express that as a percentage of total revenue, you’ve got your net profit margin. See the full guide on Profit Margin
Why it matters: A company with $1 million in revenue and a 20% net profit margin ($200,000 profit) is fundamentally stronger than one with $2 million in revenue but only a 5% margin ($100,000 profit). The first company is more efficient, likely more competitive, and better positioned to weather economic storms.
The Real-World Impact
Let’s look at a simple example. Imagine you’re comparing two retail stores:
Store A:
- Revenue: $1,000,000
- Net Profit: $150,000
- Net Profit Margin: 15%
Store B:
- Revenue: $1,200,000
- Net Profit: $60,000
- Net Profit Margin: 5%
Store B has higher sales, but Store A is clearly the better business. It keeps more of every dollar it earns, suggesting better cost control, pricing power, or operational efficiency. This is exactly why savvy investors look at margins when deciding they should invest in particular companies.
The Net Profit Margin Formula Explained
The net profit margin formula is beautifully simple:
Net Profit Margin = (Net Profit ÷ Total Revenue) × 100
Let’s break down each component:
Net Profit (Net Income)
This is your “bottom line”, what remains after subtracting ALL expenses from revenue:
- Cost of Goods Sold (COGS)
- Operating expenses (salaries, rent, utilities, marketing)
- Interest payments on debt
- Taxes
- Depreciation and amortization
- Any other expenses
You’ll find net profit at the very bottom of a company’s income statement. It’s sometimes called “net income” or “net earnings.”
Total Revenue (Sales)
This is the total amount of money the company brought in from its business operations before any expenses are deducted. You’ll find this at the top of the income statement, which is why it’s often called the “top line.”
The Multiplication by 100
This simply converts your decimal result into a percentage, making it easier to understand and compare.
Step-by-Step Calculation Example
Let’s calculate the net profit margin for a fictional company called “TechGadget Inc.”
TechGadget Inc. Annual Financials:
- Total Revenue: $5,000,000
- Cost of Goods Sold: $2,000,000
- Operating Expenses: $1,500,000
- Interest Expense: $200,000
- Taxes: $390,000
- Net Profit: $910,000
Calculation:
Net Profit Margin = ($910,000 ÷ $5,000,000) × 100 = 18.2%
This means TechGadget Inc. keeps $0.182 (or about 18 cents) of every dollar in revenue as profit. For a tech company, this would be considered a healthy margin in 2025.
💰 Net Profit Margin Calculator
Calculate your business profitability instantly
Industry Benchmarks: What's a "Good" Net Profit Margin?
Here's the truth: There's no universal "good" net profit margin. A 5% margin might be excellent for a grocery store but terrible for a software company. Industry context is everything.
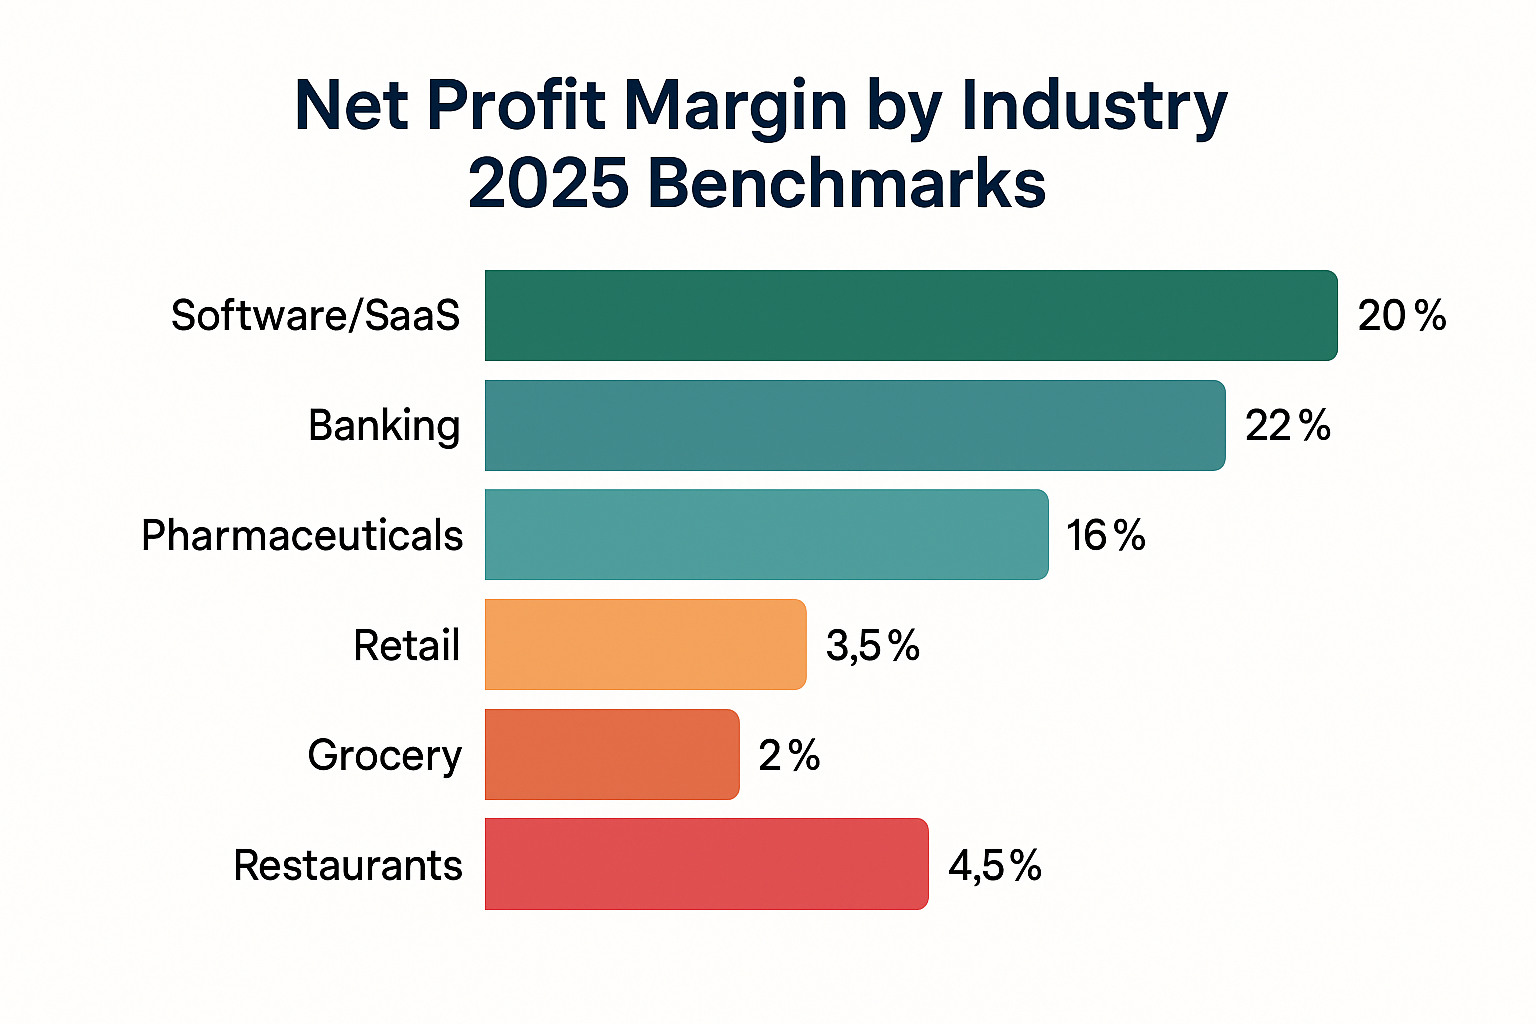
Net Profit Margin by Industry (2025 Benchmarks)
| Industry | Typical Net Profit Margin | Why It's Different |
|---|---|---|
| Software/SaaS | 15-25% | Low cost of goods, scalable products, high R&D costs |
| Banking | 15-30% | Interest income model, regulatory costs |
| Pharmaceuticals | 12-20% | High R&D costs, patent protection allows premium pricing |
| Oil & Gas | 5-15% | Commodity pricing, capital-intensive operations |
| Retail (General) | 2-5% | Low cost of goods, scalable products, and high R&D costs |
| Grocery Stores | 1-3% | Extremely competitive, perishable inventory, volume-based |
| Restaurants | 3-6% | Material costs, labor, and project-based revenue |
| Construction | 3-7% | Thin margins, high competition, and inventory costs |
| Automotive | 2-6% | Manufacturing costs, competitive pricing |
| Airlines | 1-5% | Labor-intensive, food costs, and high overhead |
Morningstar’s company financial pages provide updated net profit margin data and peer comparisons for investors.”
What Makes Margins Different?
High-margin industries typically share these characteristics:
- Low variable costs: Software companies can serve one customer or one million with minimal cost difference
- Pricing power: Pharmaceutical patents or strong brands command premium prices
- Scalability: Digital products and services scale without proportional cost increases
- Intellectual property: Patents, trademarks, and proprietary technology create competitive moats
Low-margin industries face different realities:
- Commodity products: When products are interchangeable, price competition drives margins down
- High operating costs: Labor-intensive businesses or those with expensive inventory struggle with margins
- Competitive pressure: Industries with low barriers to entry face constant margin compression
- Regulatory burden: Heavy regulation adds costs without adding revenue
How to Use Net Profit Margin in Investment Decisions
Understanding net profit margin transforms how you evaluate investment opportunities. Here's how savvy investors use this metric when researching stocks:
1. Compare Within Industries, Not Across Them
Never compare a tech company's margin to a grocery chain's margin and conclude the grocer is "bad." Instead, compare Walmart to Target, or Microsoft to Adobe. Industry peers face similar cost structures and competitive dynamics.
Example: If you're evaluating two software companies for your portfolio, and Company A has a 22% net profit margin while Company B has 12%, that 10-percentage-point difference is significant. It suggests Company A has better cost control, pricing power, or both.
2. Track Margin Trends Over Time
A single quarter's margin tells you less than the trend over several years. Is the margin improving, declining, or stable?
- Improving margins suggests the company is becoming more efficient, gaining pricing power, or benefiting from scale
- Declining margins might indicate increasing competition, rising costs, or operational challenges
- Stable margins in a growing company can be perfectly healthy, showing consistent execution
3. Margin Expansion as a Growth Signal
When a company grows revenue and expands its net profit margin simultaneously, that's a powerful combination. It means profits are growing faster than sales, exactly what you want to see when building passive income through dividend stocks.
Real-world story: In the early 2010s, Apple's margin expansion became a key part of its investment thesis. As iPhone sales grew, Apple's net profit margin expanded from around 14% to over 21% by 2012. This wasn't just about selling more phones; it was about better supplier negotiations, operational efficiency, and premium pricing power. Investors who recognized this margin expansion story earned substantial returns.
4. Red Flags to Watch For
Certain margin patterns should make you cautious:
- Negative margins that persist: Some companies lose money while growing (common in startups), but if a mature company consistently shows negative margins, that's concerning
- Margins well below industry peers: If everyone else in the industry maintains 8-10% margins but your target company sits at 3%, ask why
- Volatile, unpredictable margins: Wild swings quarter-to-quarter suggest operational instability or poor management
5. Combine with Other Metrics
Net profit margin works best alongside other financial metrics:
- Gross profit margin: Shows profitability before operating expenses
- Operating margin: Reveals profitability from core operations
- Return on Equity (ROE): Shows how efficiently the company uses shareholder money
- Free cash flow: Confirms that accounting profits translate to actual cash
When you're evaluating high dividend stocks, companies with consistently high net profit margins are often better positioned to maintain and grow their dividend payments over time.
Common Mistakes When Analyzing Net Profit Margin
Even experienced investors sometimes misinterpret this metric. Here are the pitfalls to avoid:
1: Ignoring Industry Context
The error: Seeing a 4% margin and assuming it's "low" without checking industry norms.
The reality: A 4% margin would be outstanding for a grocery chain but dismal for a software company. Always benchmark against industry peers, not arbitrary standards.
2: Focusing Only on Current Margin
The error: Looking at a single quarter or year in isolation.
The reality: Margins fluctuate due to seasonal patterns, one-time expenses, or temporary market conditions. A three-to-five-year trend reveals far more than any single data point.
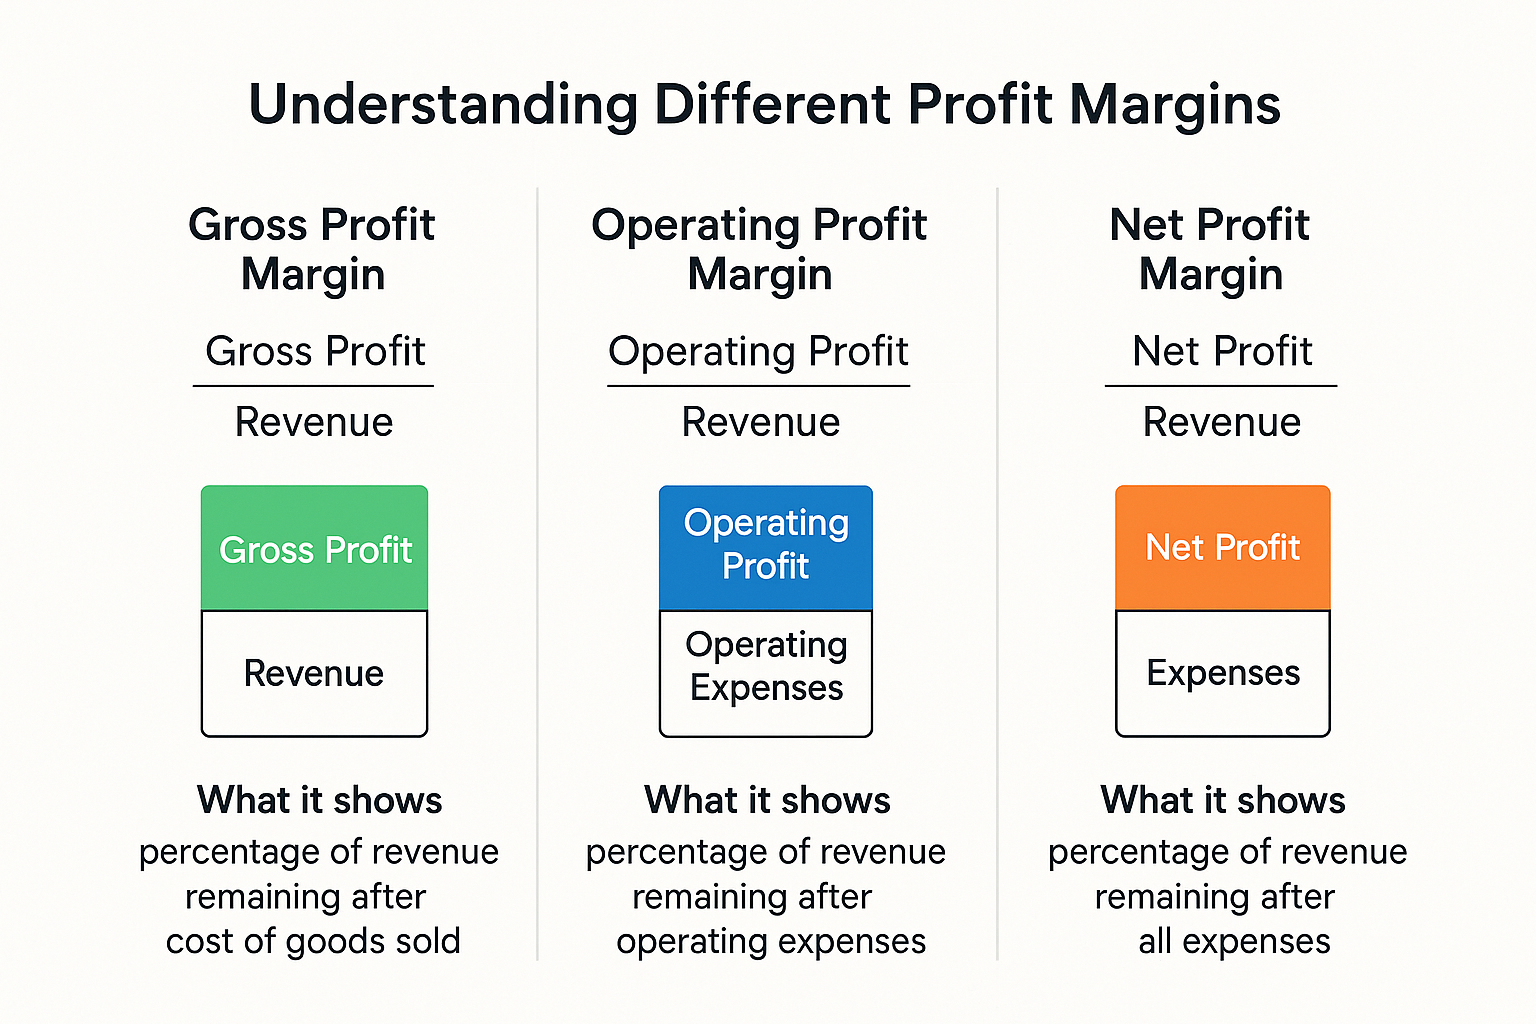
3: Confusing Different Margin Types
There are three main profitability margins, and they tell different stories:
- Gross Profit Margin = (Revenue - Cost of Goods Sold) ÷ Revenue
- Operating Profit Margin = Operating Income ÷ Revenue
- Net Profit Margin = Net Income ÷ Revenue
Each has its place. Gross margin shows product profitability, operating margin reveals operational efficiency, and net margin shows the complete picture, including taxes and interest.
4: Not Accounting for One-Time Events
A company might report an unusually low margin one quarter due to:
- Restructuring charges
- Legal settlements
- Asset write-downs
- Acquisition costs
Similarly, selling a division or building might create an artificially high margin for one period. Smart investors adjust for these non-recurring items to understand the "normalized" margin.
5: Assuming Higher Is Always Better
While higher margins are generally preferable, extremely high margins can attract competition. A company earning 40% net margins in an industry where 15% is typical might soon face new competitors eager to capture some of that profit. This is part of why the stock market goes up over time: competition and innovation constantly reshape profitability.
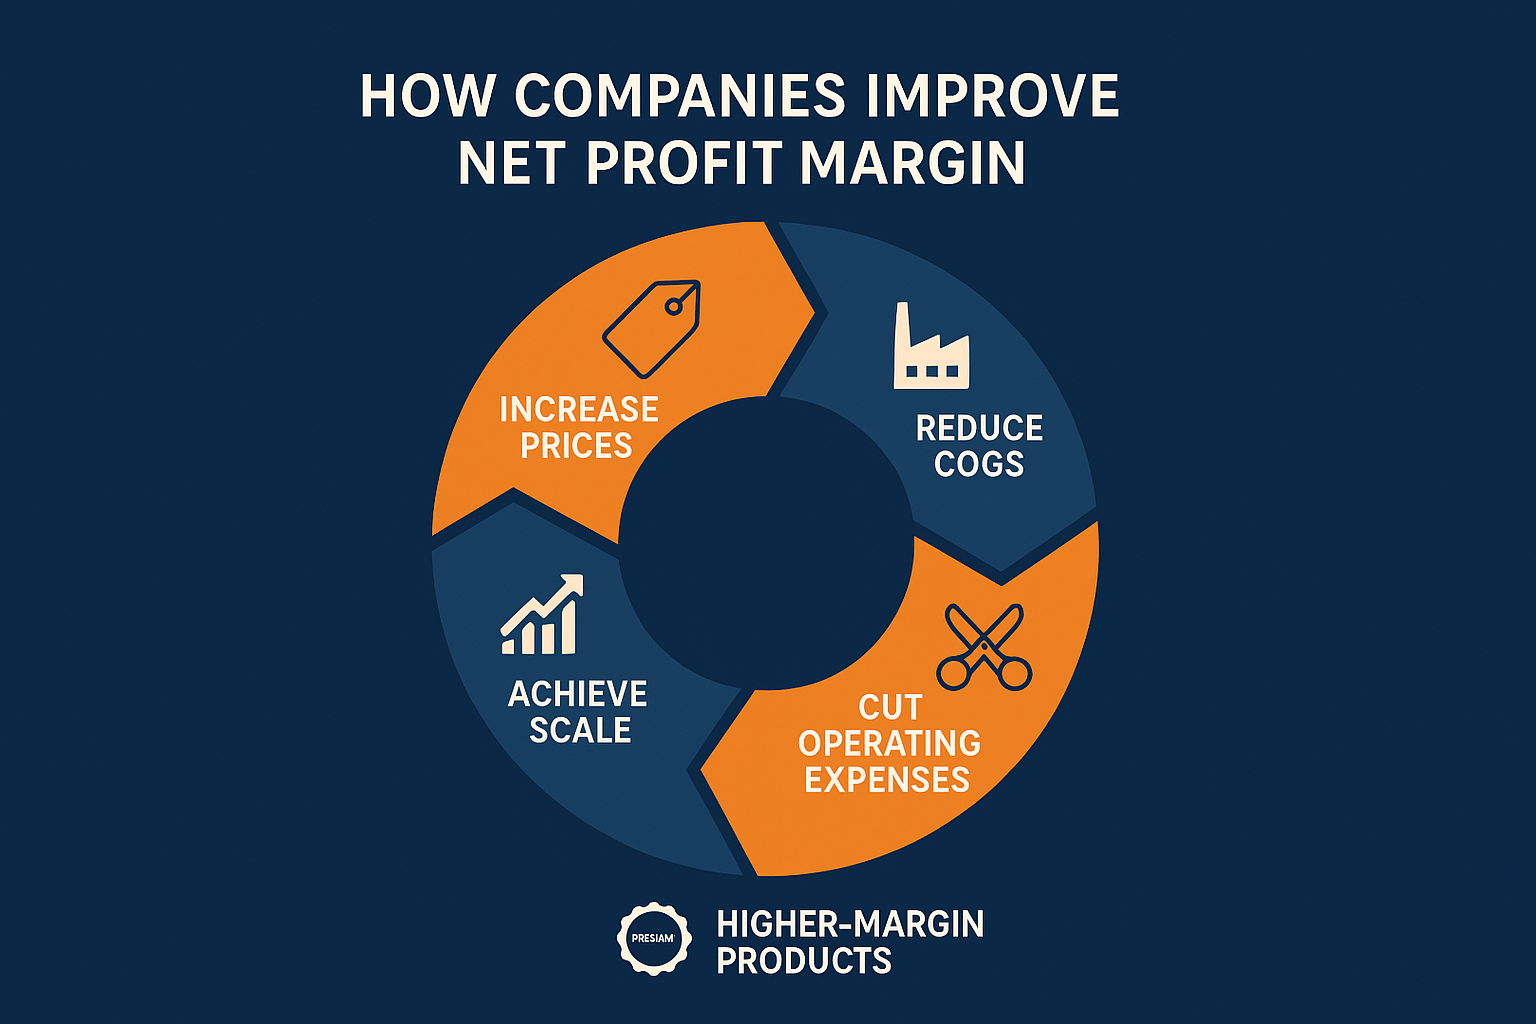
How Companies Improve Their Net Profit Margin
Understanding how businesses boost their margins helps you identify well-managed companies worth investing in:
1: Increase Prices
The most direct path to margin expansion is charging more for the same product or service. This requires pricing power, the ability to raise prices without losing customers.
Companies build pricing power through:
- Strong brand recognition (Apple, Nike, Starbucks)
- Unique products with few substitutes
- High switching costs that lock in customers
- Superior quality or service
2: Reduce Cost of Goods Sold (COGS)
Manufacturers and retailers constantly work to lower what they pay for raw materials and inventory:
- Negotiating better supplier contracts
- Achieving economies of scale (bulk discounts)
- Improving production efficiency
- Reducing waste and defects
- Vertical integration (making components in-house)
Example: Walmart's legendary supply chain efficiency allows it to maintain profitability despite razor-thin margins. By optimizing every step from manufacturer to shelf, they squeeze out costs competitors can't match.
3: Cut Operating Expenses
Smart companies trim fat without cutting muscle:
- Automating repetitive tasks
- Optimizing marketing spend for better ROI
- Renegotiating rent and service contracts
- Streamlining management layers
- Adopting cloud services to reduce IT costs
4: Shift to Higher-Margin Products
Many companies intentionally move upmarket or emphasize their most profitable offerings:
- Apple shifted from computers to iPhones and services (higher margins)
- Microsoft pivoted from software licenses to cloud subscriptions (recurring revenue, better margins)
- Restaurants promote high-margin items (beverages, appetizers)
5: Achieve Scale
As companies grow, fixed costs get spread across more revenue, naturally improving margins. A software company's development costs don't double when customer count doubles, so margins expand with scale.
This is why smart investors often favor companies with scalable business models; the margin improvement potential is built into the growth story.
Net Profit Margin vs Other Profitability Metrics
Net profit margin doesn't exist in isolation. Understanding how it relates to other metrics gives you a complete profitability picture:
Gross Profit Margin
Formula: (Revenue - COGS) ÷ Revenue × 100
What it shows: How profitable your core product is before considering operating expenses.
When to use it: Comparing product profitability, evaluating manufacturing efficiency, or analyzing retail markup strategies.
Example: A clothing retailer might have a 60% gross margin (they sell a $100 jacket that costs them $40), but only a 5% net margin after rent, salaries, marketing, and other expenses.
Operating Profit Margin
Formula: Operating Income ÷ Revenue × 100
What it shows: Profitability from core business operations, excluding interest and taxes.
When to use it: Evaluating operational efficiency without the noise of financing decisions or tax situations.
Why it matters: Two companies might have different net margins purely due to debt levels (interest expense) or tax jurisdictions, but operating margin shows which one runs its core business better.
Return on Equity (ROE)
Formula: Net Income ÷ Shareholder Equity × 100
What it shows: How efficiently the company uses shareholder money to generate profits.
The connection: A company can have a modest net profit margin but excellent ROE if it's capital-efficient. Conversely, high margins with poor ROE suggest the company requires too much capital to generate those profits.
Return on Assets (ROA)
Formula: Net Income ÷ Total Assets × 100
What it shows: How efficiently the company uses all its assets to generate profit.
When it matters: Asset-heavy industries (manufacturing, utilities) where comparing asset efficiency is crucial.
Real-World Examples: Net Profit Margin in Action
Let's look at how net profit margin plays out in actual companies:
Case Study 1: Amazon's Margin Evolution
For years, Amazon operated at razor-thin margins—often below 2%. Critics questioned whether it was even a viable business. But founder Jeff Bezos was playing a different game: prioritizing growth and market share over short-term profits.
Then came Amazon Web Services (AWS). This cloud computing division operates at margins of 25-30%, dramatically higher than retail. As AWS grew from a small experiment to a major profit center, Amazon's overall net profit margin expanded from under 1% to consistently above 5% by 2025.
The lesson: Margin trends can tell a transformation story. Investors who understood AWS's margin profile early recognized Amazon's profit potential before it became obvious.
Case Study 2: The Restaurant Reality
Most restaurants operate on 3-6% net margins. A single bad quarter, an unexpected rent increase, or a food cost spike can wipe out profitability entirely. This explains why restaurant stocks can be volatile and why many fail within their first few years.
Successful restaurant chains like Chipotle or McDonald's maintain margins through:
- Standardized operations that control costs
- Menu engineering that emphasizes high-margin items
- Real estate strategies that secure favorable lease terms
- Brand strength that supports premium pricing
The lesson: In low-margin industries, even small improvements in efficiency or pricing create outsized profit impacts. A restaurant that improves from 4% to 5% margins has increased profits by 25%. You can check real-world company filings via the SEC’s EDGAR database to compare net profit margins across industries.
Case Study 3: Software's Margin Advantage
Microsoft's net profit margin hovers around 30-35%, ten times higher than many retailers. Why? Once software is developed, serving additional customers costs almost nothing. The first copy of Windows costs billions in development; the millionth copy costs pennies to distribute.
This scalability explains why tech companies dominate lists of most valuable companies and why they're often featured in strategies for making passive income.
The lesson: Business model matters enormously. Scalable, low-variable-cost businesses naturally achieve higher margins than businesses that must incur costs with each additional sale.
The Emotional Side: Why Margins Matter to Your Psychology 🧠
Here's something most financial guides won't tell you: Understanding net profit margin can actually improve your investing psychology and help you avoid the cycle of market emotions that destroys returns.
When markets get volatile, investors who don't understand the fundamentals panic. They see a stock price drop 20% and assume the business is failing. But if you've done your homework on net profit margins, you can ask better questions:
- Has the company's margin actually deteriorated, or is this just market sentiment?
- If margins are stable or improving, is this volatility creating a buying opportunity?
- Do I understand this business well enough to hold through uncertainty?
Personal story: During the 2020 pandemic crash, many quality companies saw their stock prices plummet. But investors who understood that companies like Microsoft, Apple, and Google had fortress-like margins (20-30%+) could recognize that short-term disruption didn't threaten long-term profitability. Those who held or bought during the panic were rewarded handsomely.
This is also why many people lose money in the stock market; they react to price movements without understanding the underlying business fundamentals that margins reveal.
Limitations of Net Profit Margin
No metric is perfect. Here's what net profit margin doesn't tell you:
It Doesn't Show Cash Flow
A company can be "profitable" on paper while running out of cash. This happens when:
- Revenue is recorded before cash is collected (accounts receivable)
- Heavy capital expenditures are required
- Inventory must be purchased before sales occur
Always check cash flow statements alongside profit margins.
It Can Be Manipulated
Accounting choices affect reported profits:
- Depreciation methods
- Revenue recognition timing
- Expense capitalization vs. immediate expensing
- One-time charges or gains
Savvy companies can make margins look better or worse depending on their goals.
It Doesn't Account for Growth
A 5% margin on $100 million in revenue ($5 million profit) might be more attractive than a 15% margin on $10 million in revenue ($1.5 million profit) if the first company is growing 50% annually.
It Ignores Capital Requirements
Some high-margin businesses require constant reinvestment. A software company with 25% margins that must spend 20% of revenue on R&D to stay competitive is different from one that can maintain leadership with 5% R&D spending.
Industry Disruption Isn't Visible
Today's healthy margins can evaporate quickly when disruptive competitors or technologies emerge. Blockbuster had decent margins right up until Netflix made its business model obsolete.
Practical Tips for Using Net Profit Margin in 2025
Here's how to put this knowledge into action:
For Investors:
- Create a watchlist of companies in industries you understand, then track their margins quarterly
- Set margin thresholds based on industry norms: alert yourself when companies fall below peer averages
- Look for margin expansion stories: companies improving margins while growing revenue often outperform
- Use margin stability as a quality filter: consistent margins suggest competitive advantages
- Combine with dividend analysis: high margins make dividend sustainability more likely
For Business Owners:
- Calculate your margin monthly, not just annually: catch problems early
- Break down margins by product line: some offerings might be subsidizing money-losers
- Benchmark against competitors: if your margin is 3% and your peers average 7%, investigate why
- Set margin improvement goals: even a 1% improvement can dramatically increase profits
- Track leading indicators: monitor COGS and operating expenses before they hit the bottom line
For Career Professionals:
- Research employer margins; companies with healthy margins can afford better compensation and weather downturns
- Understand your impact; if you can help improve efficiency or pricing, you directly boost margins
- Industry selection matters; high-margin industries often offer better career economics long-term
"Profit margin" is a general term that could refer to gross, operating, or net margin. "Net profit margin" specifically means the percentage of revenue that becomes net income after ALL expenses, including taxes and interest.
Yes. A negative margin means the company lost money; expenses exceeded revenue. This is common for startups and growth companies prioritizing market share, but concerning for mature businesses.
For investment decisions, quarterly earnings reports provide updates. But focus more on annual trends and multi-year patterns rather than short-term fluctuations.
It depends entirely on the industry. For software, 10% would be low. For retail, it would be excellent. Always compare to industry benchmarks.
Non-profits don't aim for "profit," but they do track a similar metric called operating margin, the difference between revenue and expenses. Healthy non-profits maintain small positive margins to build reserves.
Inflation can squeeze margins if costs rise faster than a company can raise prices. Companies with strong pricing power can pass inflation to customers and maintain margins; those in competitive industries often see margin compression during inflationary periods.
Conclusion: Your Next Steps
Net profit margin is one of the most powerful yet accessible tools in your financial toolkit. Whether you're evaluating stocks for your investment portfolio, running a business, or simply trying to understand how companies really make money, this metric cuts through the noise to reveal fundamental profitability.
Remember the key insights:
Net profit margin shows what percentage of revenue becomes actual profit after every expense is paid
The formula is simple: (Net Profit ÷ Revenue) × 100
Industry context is everything; never compare margins across different industries
Trends matter more than single data points. Watch how margins evolve over time
Higher margins suggest competitive advantages, efficiency, and pricing power
Combine margin analysis with other metrics for a complete business understanding
Take Action Today:
- Pick three companies you own or are considering investing in, and calculate their net profit margins using recent financial statements
- Compare those margins to industry averages and direct competitors
- Look at the five-year trend. Are margins improving, declining, or stable?
- Read the management discussion in earnings reports to understand what's driving margin changes
- Use the calculator above to experiment with different scenarios and build intuition
Understanding net profit margin transforms you from someone who invests based on tips and hunches to someone who makes informed decisions based on business fundamentals. That shift in perspective is exactly what separates successful long-term investors from those who struggle.
The businesses with sustainable competitive advantages, strong management, and healthy margins are the ones that tend to reward patient investors over decades. Now you have the tools to identify them.
Disclaimer
This article is for informational and educational purposes only and should not be construed as financial advice. The information provided does not constitute a recommendation to buy or sell any security. Net profit margins vary by company and industry, and past performance does not guarantee future results. Always conduct your own research and consider consulting with a qualified financial advisor before making investment decisions. The author and publisher are not responsible for any financial losses or gains resulting from the use of this information.
About the Author
Max Fonji is a financial educator and investment analyst with over a decade of experience helping everyday investors understand complex financial concepts. Through TheRichGuyMath.com, Max breaks down investing, personal finance, and wealth-building strategies into practical, actionable guidance. When not analyzing financial statements or writing about markets, Max enjoys hiking, reading historical biographies, and experimenting with new coffee brewing methods. Connect with Max's latest insights at TheRichGuyMath.com
Related posts:
 What Is SmartPass? Raptor Digital Hall Pass Explained for K-12 Schools
 What Is the 3x Rent Rule & How to Calculate It (With Examples)
 Portfolio Income: Definition, Examples, Tax Rules, and Strategies
 Bookkeeping vs Accounting: What’s the Difference & Which Do You Need?
 Return on Assets (ROA): Definition, Formula & How to Improve It
 How to Save Money Fast: A Smart Savings Plan That Actually Works