Picture this: You check your investment account and see a 7% gain over the past year. You’re thrilled! But then inflation hits 3%, and suddenly that exciting return doesn’t feel quite as impressive. Welcome to the crucial difference between nominal return and what your money actually earns in purchasing power.
Understanding nominal return is like reading the sticker price on a car versus knowing what you’ll actually pay after fees, taxes, and other costs. It’s the headline number that grabs your attention, but it’s only part of the story. For anyone serious about building wealth, whether you’re just starting or managing a growing portfolio, knowing how to interpret nominal returns can mean the difference between celebrating false victories and making truly informed investment decisions.
In this comprehensive guide, we’ll break down everything you need to know about nominal return, why it matters, and how to use this knowledge to become a smarter investor in 2025 and beyond.
Key Takeaways
Quick Summary:
- Nominal return is the raw percentage gain or loss on an investment before adjusting for inflation, taxes, or fees
- It differs from real return, which accounts for inflation’s impact on purchasing power
- Understanding both nominal and real returns helps you make better investment decisions
- A 6% nominal return with 3% inflation equals roughly 3% real return
- Always consider inflation, taxes, and fees when evaluating investment performance
What Is Nominal Return? The Simple Definition
Nominal return represents the total percentage change in an investment’s value over a specific period, expressed in current dollars without any adjustments for inflation, taxes, or fees. It’s the straightforward, face-value return you see when you look at your investment statements. Investopedia
Think of nominal return as the “gross” number; it tells you how much your investment grew in dollar terms, but it doesn’t tell you how much your purchasing power actually increased.
Breaking Down the Math
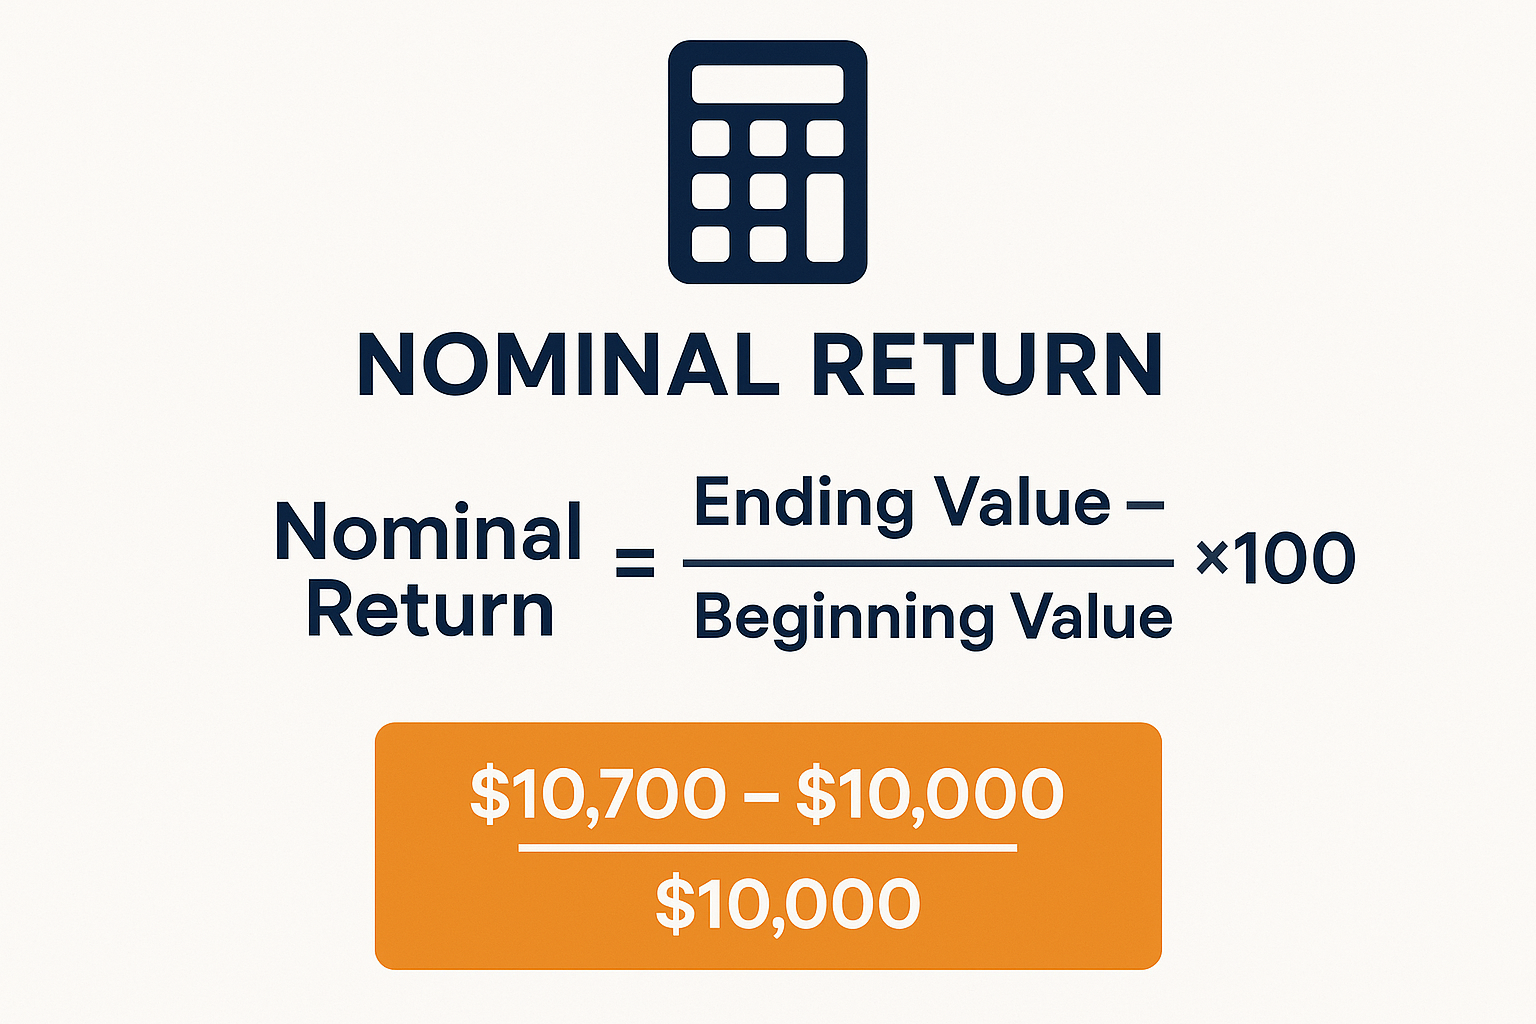
The formula for calculating nominal return is refreshingly simple:
Nominal Return = [(Ending Value – Beginning Value) / Beginning Value] × 100
Let’s look at a real example:
- You invest $10,000 in a stock
- One year later, it’s worth $10,700
- Your nominal return = [($10,700 – $10,000) / $10,000] × 100 = 7%
That 7% is your nominal return. Clean, simple, and what most people think of when they hear “investment return.”
Why Nominal Return Matters (And Why It’s Not Enough)
Nominal return serves as an important starting point for evaluating investment performance. Here’s why it matters:
The Good: What Nominal Return Tells You
✅ Easy Comparison: Nominal returns let you quickly compare different investments side-by-side
✅ Performance Tracking: They help you monitor whether your investments are moving up or down
✅ Historical Data: Most financial reports and databases use nominal returns for consistency
✅ Simple Communication: It’s the universal language investors use to discuss returns
When you’re reading about stock market performance or evaluating high dividend stocks, you’ll almost always encounter nominal returns first.
The Limitation: What’s Missing
However, nominal return has a critical blind spot: it ignores inflation.
Imagine earning a 5% nominal return in a year when inflation runs at 6%. Congratulations, you actually lost purchasing power! Your account balance went up, but each dollar now buys less than it did before.
This is where many beginner investors get tripped up. They see positive returns and assume they’re winning, without realizing inflation might be eating away at their gains.
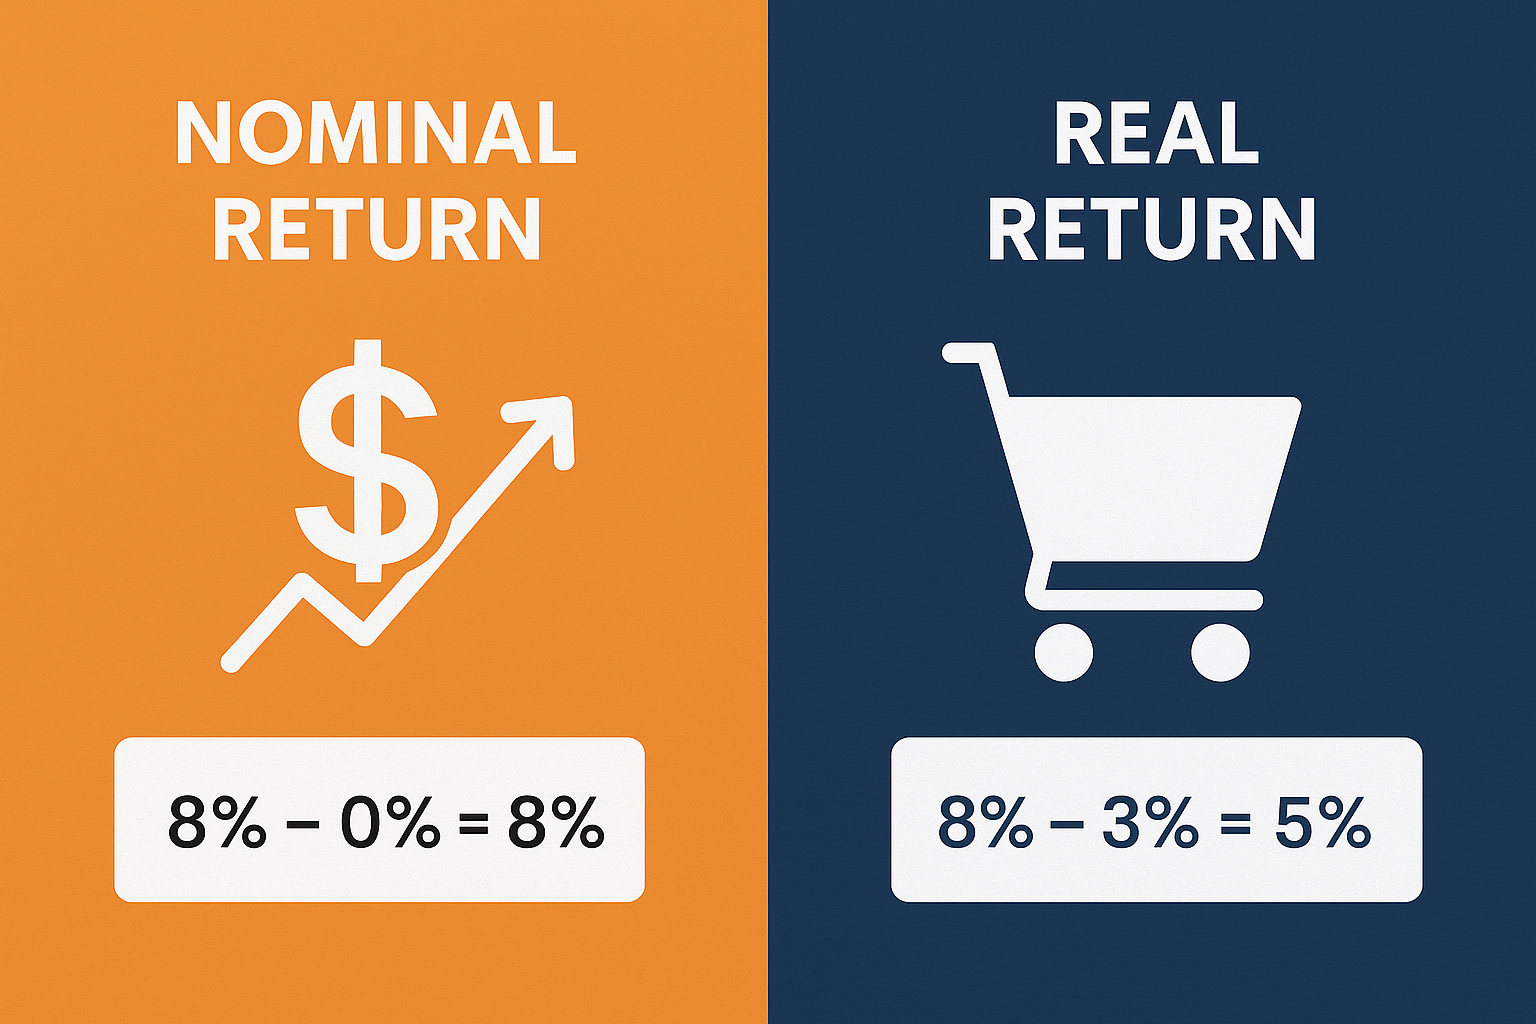
Nominal Return vs Real Return: The Critical Difference
Understanding the distinction between nominal and real return is fundamental to investment success. Let’s break it down with a clear comparison:
| Aspect | Nominal Return | Real Return |
|---|---|---|
| Definition | Raw return without adjustments | Return adjusted for inflation |
| Formula | (End Value – Start Value) / Start Value | Nominal Return – Inflation Rate |
| Reflects | Dollar growth | Purchasing power growth |
| Best For | Quick comparisons | True wealth assessment |
| Example | 8% gain on investment | 8% – 3% inflation = 5% real gain |
The Real Return Formula
To calculate real return, you can use this simplified formula:
Real Return ≈ Nominal Return – Inflation Rate
For more precision, use the Fisher equation:
Real Return = [(1 + Nominal Return) / (1 + Inflation Rate)] – 1
Let’s see this in action with a story:
Sarah’s Investment Journey: In 2024, Sarah invested $50,000 in a diversified portfolio. By the end of 2025, her account showed $54,000, a nominal return of 8%. She was excited! But when she factored in the 3.5% inflation rate that year, her real return was approximately 4.3%. Still good, but not quite as impressive as the headline number suggested.
This distinction becomes even more important when you’re planning for long-term goals like retirement. A passive income strategy needs to account for real returns to ensure your money maintains its purchasing power over decades. Corporate Finance Institute
💰 Nominal vs Real Return Calculator
How Inflation Impacts Your Nominal Returns
Inflation is the silent wealth destroyer that every investor needs to understand. It’s the gradual increase in the prices of goods and services over time, which means each dollar buys less as years go by.
Historical Perspective: Inflation Through the Decades
Here’s how inflation has varied over recent decades:
- 1980s: Average inflation around 5.5% annually
- 1990s: Moderated to about 3% annually
- 2000s: Relatively stable at 2.5% annually
- 2010s: Low inflation averaging 1.8% annually
- 2020-2025: Volatile, ranging from 1.2% to 8% depending on the year
According to the U.S. Bureau of Labor Statistics, the Consumer Price Index (CPI), the most common measure of inflation, has averaged about 3.1% annually over the past 30 years. This means an investment needs to earn at least that much just to maintain purchasing power.
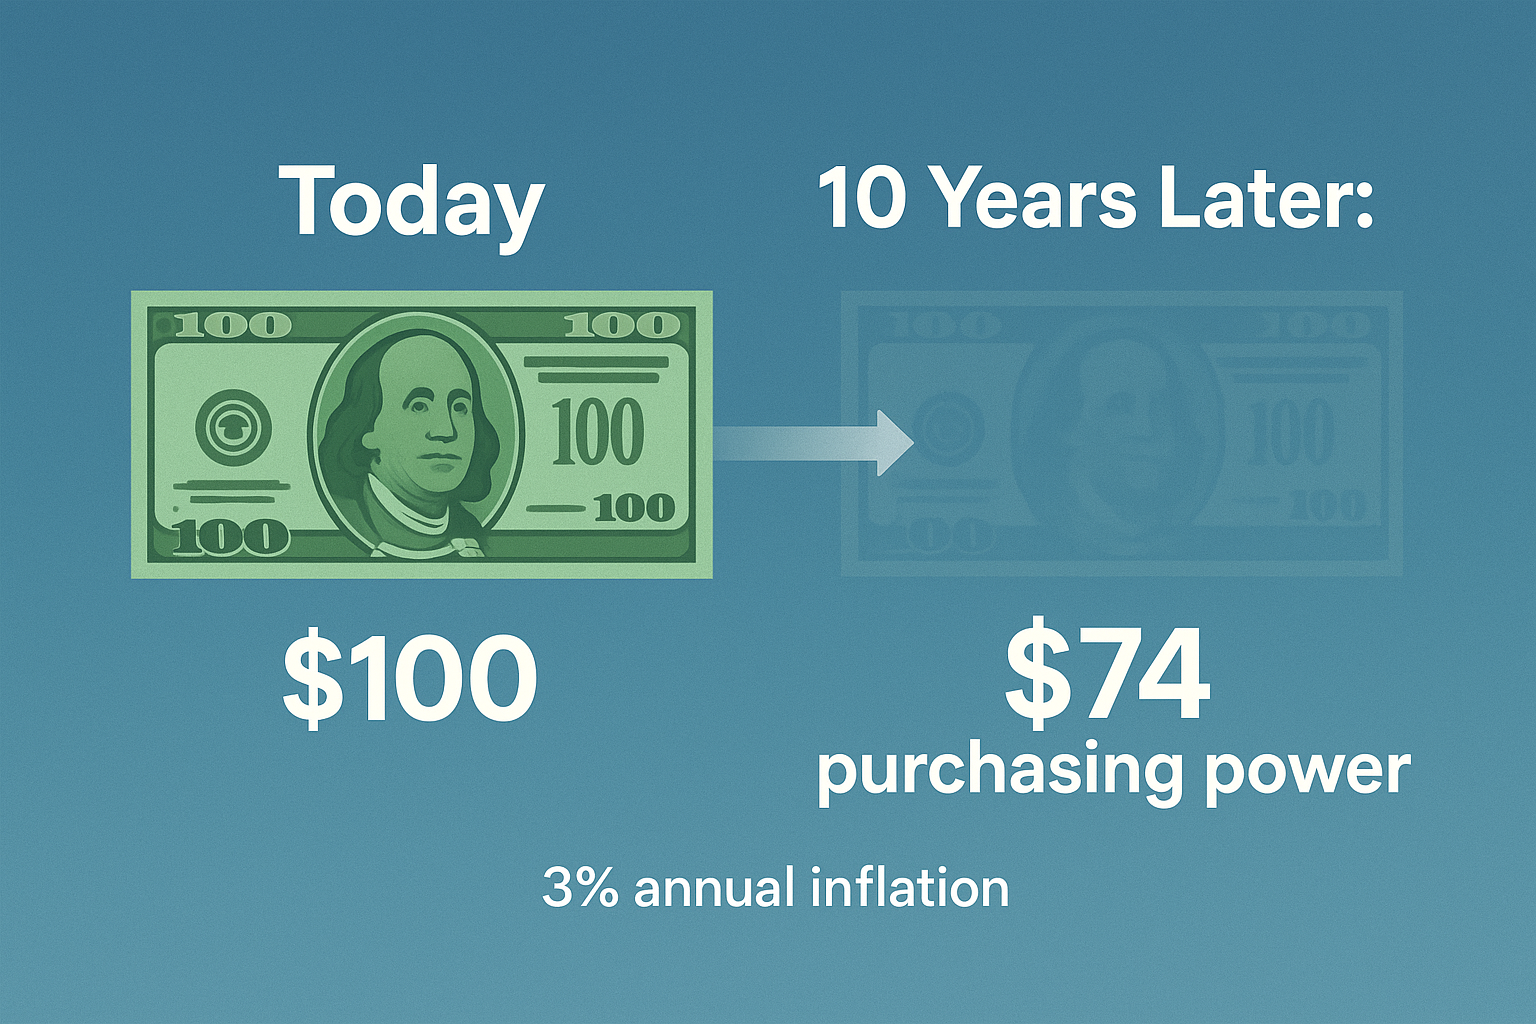
The Compound Effect Over Time
The impact of inflation compounds just like investment returns. Let’s look at what $10,000 in purchasing power becomes over different time periods with 3% annual inflation:
| Years | Equivalent Purchasing Power |
|---|---|
| 5 years | $8,626 |
| 10 years | $7,441 |
| 20 years | $5,537 |
| 30 years | $4,120 |
This table shows why focusing solely on nominal returns can be dangerous for long-term investors. Understanding why the stock market goes up over time helps explain why equities have historically outpaced inflation better than other asset classes.
Real-World Examples: Nominal Return in Action
Let’s explore some practical scenarios to see how nominal returns play out in different investment situations.
Example 1: The Savings Account Trap
Mike’s Story: Mike keeps $25,000 in a high-yield savings account earning 2.5% annually. He’s thrilled to earn $625 in interest (nominal return of 2.5%). However, with inflation running at 3.5%, his real return is actually -1%. His account balance grew, but his purchasing power decreased.
The Lesson: While savings accounts are important for emergency funds, they rarely beat inflation over the long term. This is why many people lose money in traditional savings despite “earning” interest.
Example 2: Stock Market Investment
Jessica’s Portfolio: Jessica invested $50,000 in a diversified stock portfolio. After one year:
- Portfolio value: $56,500
- Nominal return: 13%
- Inflation rate: 3%
- Real return: approximately 9.7%
Jessica’s investment not only grew in dollar terms but also significantly increased her purchasing power. This demonstrates why stocks have historically been effective for long-term wealth building.
Example 3: Bond Investment During High Inflation
Carlos’s Bonds: Carlos bought $100,000 in corporate bonds yielding 5% annually. In a year with 6% inflation:
- Interest earned: $5,000 (5% nominal return)
- Real return: -0.94%
- Purchasing power loss: approximately $940
Despite receiving interest payments, Carlos actually lost purchasing power because inflation outpaced his nominal return.
These examples illustrate why smart investors always consider both nominal and real returns when making decisions.
Components That Affect Your Actual Returns
When evaluating investment performance, nominal return is just the starting point. Several other factors determine what you actually keep:
1. Inflation
As we’ve discussed extensively, inflation erodes purchasing power. The Federal Reserve targets 2% annual inflation, but actual rates fluctuate based on economic conditions.
2. Taxes
Different investments face different tax treatments:
- Capital gains: Long-term (held >1 year) taxed at 0%, 15%, or 20% depending on income
- Short-term gains: Taxed as ordinary income (up to 37%)
- Dividends: Qualified dividends taxed at capital gains rates; non-qualified at ordinary rates
- Interest income: Generally taxed as ordinary income
A 10% nominal return can shrink to 7% or less after taxes, depending on your tax bracket and the type of investment.
3. Fees and Expenses
Investment fees compound negatively over time:
- Mutual fund expense ratios: 0.1% to 2%+ annually
- Advisory fees: Typically 0.5% to 1.5% annually
- Trading commissions: Variable, but add up with frequent trading
- Account maintenance fees: $50-$200 annually for some accounts
According to Morningstar research, a 1% annual fee can reduce your portfolio value by 25% or more over 30 years due to compounding.
4. Opportunity Cost
Money invested in one asset can’t be invested elsewhere. If you earn 5% in bonds while stocks return 10%, your opportunity cost is the 5% difference.
Nominal Return Across Different Asset Classes
Different investments offer varying nominal returns with different risk profiles. Here’s a breakdown based on historical data:
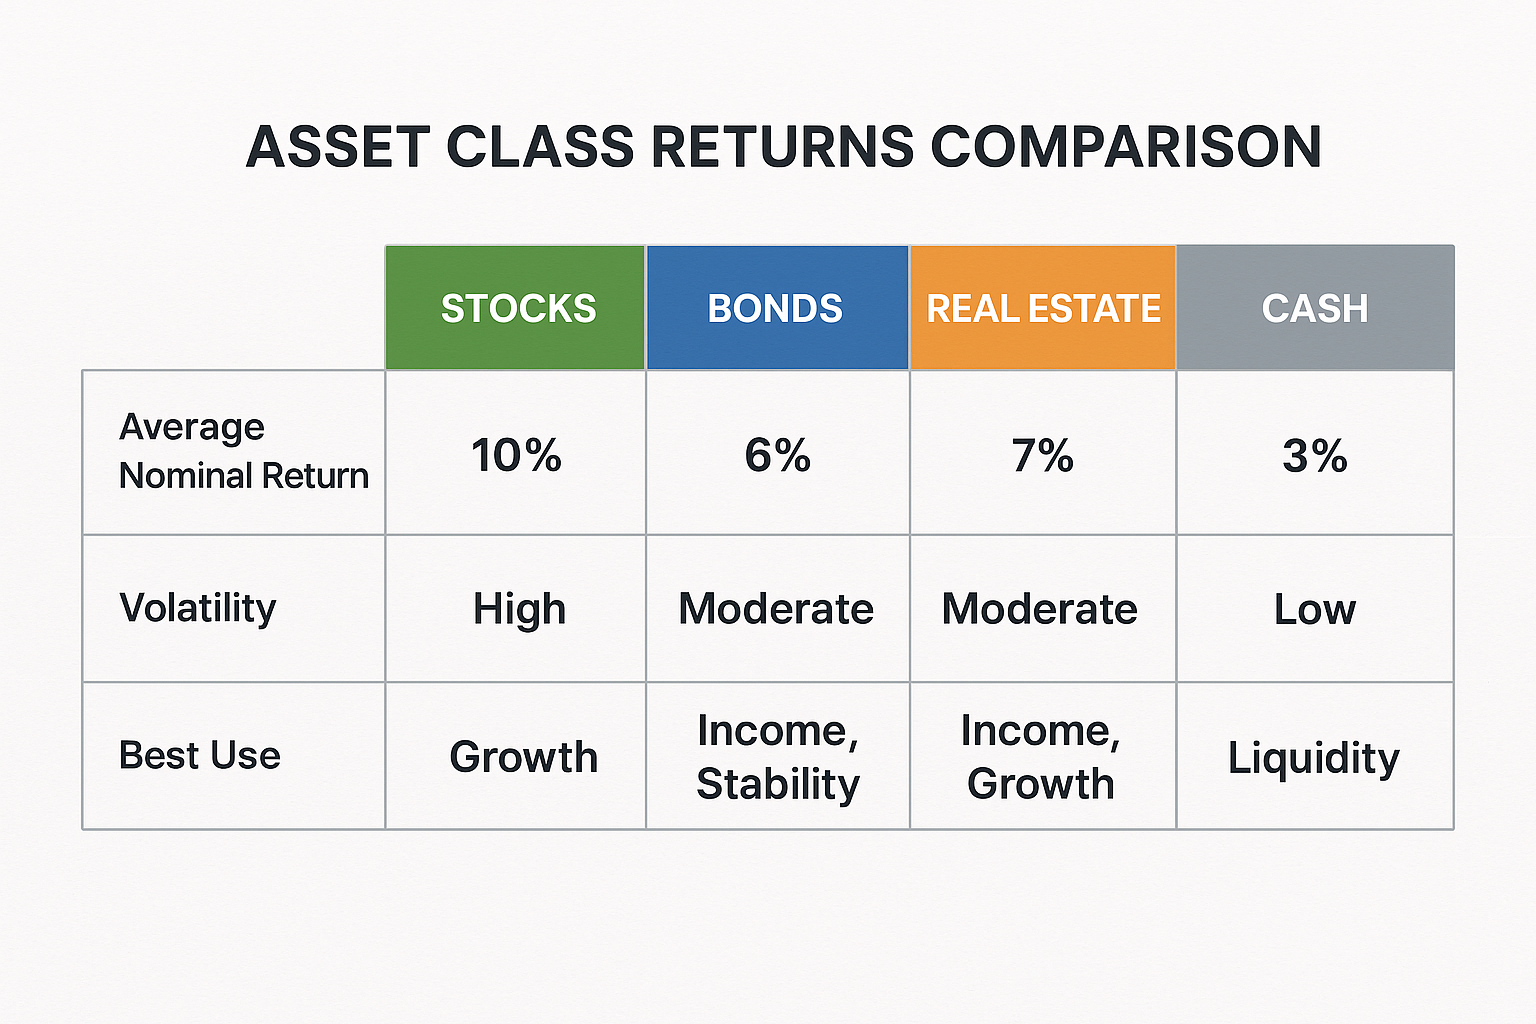
Stocks
- Historical average nominal return: 10-11% annually (S&P 500 since 1926)
- Volatility: High (can swing 30% to +30% in a single year)
- Best for: Long-term growth, beating inflation
- Risk level: High short-term, moderate long-term
Bonds
- Historical average nominal return: 5-6% annually
- Volatility: Low to moderate
- Best for: Income generation, portfolio stability
- Risk level: Low to moderate (varies by bond type)
Real Estate
- Historical average nominal return: 8-12% annually (including rental income)
- Volatility: Moderate
- Best for: Diversification, inflation hedge, income
- Risk level: Moderate
Cash/Savings
- Current nominal return: 0.5-5% depending on account type
- Volatility: Essentially zero
- Best for: Emergency funds, short-term needs
- Risk level: Very low (but high inflation risk)
Understanding these differences helps when you’re building a diversified portfolio or exploring passive income opportunities.
How to Use Nominal Return Data Wisely
Knowing your nominal return is useful, but here’s how to actually apply this knowledge:
Do’s:
- Compare apples to apples: When comparing investments, ensure you’re looking at the same time periods
- Consider the context: A 5% return during a recession is different from 5% during a boom
- Look at multi-year averages: Single-year returns can be misleading
- Factor in dividends: Total return (price appreciation + dividends) gives a fuller picture
- Adjust for risk: Higher nominal returns often come with higher volatility
Don’ts:
- Don’t ignore inflation: Always calculate real return for meaningful comparisons
- Don’t forget taxes: After-tax returns matter more than pre-tax figures
- Don’t chase past performance: Historical returns don’t guarantee future results
- Don’t overlook fees: A 1% fee difference compounds dramatically over time
- Don’t make decisions on nominal returns alone: Consider risk, liquidity, and goals
Common Mistakes Investors Make with Nominal Returns
Even experienced investors sometimes fall into these traps:
Mistake #1: Celebrating Nominal Gains Without Context
Seeing your account balance increase feels great, but if inflation runs higher than your return, you’re actually losing ground. Always calculate real return to know if you’re truly ahead.
Mistake #2: Comparing Different Time Periods
“My investment returned 20% last year!” sounds impressive, but was that during a bull market when the overall market returned 25%? Context matters enormously.
Mistake #3: Ignoring the Cycle of Market Emotions
Investors often make poor decisions by chasing high nominal returns during market peaks or selling during troughs. Understanding market psychology helps avoid these mistakes.
Mistake #4: Focusing Only on Returns, Not Risk-Adjusted Returns
A 15% nominal return with extreme volatility might be worse than a steady 8% return for many investors, especially those nearing retirement.
Mistake #5: Not Accounting for Sequence of Returns Risk
The order in which you experience returns matters tremendously, especially when withdrawing money. Two portfolios with identical average nominal returns can produce vastly different outcomes based on when gains and losses occur.
Nominal Return vs Other Return Metrics
The investment world uses various return measurements. Here’s how nominal return compares:
Total Return
Total return includes both price appreciation and income (dividends, interest). It’s more comprehensive than looking at price changes alone. See the full guide on Total Return
Example: A stock rises 5% in price and pays 2% in dividends = 7% total nominal return
Annualized Return
Annualized return converts multi-year performance into an average annual rate, making it easier to compare investments held for different periods.
Formula: Annualized Return = [(Ending Value / Beginning Value)^(1/Years)] – 1
Risk-Adjusted Return
Risk-adjusted returns factor in volatility to show how much return you earned per unit of risk taken. The Sharpe Ratio is a popular measure:
Sharpe Ratio = (Portfolio Return – Risk-Free Rate) / Portfolio Standard Deviation
A higher Sharpe ratio indicates better risk-adjusted performance. See the full guide on Risk-adjusted return
After-Tax Return
After-tax return shows what you actually keep after paying taxes, which is often the most relevant metric for taxable accounts.
Practical Tips for Maximizing Your Real Returns
Here’s actionable advice to help you focus on what really matters, growing your purchasing power:
1. Invest in Assets That Historically Beat Inflation
Stocks, real estate, and commodities have historically outpaced inflation over long periods. While they’re more volatile in the short term, they offer better protection against purchasing power erosion.
2. Minimize Fees Aggressively
Every 0.5% you save in fees goes directly to your bottom line. Consider low-cost index funds with expense ratios under 0.20%.
3. Tax-Optimize Your Portfolio
- Use tax-advantaged accounts (401k, IRA, HSA) for high-growth investments
- Hold tax-efficient investments (index funds) in taxable accounts
- Consider tax-loss harvesting to offset gains
4. Reinvest Dividends and Interest
Compounding accelerates when you reinvest income. This is especially powerful with dividend investing strategies.
5. Stay Invested Through Market Cycles
Market timing is extremely difficult. According to SEC research, missing just the 10 best days in the market over 20 years can cut returns by 50% or more.
6. Rebalance Periodically
Rebalancing forces you to “sell high and buy low” by trimming winners and adding to underperformers, maintaining your target asset allocation.
7. Focus on Controllable Factors
You can’t control market returns or inflation, but you can control:
- How much do you invest
- Your asset allocation
- Fees you pay
- Tax efficiency
- When you sell
Teaching the Next Generation About Nominal Returns
If you’re a parent or mentor, understanding nominal vs real returns is a valuable lesson to pass on. Financial literacy starts early, and these concepts build a foundation for smart money management. SmartAsset
Consider this: If you’re thinking about how to make your kid a millionaire, teaching them to evaluate investments based on real returns rather than nominal returns gives them a significant advantage.
Simple Exercise for Kids:
- Show them $100 today
- Explain that with 3% inflation, they’ll need $103 next year to buy the same things
- If their savings account pays 1%, they actually lose money in purchasing power
- Demonstrate how investing in stocks historically keeps up with and beats inflation
This simple lesson can shape their financial decision-making for life.
Tools and Resources for Tracking Returns
Several tools can help you calculate and monitor both nominal and real returns:
Free Resources:
- Portfolio Visualizer: Excellent for analyzing historical returns with inflation adjustments
- Personal Capital: Free portfolio tracking with performance analytics
- Yahoo Finance: Basic return calculations and historical data
- Federal Reserve Economic Data (FRED): Official inflation data and economic indicators
Paid Tools:
- Morningstar Premium: In-depth fund analysis with risk-adjusted returns
- Bloomberg Terminal: Professional-grade financial data (expensive)
- Quicken: Personal finance software with investment tracking
Government Resources:
- Bureau of Labor Statistics: Official CPI inflation data
- SEC’s Investor.gov: Educational resources on investment returns
- Federal Reserve: Economic data and inflation forecasts
Understanding Nominal Return in Context: 2025 and Beyond
As we navigate 2025, several factors make understanding nominal vs. real returns more important than ever:
Current Economic Environment
- Interest rates: After the Fed’s rate adjustments in 2023-2024, rates remain above historic lows
- Inflation expectations: Markets expect inflation to stabilize around 2-3% annually
- Stock valuations: Moderate valuations suggest more modest nominal returns ahead compared to 2023
- Bond yields: Higher yields than the 2010s offer better nominal returns but still require inflation consideration
Looking Forward
Economists and financial advisors generally expect:
- Stock returns: 7-9% nominal annually over the next decade
- Bond returns: 4-6% nominal annually
- Inflation: 2-3% annually (Fed target)
- Real stock returns: 4-7% annually
- Real bond returns: 1-4% annually
These projections remind us why focusing on real returns matters—even “good” nominal returns might barely beat inflation in some scenarios.
When Nominal Returns Can Be Misleading
There are specific situations where nominal returns paint an incomplete or misleading picture:
During Hyperinflation
In countries experiencing hyperinflation (10%+ annually), nominal returns become almost meaningless. An investment could show a 50% nominal return while losing massive purchasing power if inflation runs at 100%.
Short Time Periods
A single year’s nominal return tells you little about investment quality. Markets are volatile short-term, and one year’s 30% gain could be followed by a 20% loss.
Without Dividend Reinvestment
Price-only nominal returns ignore the compounding power of reinvested dividends, which historically account for about 40% of stock market returns.
Across Different Currencies
Comparing nominal returns in different currencies without adjusting for exchange rates and local inflation creates false comparisons.
For Leveraged Investments
Leveraged investments (using borrowed money) can show dramatic nominal returns that don’t reflect the actual risk and potential for catastrophic losses.
The Bottom Line: Making Nominal Returns Work for You
Nominal return is a useful starting point, but it’s just that—a starting point. Here’s your action plan:
Step 1: Always calculate both nominal AND real returns for your investments
Step 2: Factor in taxes and fees to determine your actual take-home return
Step 3: Compare returns to relevant benchmarks (not just absolute numbers)
Step 4: Focus on long-term averages rather than short-term fluctuations
Step 5: Build a diversified portfolio designed to beat inflation over time
Remember: The goal isn’t to maximize nominal returns—it’s to maximize real, after-tax, risk-adjusted returns that align with your financial goals and risk tolerance.
Whether you’re just starting your investment journey or you’re a seasoned investor, understanding the difference between nominal and real returns helps you make better decisions, avoid common pitfalls, and build lasting wealth.
For more insights on building wealth and making smart investment decisions, explore our guides on smart money moves and understanding why people lose money in the stock market.
Conclusion
Nominal return represents the raw, unadjusted percentage gain or loss on your investments—it’s the headline number that grabs attention but tells only part of the story. While it’s essential for comparing investments and tracking performance, smart investors know that real return (adjusted for inflation) reveals the true picture of wealth growth.
The difference between a 7% nominal return and a 4% real return might seem small on paper, but over decades of investing, it determines whether you’ll achieve your financial goals or fall short. By understanding nominal returns in context—factoring in inflation, taxes, fees, and risk—you transform from someone who simply watches account balances to an investor who builds genuine, lasting wealth.
Your Next Steps:
- Review your current investments and calculate both nominal and real returns for the past year
- Use the calculator above to see how inflation impacts your specific situation
- Adjust your portfolio if your real returns consistently lag inflation
- Educate yourself further by exploring more resources on our blog
- Share this knowledge with friends and family who might be making decisions based solely on nominal returns
Remember: In investing, what you keep after inflation, taxes, and fees matters far more than the headline number. Make 2025 the year you start thinking like a truly informed investor.
Disclaimer
This article is for educational and informational purposes only and should not be construed as financial, investment, tax, or legal advice. The information presented represents general principles and may not be suitable for your specific situation. Investment returns, including nominal and real returns, are not guaranteed, and past performance does not predict future results. All investments carry risk, including the potential loss of principal.
Inflation rates, tax rates, and market conditions change over time and vary by location and individual circumstances. Before making any investment decisions, please consult with qualified financial, tax, and legal professionals who can assess your unique situation and goals.
The examples provided are hypothetical and for illustration purposes only. Actual investment results will vary based on numerous factors, including market conditions, timing, fees, taxes, and individual circumstances.
The author and publisher are not responsible for any losses or damages that may result from reliance on information contained in this article. Always perform your own due diligence and research before investing.
About the Author
Max Fonji is a financial educator and investment strategist with over a decade of experience helping everyday people understand complex financial concepts. Through TheRichGuyMath.com, Max breaks down investing, wealth-building, and money management into practical, actionable strategies that anyone can implement. His mission is to democratize financial knowledge and empower readers to take control of their financial futures.
When he’s not writing about finance, Max enjoys analyzing market trends, mentoring young investors, and finding creative ways to explain why math and money matter in everyday life.
Connect with Max and discover more wealth-building strategies at TheRichGuyMath.com.
Related posts:
 What Is SmartPass? Raptor Digital Hall Pass Explained for K-12 Schools
 What Is the 3x Rent Rule & How to Calculate It (With Examples)
 Portfolio Income: Definition, Examples, Tax Rules, and Strategies
 Bookkeeping vs Accounting: What’s the Difference & Which Do You Need?
 What Is Profitability Analysis & How to Do It: Metrics, Example & Tips
 How to Save Money Fast: A Smart Savings Plan That Actually Works