Imagine you’re standing at a crossroads, holding two investment opportunities in your hands. One promises $10,000 in five years, while the other offers $8,000 today. Which one should you choose? The answer isn’t as obvious as it seems, and that’s exactly where Net Present Value (NPV) becomes your financial superpower.
NPV is a financial metric that calculates the present value of all future cash flows from an investment, minus the initial cost. In simple terms, NPV tells you how much an investment is worth in today’s dollars, accounting for the time value of money—the principle that money available today is worth more than the same amount in the future because of its earning potential. Investopedia – NPV Basics
Whether you’re evaluating a business project, comparing investment opportunities in the stock market, or deciding whether to buy rental property, NPV helps you make smarter financial decisions by putting every dollar on equal footing. It’s the difference between guessing and knowing whether an investment will actually make you richer.
TL;DR Summary
- NPV calculates the present value of future cash flows minus the initial investment, telling you if a project will create or destroy wealth
- Positive NPV means accept; negative NPV means reject—it’s the golden rule for investment decisions
- The NPV formula is: NPV = Σ [Cash Flow / (1 + r)^t] – Initial Investment, where r is the discount rate and t is time
- NPV accounts for the time value of money, making it superior to simple payback period or return calculations
- The discount rate choice is critical—it represents your opportunity cost and risk, and changing it can flip your decision
What Is Net Present Value (NPV)?
Net Present Value is the difference between the present value of cash inflows and the present value of cash outflows over a specific time period. Think of it as a financial time machine that brings all future money back to today’s value so you can make an apples-to-apples comparison.
The core concept: A dollar today is worth more than a dollar tomorrow because you could invest that dollar today and earn returns. NPV captures this reality by “discounting” future cash flows back to their present value.
Why NPV Matters for Investors
NPV is the cornerstone of capital budgeting and investment analysis for several compelling reasons:
It accounts for the time value of money (unlike simple ROI)
It considers all cash flows throughout the investment’s life
It provides a dollar value of wealth creation or destruction
It’s theoretically sound and widely accepted in finance
It helps compare projects of different sizes and durations
According to the CFA Institute, NPV is considered the gold standard for evaluating investment projects because it directly measures the expected increase in shareholder wealth.
The Net Present Value Formula
The NPV formula might look intimidating at first, but it’s actually quite logical once you break it down:
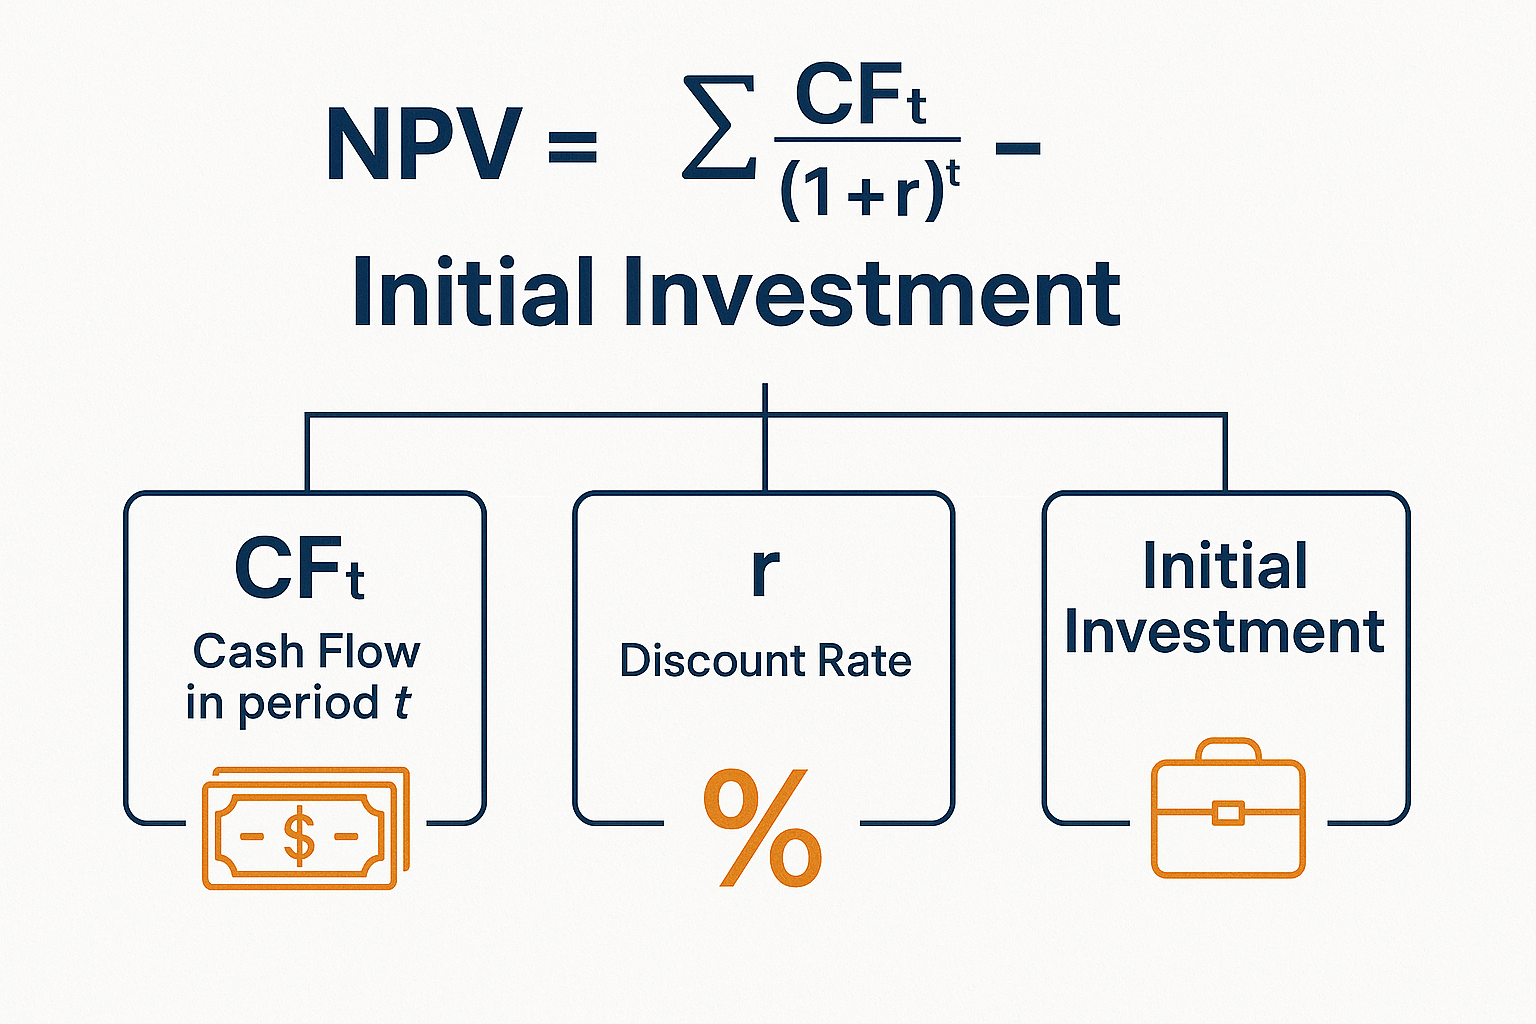
NPV = Σ [CF_t / (1 + r)^t] – Initial Investment
Where:
- CF_t = Cash flow in period t
- r = Discount rate (required rate of return)
- t = Time period (year 1, 2, 3, etc.)
- Σ = Sum of all discounted cash flows
Let’s translate this into plain English: You’re adding up all the future cash flows after shrinking them down to today’s value (by dividing by that discount factor), then subtracting what you paid upfront.
How to Calculate Net Present Value Step-by-Step
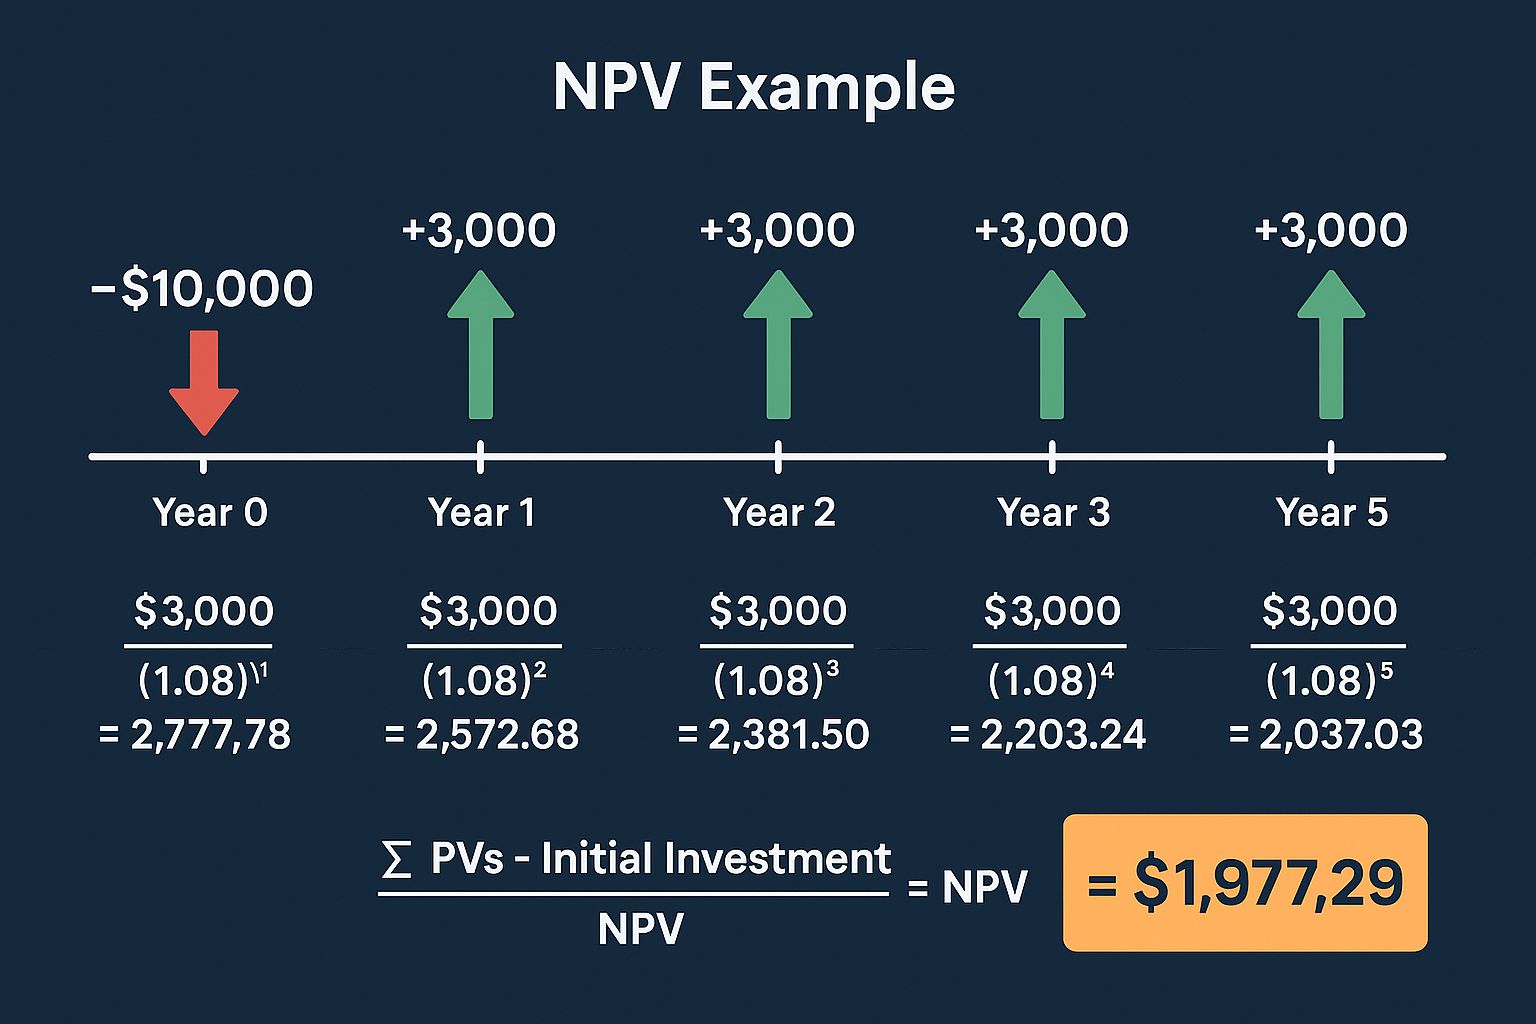
Scenario: You’re considering investing $10,000 in a project that will generate $3,000 per year for 5 years. Your required rate of return (discount rate) is 8%.
Step 1: Identify your variables
- Initial Investment = $10,000
- Annual Cash Flow = $3,000
- Discount Rate (r) = 8% or 0.08
- Time Period = 5 years
Step 2: Calculate the present value of each year’s cash flow
| Year | Cash Flow | Calculation | Present Value |
|---|---|---|---|
| 1 | $3,000 | $3,000 / (1.08)^1 | $2,777.78 |
| 2 | $3,000 | $3,000 / (1.08)^2 | $2,572.02 |
| 3 | $3,000 | $3,000 / (1.08)^3 | $2,381.50 |
| 4 | $3,000 | $3,000 / (1.08)^4 | $2,204.17 |
| 5 | $3,000 | $3,000 / (1.08)^5 | $2,041.82 |
Step 3: Sum all present values
Total PV of Cash Flows = $11,977.29
Step 4: Subtract the initial investment
NPV = $11,977.29 – $10,000 = $1,977.29
Decision: Since the NPV is positive ($1,977.29), this investment would create value and should be accepted!
Understanding the Discount Rate: The Heart of Net Present Value
The discount rate is arguably the most critical component of NPV calculation, yet it’s often the most misunderstood. The discount rate represents your opportunity cost—what you could earn on an alternative investment with similar risk.
How to Choose the Right Discount Rate
For corporate projects: Use the company’s Weighted Average Cost of Capital (WACC)
For personal investments: Use your required rate of return based on risk
For stock investments: Consider the expected market return (historically ~10% for the S&P 500)
For real estate: Factor in mortgage rates plus a risk premium
A higher discount rate makes future cash flows less valuable today, while a lower rate makes them more valuable. This is why understanding market cycles is crucial—interest rates and required returns change over time.
The Impact of Discount Rate Changes
Let’s see how changing the discount rate affects our previous example:
| Discount Rate | NPV | Decision |
|---|---|---|
| 5% | $2,989.65 | Accept |
| 8% | $1,977.29 | Accept |
| 10% | $1,372.36 | Accept |
| 15% | $56.60 | Accept (barely) |
| 16% | -$188.44 | Reject |
Notice how at 16%, the same project goes from wealth-creating to wealth-destroying! This demonstrates why choosing an appropriate discount rate is absolutely critical.
NPV Decision Rules: Accept or Reject?
The beauty of NPV lies in its simplicity when making decisions:
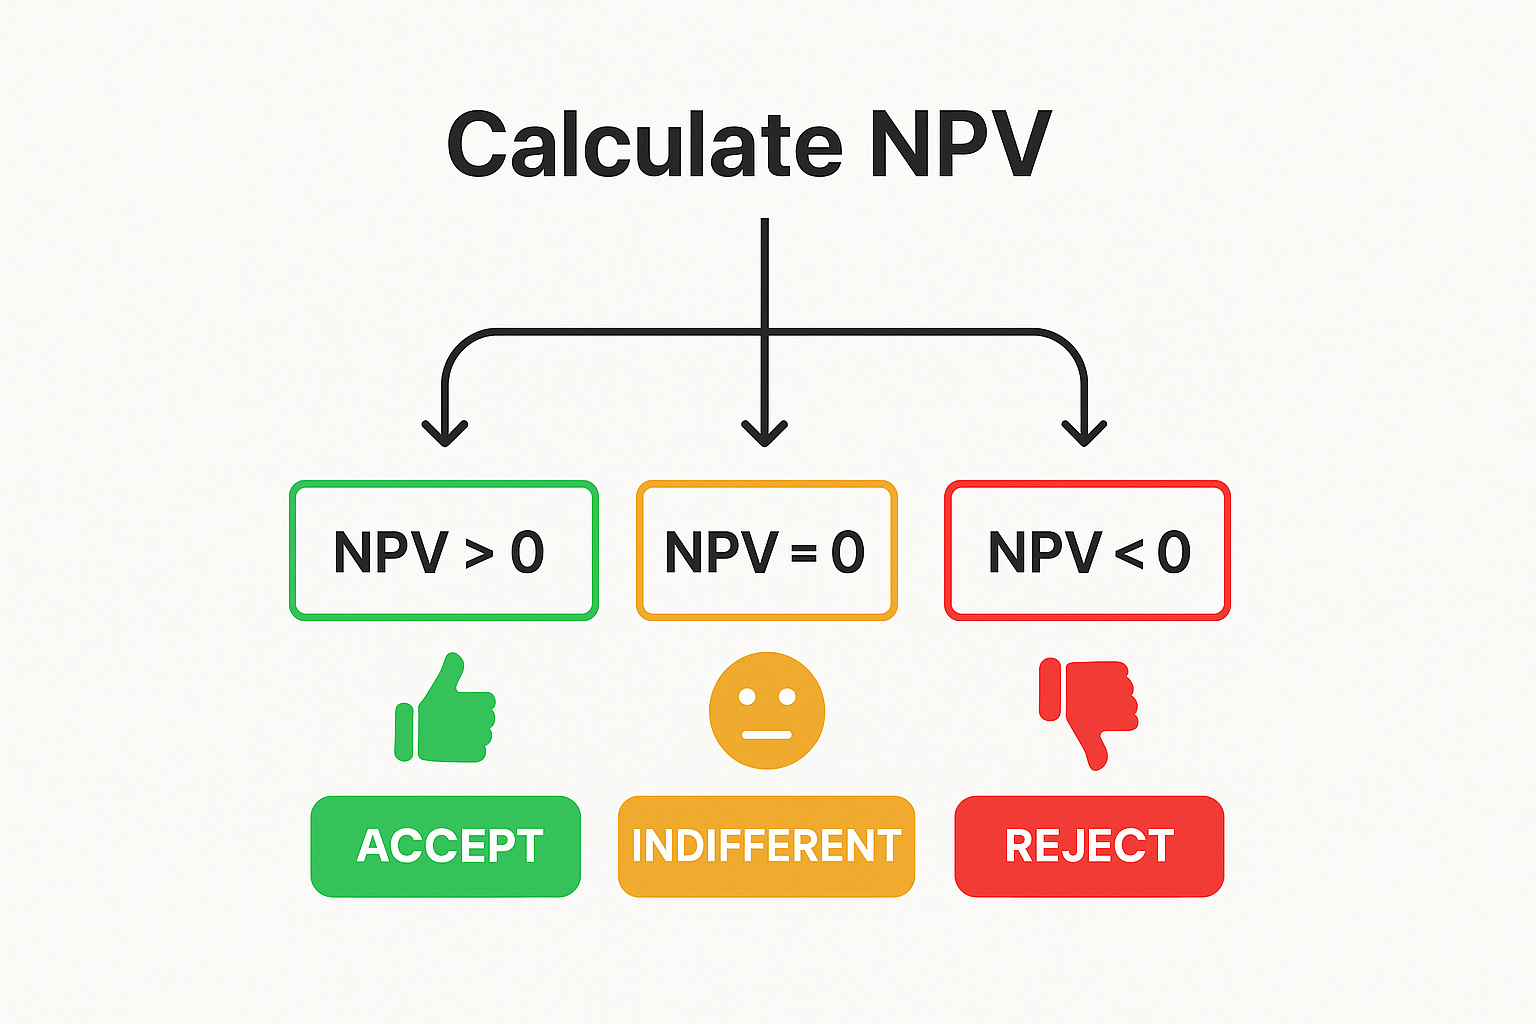
The Golden Rules
NPV > 0 (Positive): Accept the investment—it creates value
NPV < 0 (Negative): Reject the investment—it destroys value
NPV = 0: The investment breaks even; you’re indifferent
When comparing multiple projects:
- Choose the project with the highest positive NPV
- If projects are mutually exclusive, select the one with the greatest NPV
- If capital is limited, rank projects by profitability index (NPV/Initial Investment)
This straightforward decision framework is one reason why NPV is preferred over other metrics in professional finance. According to Morningstar, over 75% of financial analysts use NPV as their primary project evaluation tool.
Real-World NPV Example: Stock Investment Decision
Let’s apply NPV to a real investing scenario that might resonate with you.
Scenario: You’re considering buying shares in a dividend-paying company for $5,000. Based on your analysis, you expect to receive $400 in annual dividends for 5 years, and you believe you can sell the stock for $6,000 at the end of year 5. Your required return for stocks is 12%.
Cash Flow Timeline:
- Year 0: -$5,000 (initial investment)
- Years 1-5: $400 (dividends)
- Year 5: $6,000 (sale proceeds) + $400 (dividend) = $6,400 total
NPV Calculation:
| Year | Cash Flow | Present Value |
|---|---|---|
| 0 | -$5,000 | -$5,000.00 |
| 1 | $400 | $357.14 |
| 2 | $400 | $318.88 |
| 3 | $400 | $284.71 |
| 4 | $400 | $254.21 |
| 5 | $6,400 | $3,632.29 |
Total NPV = $847.23
Decision: With a positive NPV of $847.23, this investment would theoretically add value to your portfolio. However, remember that these projections involve uncertainty—actual dividends and stock prices may differ from expectations. Corporate Finance Institute – NPV
This is exactly why starting with dividend investing can be attractive—the regular cash flows make NPV analysis more reliable than growth stocks with uncertain future values.
Net Present Value vs Other Investment Metrics: A Comparison
NPV doesn’t work in isolation. Understanding how it compares to other financial metrics helps you see its strengths and limitations. CFA Institute – Net Present Value
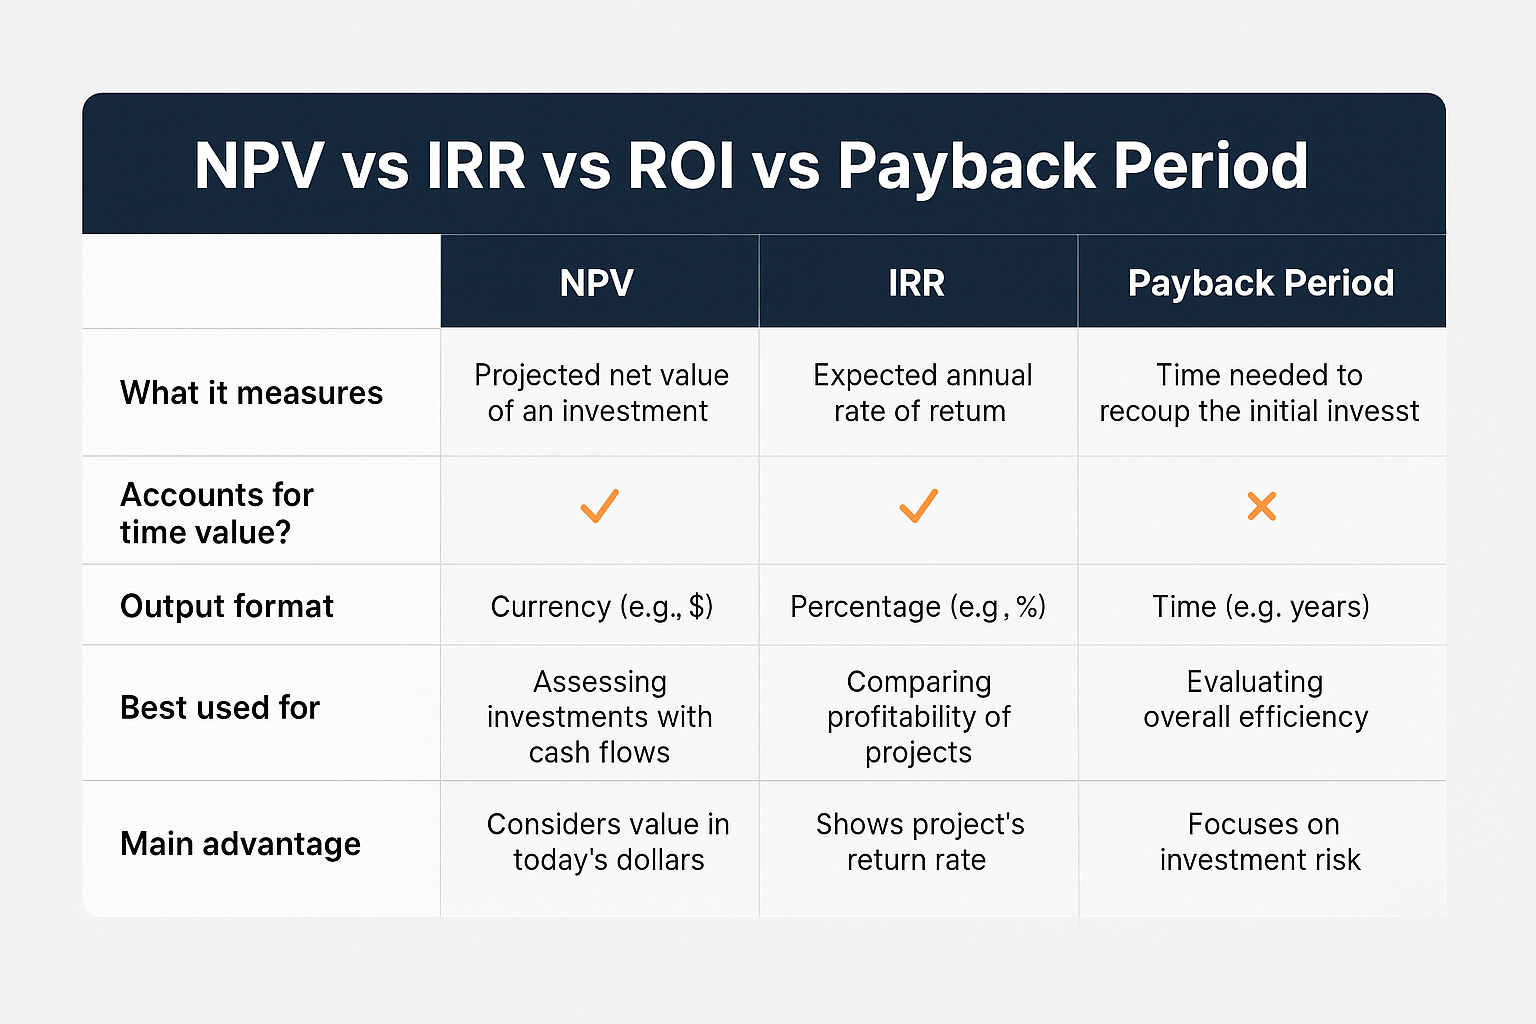
NPV vs. Payback Period
Payback Period measures how long it takes to recover your initial investment.
Advantages of NPV:
- Considers the time value of money
- Accounts for all cash flows, not just until payback
- Measures total wealth creation
When Payback Period is useful:
- Quick screening of projects
- When liquidity is a major concern
- In highly uncertain environments
NPV vs Internal Rate of Return (IRR)
IRR is the discount rate that makes Net Present Value equal to zero—essentially, your breakeven rate of return.
NPV Advantages:
- Gives a dollar amount of value creation
- Doesn’t have multiple IRR problems
- Better for comparing projects of different sizes
IRR Advantages:
- Expressed as a percentage (easier to understand)
- Doesn’t require a predetermined discount rate
- Useful for comparing to required return thresholds
The Verdict: Most financial professionals use both metrics together, with NPV taking priority when they conflict.
NPV vs. Return on Investment (ROI)
ROI simply measures the percentage return: (Gain – Cost) / Cost × 100
NPV wins because:
- It accounts for the timing of cash flows
- It considers the opportunity cost of capital
- It provides absolute value creation, not just a percentage
However, ROI is still valuable for quick comparisons and when communicating with non-financial audiences.
Advantages and Limitations of NPV
Advantages of NPV
1. Time Value of Money
NPV properly accounts for the fact that money today is worth more than money tomorrow—a fundamental financial principle.
2. All Cash Flows Considered
Unlike the payback period, NPV includes every dollar that flows in and out throughout the project’s entire life.
3. Direct Wealth Measurement
NPV tells you exactly how many dollars of wealth an investment creates or destroys—not just a percentage or ratio.
4. Theoretically Sound
NPV is grounded in solid financial theory and aligns to maximize shareholder value.
5. Facilitates Better Comparisons
You can compare projects of different sizes, durations, and cash flow patterns on an equal basis.
Limitations and Challenges of NPV
1. Discount Rate Uncertainty
Choosing the “right” discount rate is subjective and can significantly impact results. A 2% difference can flip a decision.
2. Cash Flow Projections
NPV is only as good as your estimates. Garbage in, garbage out. Future cash flows are inherently uncertain.
3. Doesn’t Show Percentage Return
A $1,000 NPV on a $5,000 investment is better than $1,000 NPV on a $100,000 investment, but NPV alone doesn’t show this.
4. Assumes Reinvestment at Discount Rate
NPV assumes you can reinvest cash flows at the discount rate, which may not be realistic.
5. Complex for Non-Financial Audiences
Explaining NPV to stakeholders without financial backgrounds can be challenging compared to simple metrics like ROI.
6. Ignores Non-Financial Factors
NPV focuses purely on financial returns and doesn’t capture strategic value, environmental impact, or social benefits.
How to Use Net Present Value in Your Investment Decisions
Now that you understand NPV, here’s how to apply it practically in your financial life:
For Stock Market Investments
When evaluating high dividend stocks, you can use NPV to:
- Project future dividends based on the company’s history and growth rates
- Estimate a future selling price using conservative valuation multiples
- Apply an appropriate discount rate (12-15% for stocks is common)
- Calculate NPV and compare it to the current stock price
If the NPV is positive, the stock may be undervalued. If negative, it might be overpriced.
For Real Estate Investments
Real estate is perfect for Net Present Value analysis because cash flows are relatively predictable:
- Initial investment: Down payment + closing costs
- Annual cash flows: Rental income – expenses – mortgage payments
- Terminal value: Expected sale price minus selling costs
- Discount rate: Your required return (8-12% is typical)
A positive NPV indicates the property would create wealth beyond your required return.
For Business Projects
If you’re an entrepreneur or business owner, use NPV to evaluate:
- Equipment purchases: Will the efficiency gains justify the cost?
- Marketing campaigns: Will the customer acquisition create enough lifetime value?
- Expansion projects: Will opening a new location generate sufficient returns?
For Retirement Planning
You can even use NPV concepts to evaluate creating passive income streams:
- Compare the present value of future Social Security benefits taken at different ages
- Evaluate whether to buy an annuity by comparing the NPV of payments to the cost
- Assess whether to pay off a mortgage early by comparing the Net Present Value of interest savings to investment returns
Common NPV Mistakes to Avoid
Even experienced investors make these NPV errors:
1: Ignoring Inflation
If your cash flow projections are in nominal dollars (including inflation), your discount rate must also be nominal. If cash flows are in real dollars (inflation-adjusted), use a real discount rate.
Solution: Be consistent. Most investors use nominal figures for both.
2: Forgetting the Initial Investment
It sounds obvious, but some people calculate the present value of inflows and forget to subtract the upfront cost!
Solution: Always include the negative cash flow at time zero.
3: Using the Wrong Discount Rate
Using your savings account rate (1%) or a random number leads to meaningless results.
Solution: Use your true opportunity cost—what you could earn on a similar-risk investment.
4: Overly Optimistic Projections
We all want our investments to succeed, but wishful thinking about future cash flows leads to bad decisions.
Solution: Use conservative estimates. Run sensitivity analysis with pessimistic scenarios.
5: Ignoring Risk Differences
Not all investments carry the same risk. A startup venture should have a higher discount rate than government bonds.
Solution: Adjust your discount rate based on the specific risk profile of each investment.
6: Analysis Paralysis
Some investors get so caught up in perfecting their NPV calculations that they miss opportunities or spend hours on trivial decisions.
Solution: Remember that NPV is a tool, not a crystal ball. Use it for major decisions, but don’t let perfect be the enemy of good.
This is one reason why people lose money in the stock market—they either ignore financial analysis entirely or get paralyzed by it.
Advanced NPV Concepts
Sensitivity Analysis
Since NPV depends heavily on assumptions, smart investors run sensitivity analysis—testing how Net Present Value changes when you vary key inputs:
- What if cash flows are 20% lower than expected?
- What if the discount rate increases by 2%?
- What if the project takes an extra year to generate returns?
This helps you understand which variables matter most and how robust your decision is.
Scenario Analysis
Create three scenarios:
- Best case: Optimistic assumptions
- Base case: Most likely assumptions
- Worst case: Pessimistic assumptions
Calculate NPV for each. If even the worst case shows a positive Net Present Value, you have a highly attractive investment.
NPV and Risk-Adjusted Returns
For risky investments, you can either:
- Increase the discount rate to reflect higher risk (risk-adjusted discount rate method)
- Reduce projected cash flows to account for uncertainty (certainty equivalent method)
Professional investors often use the first approach, adding a risk premium to the risk-free rate.
NPV in the Context of Building Wealth
Understanding Net Present Value is more than just a technical skill; it’s a mindset shift that can transform your financial decision-making. When you start thinking in terms of present value, you begin to see opportunities others miss.
Consider this: Why does the stock market go up over the long term? Because companies create positive NPV projects. They invest capital in ventures that generate returns exceeding their cost of capital. As shareholders, we capture that value creation.
This is also why making smart financial moves matters so much. Every financial decision, from choosing a credit card to buying a home, has a Net Present Value. The wealthy instinctively think this way, even if they don’t formally calculate it.
Teaching NPV to the Next Generation
If you want to know how to make your kid a millionaire, teaching them NPV concepts is incredibly valuable. Even young children can grasp the basic idea: “Would you rather have $10 today or $10 in a year?” This plants the seed of time value thinking.
As they grow, you can introduce:
- Age 8-12: Simple examples with allowance and savings
- Age 13-17: Calculator-based NPV for larger purchases
- Age 18+: Investment evaluation using NPV
Financial literacy built on solid concepts like NPV creates generational wealth.
FAQ: NPV
Any positive NPV is technically “good” because it creates value. However, in practice, investors often require a minimum NPV threshold. For example, a company might only pursue projects with an NPV exceeding $100,000, or an individual might require an NPV to be at least 20% of the initial investment. The higher the NPV relative to the investment size, the better.
For equal annual cash flows (annuities), you can use the present value of annuity formula: PV = C × [(1 – (1 + r)^-n) / r], where C is the cash flow, r is the discount rate, and n is the number of periods. Then subtract your initial investment. Most financial calculators and Excel have NPV functions that do this instantly.
Yes, and a negative NPV means the investment would destroy value—you’d be better off investing your money elsewhere at the discount rate. Always reject projects with negative NPV unless there are compelling non-financial reasons (strategic value, regulatory requirements, etc.).
Present Value (PV) is the current worth of future cash flows. Net Present Value (NPV) is the present value of all cash flows minus the initial investment. NPV = PV of inflows – PV of outflows. NPV tells you the net benefit, while PV is just the value of future money in today’s terms.
Use both, but when they conflict, trust NPV. NPV directly measures wealth creation in dollars, while IRR can be misleading with non-conventional cash flows or when comparing projects of different sizes. The SEC recommends NPV as the primary metric for investment decisions, with IRR as a supplementary measure.
Inflation reduces the real value of future cash flows. If you expect 3% annual inflation, $100 received in 10 years will only buy about $74 worth of goods in today’s dollars. You can handle this by either: (1) using nominal cash flows and a nominal discount rate, or (2) using real (inflation-adjusted) cash flows and a real discount rate. Just be consistent.
Conclusion: Making NPV Work for You
Net Present Value isn’t just a formula—it’s a powerful framework for thinking about money across time. By mastering NPV, you gain the ability to evaluate any investment opportunity with clarity and confidence, from dividend stocks to business ventures to real estate.
Here’s your action plan to start using NPV today:
- Start simple: Use the NPV calculator below to practice with a real investment you’re considering
- Determine your discount rate: Identify your opportunity cost based on alternative investments available to you
- Project cash flows conservatively: Better to underestimate returns than overestimate
- Run scenarios: Test your assumptions with best-case, base-case, and worst-case projections
- Compare to alternatives: Calculate NPV for multiple options to make informed choices
- Review and refine: As you gain experience, your estimates will become more accurate
Remember, Net Present Value is a tool to guide decisions, not a crystal ball. The future is uncertain, and no formula can predict it perfectly. But by thinking in terms of present value and opportunity cost, you’ll make significantly better financial decisions than 90% of investors.
The wealthy don’t just earn more—they allocate capital more efficiently. NPV is how they do it. Now you have the same tool in your hands.
Start small, practice often, and watch as this simple concept transforms your approach to money. Whether you’re evaluating a stock purchase, considering a career change, or deciding on a major purchase, ask yourself: “What’s the NPV?” That question alone will save you from countless costly mistakes and guide you toward genuine wealth creation.
Your financial future isn’t about luck—it’s about making smart, calculated decisions. Net Present Value is your compass. Use it wisely.
💰 NPV Calculator
Calculate the Net Present Value of your investment
Disclaimer
This article is for educational purposes only and does not constitute financial advice. The information provided is based on general financial principles and should not be considered personalized investment recommendations. Net Present Value calculations involve assumptions and projections that may not reflect actual future results. Past performance does not guarantee future returns. Before making any investment decisions, consult with a qualified financial advisor who understands your individual circumstances, risk tolerance, and financial goals. The author and TheRichGuyMath.com assume no liability for any financial decisions made based on this content.
About the Author
Written by Max Fonji — With over a decade of experience in financial analysis and investment education, Max is dedicated to making complex financial concepts accessible to everyone. As the founder of TheRichGuyMath.com, Max has helped thousands of readers build wealth through clear, data-backed investing education. His mission is simple: empower everyday people with the same financial tools and knowledge used by professional investors.
Related posts:
 What Is SmartPass? Raptor Digital Hall Pass Explained for K-12 Schools
 What Is the 3x Rent Rule & How to Calculate It (With Examples)
 Types of Income: A Complete Guide to Earning and Growing Wealth
 Tax Filing: A Clear, Step-by-Step Guide for Stress-Free Taxes
 Return on Assets (ROA): Definition, Formula & How to Improve It
 How to Save Money Fast: A Smart Savings Plan That Actually Works