When a business owner reviews their company’s financial health, they often focus on revenue and profit margins. But there’s a critical component hiding in plain sight on the balance sheet that reveals whether a company can actually sustain its day-to-day operations: operating liabilities.
Understanding operating liabilities is fundamental to grasping the math behind money in business. These obligations represent the financial commitments a company must honor to keep its operations running smoothly. Unlike long-term debt or financing arrangements, operating liabilities are the lifeblood payments that enable revenue generation, from paying suppliers to compensating employees.
Operating Liabilities are monetary obligations directly tied to a company’s core business operations that must be settled within one year or the normal operating cycle. They represent the essential financial commitments required to sustain daily business activities and continue generating revenue.
This guide breaks down the definition, calculation methods, formulas, and real-world examples of operating liabilities with the precision and clarity needed for evidence-based financial analysis.
Key Takeaways
- Operating liabilities are obligations necessary for core business operations, distinct from financing-related debts like long-term loans or bonds
- The formula to calculate operating liabilities subtracts non-operating liabilities from total liabilities, isolating operational obligations
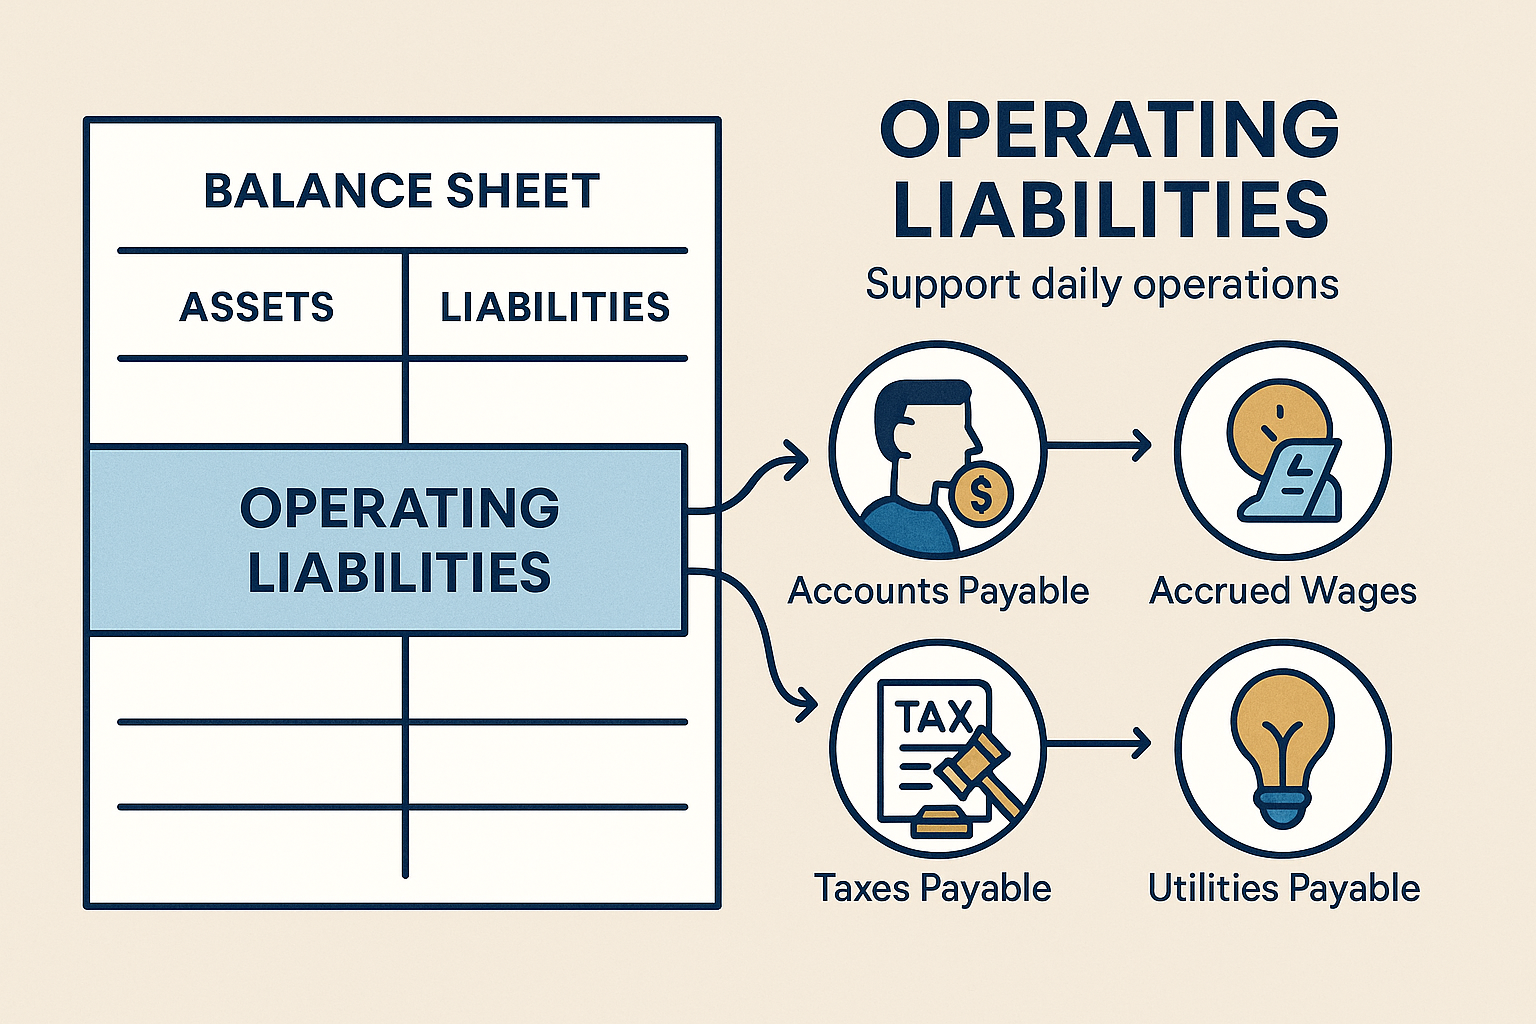
- Common examples include accounts payable, accrued wages, taxes payable, and utilities—expenses that directly support revenue generation
- Operating liabilities are essential for calculating Net Operating Assets (NOA), a key metric in financial analysis and valuation
- Proper classification of operating vs. non-operating liabilities provides accurate insights into working capital management and operational efficiency
What Are Operating Liabilities?
Operating liabilities represent the financial obligations a company incurs through its normal business operations. These are not debts taken on to finance expansion or capital investments—they are the necessary costs of doing business every single day.
The defining characteristic of an operating liability is its direct connection to revenue generation. When a company purchases inventory on credit, hires employees who earn wages, or consumes utilities to run a factory, it creates operating liabilities. These obligations must be paid to maintain business continuity and operational capacity.
Operating liabilities appear on the balance sheet under the liabilities section, typically classified as current liabilities because they’re due within one year. However, not all current liabilities qualify as operating liabilities; this distinction is crucial for accurate financial analysis.
Operating Liabilities vs Non-Operating Liabilities
The classification depends on one key question: Is this obligation necessary for the company’s operations to continue?
Operating liabilities include:
- Accounts payable to suppliers
- Accrued wages and salaries
- Income taxes payable
- Utilities and rent payable
- Accrued expenses for operational services
Non-operating (financial) liabilities include:
- Long-term debt and bonds payable
- Short-term borrowings for financing purposes
- Dividend payables to shareholders
- Interest payable on loans
This separation matters because operating liabilities reflect the efficiency of working capital management, while financial liabilities indicate capital structure decisions. Understanding accounts payable as an operating liability helps clarify this distinction.
Why Operating Liabilities Matter for Financial Analysis
Operating liabilities serve as a critical input for several important financial metrics:
- Net Operating Assets (NOA) calculation
- Working capital assessment
- Cash conversion cycle analysis
- Operational efficiency ratios
Investors and analysts use operating liabilities to evaluate how effectively a company manages its operational capital. A company with well-managed operating liabilities maintains smooth operations without tying up excessive cash or creating liquidity risks.
The relationship between assets and liabilities becomes clearer when we separate operating from financing activities, providing a more accurate picture of business performance.
The Operating Liabilities Formula and Calculation Method
Calculating operating liabilities requires a systematic approach to separate operational obligations from financing-related debts. The formula is straightforward but demands careful classification of balance sheet items.
Primary Formula for Operating Liabilities
The fundamental formula for calculating operating liabilities is:
Operating Liabilities = Total Liabilities – Non-Operating Liabilities
This subtraction method isolates the liabilities directly tied to business operations by removing all financing-related obligations from the total liabilities figure.
Step-by-Step Calculation Process
Step 1: Identify Total Liabilities
Start with the total liabilities figure from the balance sheet. This includes both current and long-term liabilities.
Step 2: Identify Non-Operating Liabilities
Review the balance sheet to identify liabilities related to financing activities:
- Long-term debt
- Short-term borrowings
- Notes payable (financing)
- Bonds payable
- Capital lease obligations
- Dividend payables
Step 3: Subtract Non-Operating from Total
Operating Liabilities = Total Liabilities – (Long-term Debt + Short-term Borrowings + Other Financial Liabilities)
Step 4: Verify with Direct Addition
Alternatively, you can calculate operating liabilities by directly summing operational obligations:
Operating Liabilities = Accounts Payable + Accrued Wages + Taxes Payable + Accrued Expenses + Deferred Revenue + Other Operating Obligations
Both methods should yield the same result. The direct addition method provides verification and deeper insight into the composition of operating liabilities.
Net Operating Assets (NOA) Formula
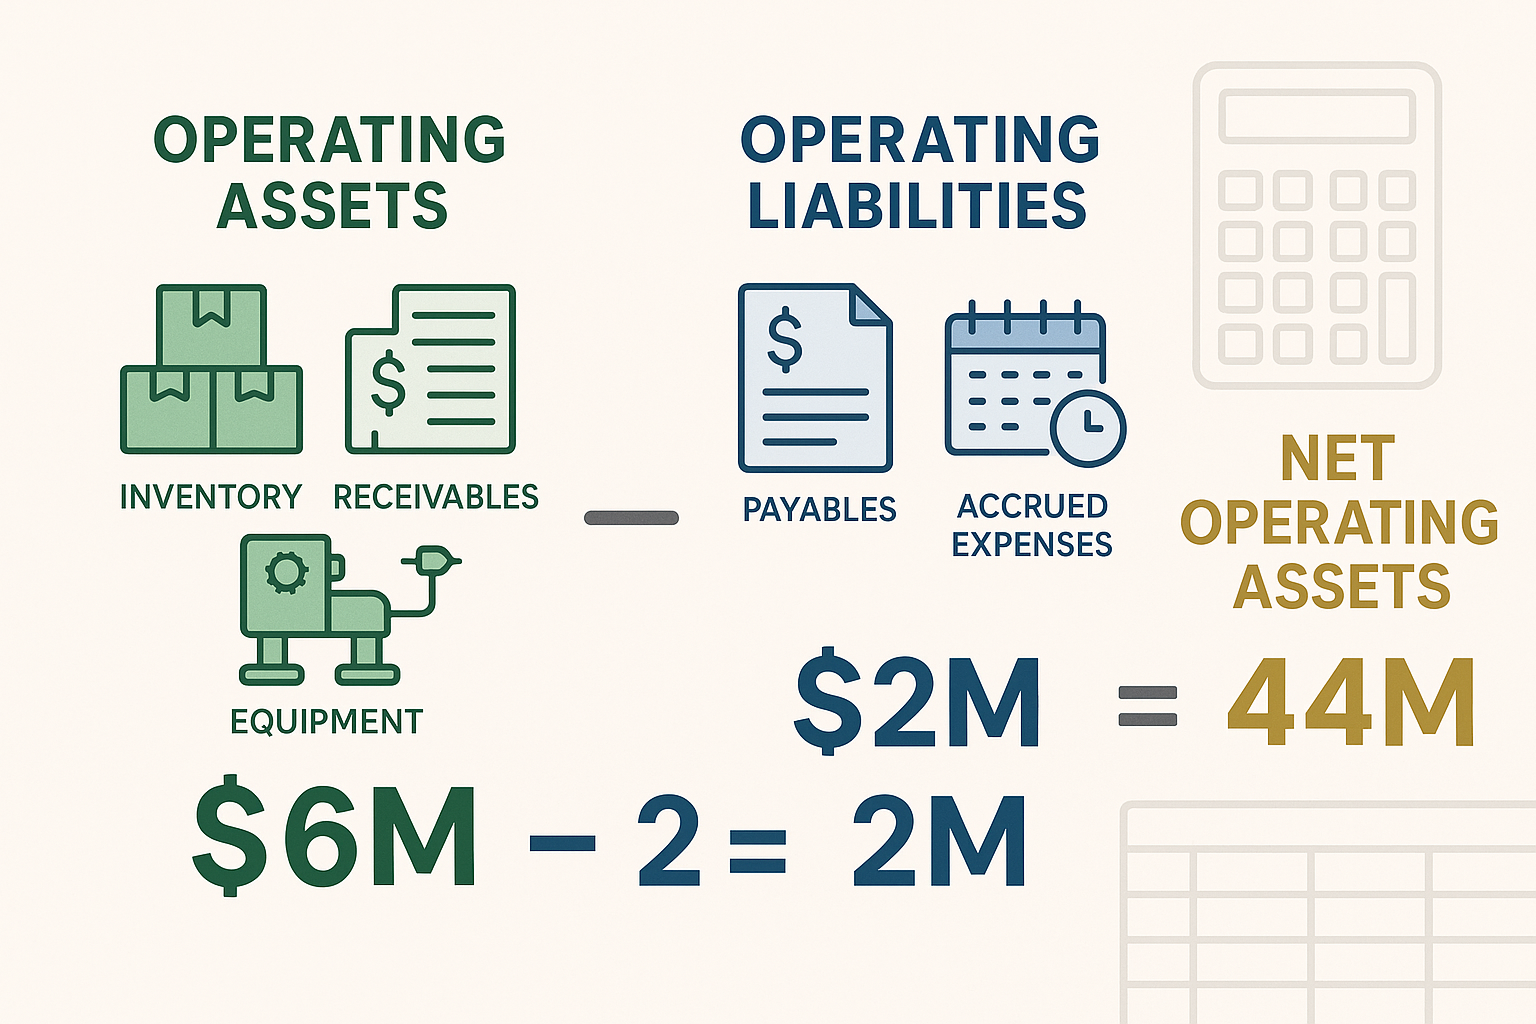
Operating liabilities are most commonly used in the calculation of Net Operating Assets:
NOA = Operating Assets – Operating Liabilities
This formula represents the net investment in operational activities, excluding financing decisions. It’s a powerful metric for evaluating operational efficiency and comparing companies within the same industry.
Understanding current liabilities provides additional context for how operating liabilities fit into the broader balance sheet structure.
Practical Calculation Example
Consider a manufacturing company with the following balance sheet data:
Total Liabilities: $10,000,000
Breakdown:
- Accounts Payable: $2,500,000
- Accrued Wages: $800,000
- Taxes Payable: $600,000
- Accrued Utilities: $300,000
- Deferred Revenue: $400,000
- Long-term Debt: $4,500,000
- Short-term Borrowings: $900,000
Calculation using the subtraction method:
Non-Operating Liabilities = $4,500,000 + $900,000 = $5,400,000
Operating Liabilities = $10,000,000 – $5,400,000 = $4,600,000
Verification using direct addition:
Operating Liabilities = $2,500,000 + $800,000 + $600,000 + $300,000 + $400,000 = $4,600,000 ✓
This company has $4.6 million in operating liabilities supporting its daily operations. If its operating assets total $8 million, the Net Operating Assets would be:
NOA = $8,000,000 – $4,600,000 = $3,400,000
This NOA figure represents the net capital invested in the company’s core operations, providing a clearer picture of operational efficiency than total assets alone.
Common Examples of Operating Liabilities in Business
Operating liabilities vary by industry and business model, but certain categories appear consistently across most companies. Understanding these common examples helps with accurate classification and financial analysis.
1. Accounts Payable
Accounts payable represent money owed to suppliers for goods and services purchased on credit. This is typically the largest operating liability for most businesses.
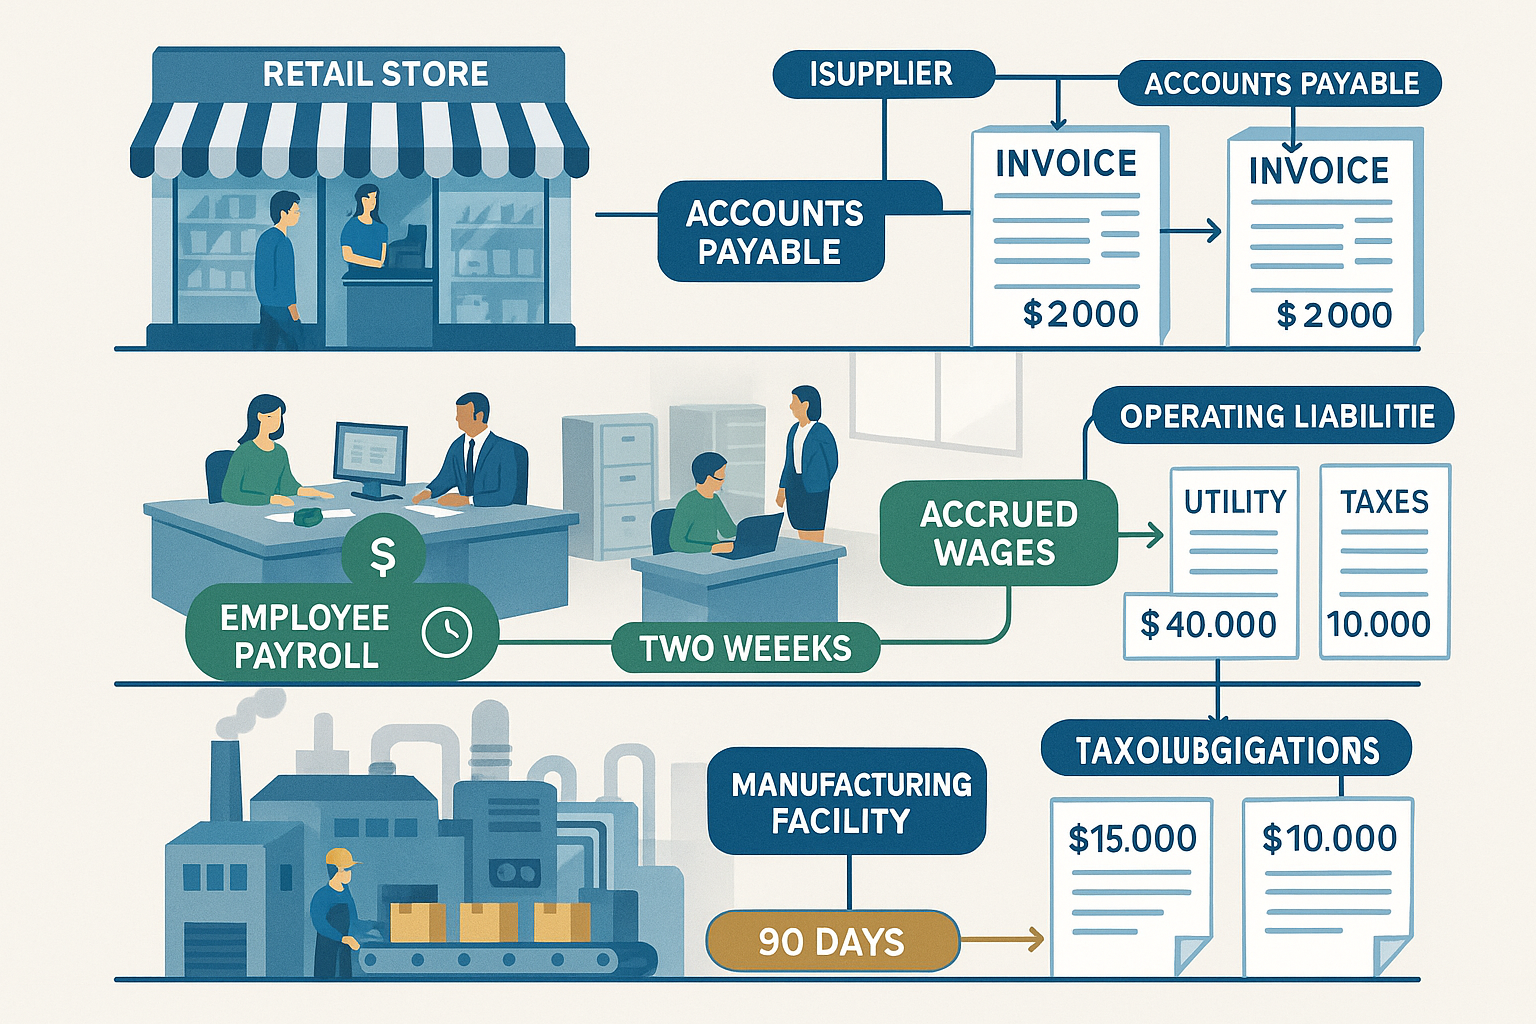
When a retailer orders inventory from a supplier with 30-day payment terms, the amount owed becomes accounts payable. This liability directly supports revenue generation because the inventory will be sold to customers.
Example: A grocery store chain orders $500,000 worth of products from various suppliers with net-30 payment terms. The $500,000 appears as accounts payable on the balance sheet until payment is made.
The relationship between accounts receivable and accounts payable illustrates the working capital cycle that drives business operations.
2. Accrued Wages and Salaries
Companies typically pay employees after work is performed, creating a timing gap between when labor is provided and when payment is made. This creates an accrued wages liability.
Example: A company with a bi-weekly payroll has employees who worked the last week of the month but won’t be paid until the first week of the next month. The wages earned but not yet paid appear as accrued wages payable.
For a company with 100 employees averaging $1,000 per week, one week of accrued wages equals $100,000 in operating liabilities.
3. Income Taxes Payable
Taxes owed to government authorities for business operations represent operating liabilities. These include corporate income taxes, sales taxes collected, payroll taxes, and property taxes.
Example: A corporation calculates quarterly tax obligations of $250,000 based on operating income. Until the payment is made to the tax authority, this $250,000 remains as income taxes payable.
Understanding accounting profit helps clarify how tax liabilities arise from operational earnings.
4. Accrued Expenses
Accrued expenses encompass various operational costs incurred but not yet paid, including utilities, rent, insurance, and professional services.
Example: A manufacturing facility consumes $50,000 in electricity during March but receives the bill in April with payment due in May. The $50,000 is recorded as an accrued utility expense in March.
5. Deferred Revenue (Unearned Revenue)
When customers pay in advance for goods or services not yet delivered, the company records a liability called deferred revenue. This represents an obligation to perform future services or deliver products.
Example: A software company receives $120,000 for annual subscriptions paid upfront. Until the service is provided over the year, this represents an operating liability because the company must deliver the service to satisfy the obligation.
Understanding deferred revenue clarifies why this prepayment creates a liability rather than immediate revenue.
6. Warranty Obligations
Companies that offer product warranties create estimated liabilities for future warranty claims based on historical data and expected failure rates.
Example: An electronics manufacturer sells $10 million in products with a one-year warranty. Based on historical data showing 3% warranty claims, the company records $300,000 as a warranty liability.
7. Operating Lease Obligations (Current Portion)
Under current accounting standards, operating leases for facilities, equipment, and vehicles create both assets and liabilities on the balance sheet. The current portion due within one year qualifies as an operating liability.
Example: A retail chain leases 50 store locations with annual rent totaling $2 million. The current year’s rent obligation appears as an operating liability.
Industry-Specific Operating Liabilities
Different industries have unique operating liabilities:
Retail: Heavy accounts payable for inventory, accrued rent for store locations
Manufacturing: Accounts payable for raw materials, accrued wages for production workers, utility expenses
Software/SaaS: Deferred revenue from subscriptions, accrued hosting costs
Healthcare: Accounts payable for medical supplies, accrued salaries for medical staff
Construction: Accounts payable for materials, accrued subcontractor costs
What Operating Liabilities Are NOT
To reinforce understanding, here’s what doesn’t qualify as operating liabilities:
Long-term debt and bonds (financing activities)
Short-term borrowings for working capital (financing)
Dividend payables (shareholder distributions)
Interest payable on loans (financing costs)
Capital lease obligations (financing arrangements)
These items appear on the balance sheet but don’t directly support operational revenue generation; they represent financing decisions instead.
How Operating Liabilities Impact Financial Metrics and Analysis
Operating liabilities play a crucial role in several key financial metrics that investors and analysts use to evaluate company performance. Understanding these connections reveals why proper classification matters for data-driven financial analysis.
Net Operating Assets (NOA) and Return on Invested Capital
The primary use of operating liabilities is calculating Net Operating Assets:
NOA = Operating Assets – Operating Liabilities
This metric isolates the capital invested in core operations, excluding financing decisions. It provides a clearer picture of operational efficiency than total assets.
Analysts then calculate Return on Net Operating Assets (RNOA):
RNOA = Operating Income / Net Operating Assets
This ratio measures how effectively a company generates operating profit from its operational capital. Higher RNOA indicates superior operational efficiency.
Example: Company A has an operating income of $500,000 and NOA of $2,500,000:
RNOA = $500,000 / $2,500,000 = 20%
This 20% return means the company generates $0.20 in operating profit for every dollar invested in operations.
Working Capital Management
Operating liabilities directly impact working capital calculations:
Working Capital = Current Assets – Current Liabilities
However, a more refined metric uses operating components:
Operating Working Capital = (Cash + Accounts Receivable + Inventory) – Operating Liabilities
This formula reveals the actual capital required to fund day-to-day operations. Companies with efficient working capital management minimize operating liabilities while maintaining operational capacity.
The current ratio provides additional insight into liquidity, though it includes both operating and financing components.
Cash Conversion Cycle
Operating liabilities influence the cash conversion cycle, which measures how quickly a company converts operational investments into cash:
Cash Conversion Cycle = Days Inventory Outstanding + Days Sales Outstanding – Days Payable Outstanding
Higher operating liabilities (particularly accounts payable) extend the Days Payable Outstanding, which reduces the cash conversion cycle. This is generally favorable because it means the company holds onto cash longer.
Understanding the cash conversion cycle reveals how operating liabilities affect cash flow timing.
Operational Leverage and Risk Assessment
The composition and size of operating liabilities provide insights into operational risk:
High Operating Liabilities relative to assets may indicate:
- Aggressive working capital management
- Strong supplier relationships allow extended payment terms
- Potential liquidity risk if revenues decline
Low Operating Liabilities relative to assets may suggest:
- Conservative financial management
- Less favorable supplier terms
- Excess cash tied up in operations
The degree of operating leverage connects to how fixed operational costs (which create accrued liabilities) amplify profit changes.
Balance Sheet Quality Assessment
Analysts examine operating liabilities to assess balance sheet quality:
Positive indicators:
- Operating liabilities are growing in line with revenue
- Stable payment terms with suppliers
- Predictable accrual patterns
Warning signs:
- Operating liabilities growing faster than revenue (potential cash flow problems)
- Sudden increases in accrued expenses (possible earnings manipulation)
- Declining accounts payable turnover (payment difficulties)
Industry Comparisons and Benchmarking
Operating liabilities enable meaningful comparisons between companies:
Operating Liability Ratio = Operating Liabilities / Total Assets
This ratio varies by industry:
- Retail: 15-25% (high inventory turnover, significant accounts payable)
- Manufacturing: 20-30% (raw materials, accrued labor costs)
- Software: 10-20% (lower physical inventory, deferred revenue)
- Healthcare: 15-25% (medical supplies, accrued salaries)
Comparing a company’s ratios to industry benchmarks reveals relative efficiency in managing operational obligations.
Credit Analysis and Lending Decisions
Lenders evaluate operating liabilities when assessing creditworthiness:
Current Ratio = Current Assets / Current Liabilities
However, sophisticated lenders separate operating from financial liabilities to understand true operational liquidity:
Operating Liquidity = (Cash + Marketable Securities + Accounts Receivable) / Operating Liabilities
This refined metric shows whether a company can meet operational obligations from operational resources, excluding inventory that may be slow to convert to cash.
The quick ratio provides similar insights by excluding inventory from current assets.
Valuation Implications
Operating liabilities affect company valuation in several ways:
- Enterprise Value calculations adjust for operating vs. financial liabilities
- Free Cash Flow projections account for changes in operating liabilities
- Discounted Cash Flow models incorporate working capital requirements driven by operating liabilities
Companies that efficiently manage operating liabilities generate higher free cash flow, increasing intrinsic value.
Real-World Application: Comparative Analysis
Consider two retail companies with identical revenue of $50 million:
Company X:
- Operating Assets: $20 million
- Operating Liabilities: $8 million
- NOA: $12 million
- Operating Income: $3 million
- RNOA: 25%
Company Y:
- Operating Assets: $25 million
- Operating Liabilities: $5 million
- NOA: $20 million
- Operating Income: $3 million
- RNOA: 15%
Despite identical operating income, Company X demonstrates superior operational efficiency with a 25% RNOA versus Company Y’s 15%. Company X achieves this through higher operating liabilities (likely better supplier payment terms) and lower operating assets (efficient inventory management).
This analysis reveals that Company X requires less capital to generate the same profit, making it potentially more attractive to investors.
Understanding these metrics through the lens of operating liabilities provides the data-driven insights necessary for evidence-based investing decisions.
Operating Liabilities in Financial Statements: Where to Find Them
Locating and identifying operating liabilities requires systematic analysis of financial statements, particularly the balance sheet. This section provides a practical guide to finding and classifying these obligations.
Balance Sheet Location and Structure
Operating liabilities appear in the liabilities section of the balance sheet, typically under current liabilities. However, not all current liabilities are operating liabilities; careful examination is required.
Standard Balance Sheet Structure:
Assets
- Current Assets
- Non-Current Assets
Liabilities
- Current Liabilities ← Operating liabilities appear here
- Accounts Payable
- Accrued Expenses
- Accrued Wages
- Taxes Payable
- Deferred Revenue
- Current Portion of Operating Leases
- Non-Current Liabilities
- Long-term Debt ← Not operating liabilities
- Bonds Payable ← Not operating liabilities
- Deferred Tax Liabilities
Equity
- Shareholders’ Equity
Reading the Notes to Financial Statements
The notes to financial statements provide essential details for classifying liabilities:
Note on Accounts Payable typically discloses:
- Total accounts payable balance
- Payment terms with suppliers
- Geographic breakdown
- Related party payables
Note on Accrued Liabilities breaks down accrued expenses:
- Accrued compensation and benefits
- Accrued taxes
- Accrued utilities
- Accrued professional fees
- Other accrued operating expenses
Note on Debt helps identify what to exclude:
- Details of long-term debt
- Short-term borrowings
- Credit facilities
- Interest rates and maturity dates
Practical Classification Checklist
Use this checklist when analyzing a balance sheet:
Include as Operating Liabilities:
- Accounts payable (trade)
- Accrued wages and salaries
- Accrued payroll taxes
- Income taxes payable
- Sales taxes payable
- Accrued utilities
- Accrued rent
- Deferred revenue
- Warranty liabilities
- Customer deposits
- Accrued professional fees
Exclude as Non-Operating (Financial) Liabilities:
- Long-term debt
- Bonds payable
- Notes payable (financing)
- Short-term borrowings
- Current portion of long-term debt
- Dividend payables
- Interest payable on debt
Example: Analyzing a Real Balance Sheet
Consider this simplified balance sheet excerpt:
Current Liabilities:
- Accounts Payable: $3,200,000
- Accrued Compensation: $1,500,000
- Accrued Expenses: $800,000
- Income Taxes Payable: $600,000
- Deferred Revenue: $1,200,000
- Short-term Debt: $2,000,000
- Current Portion of Long-term Debt: $500,000
- Total Current Liabilities: $9,800,000
Classification:
Operating Liabilities = $3,200,000 + $1,500,000 + $800,000 + $600,000 + $1,200,000 = $7,300,000
Non-Operating Liabilities = $2,000,000 + $500,000 = $2,500,000
The operating liabilities of $7.3 million represent 74.5% of total current liabilities, indicating significant operational obligations relative to financing debts.
Cash Flow Statement Connections
The cash flow statement provides additional validation of operating liabilities:
Operating Activities Section shows changes in operating liabilities:
- Increase in accounts payable (source of cash)
- Increase in accrued expenses (source of cash)
- Decrease in deferred revenue (use of cash)
These changes directly impact operating cash flow and help verify the classification of operating liabilities.
Understanding the cash flow statement provides context for how operating liabilities affect cash generation.
Industry-Specific Considerations
Different industries present unique challenges in identifying operating liabilities:
Retail Companies:
- Heavy accounts payable for inventory
- Customer gift card liabilities (deferred revenue)
- Accrued rent for store locations
Manufacturing Companies:
- Accounts payable for raw materials
- Accrued wages for production workers
- Accrued utilities for factory operations
- Warranty reserves
Software/SaaS Companies:
- Deferred revenue from subscriptions (often the largest operating liability)
- Accrued hosting and infrastructure costs
- Accrued sales commissions
Financial Services:
- Customer deposits (operating liability for banks)
- Insurance claims payable
- Premium deposits
Red Flags and Warning Signs
When analyzing operating liabilities, watch for:
Sudden increases disproportionate to revenue growth (potential cash flow problems)
Significant reclassifications between periods (inconsistent accounting)
Unusually high accrued expenses (possible earnings manipulation)
Declining accounts payable with stable revenue (supplier relationship problems)
Growing deferred revenue with declining cash (revenue recognition issues)
Building Your Analysis Framework
Create a systematic approach to analyzing operating liabilities:
Step 1: Extract all current liabilities from the balance sheet
Step 2: Review notes to financial statements for detailed breakdowns
Step 3: Classify each item as operating or financing
Step 4: Calculate total operating liabilities
Step 5: Compare to operating assets to determine NOA
Step 6: Calculate relevant ratios (RNOA, operating liability ratio)
Step 7: Compare to prior periods and industry benchmarks
Step 8: Identify trends and anomalies
This framework ensures consistent, thorough analysis across different companies and time periods.
Understanding balance sheet basics provides the foundation for this analytical process.
Strategic Management of Operating Liabilities
Companies that strategically manage operating liabilities optimize working capital, improve cash flow, and enhance operational efficiency. Understanding these management strategies provides insights into business quality and competitive advantages.
Optimizing Accounts Payable
Smart companies extend payment terms with suppliers while maintaining strong relationships:
Strategy: Negotiate longer payment terms (net-60 or net-90 instead of net-30)
Benefit: Increases operating liabilities, reduces cash conversion cycle, improves cash flow
Risk: Potential supplier relationship strain, lost early payment discounts
Example: A retailer negotiates payment terms from net-30 to net-60 with major suppliers. With $5 million in monthly purchases, this extends $5 million in accounts payable, freeing up cash for 30 additional days.
The math: $5 million × (60-30)/365 = $410,959 in additional average working capital
Dynamic Discounting and Early Payment Programs
Some companies selectively take early payment discounts when financially advantageous:
2/10 Net 30 Terms: 2% discount if paid within 10 days, full amount due in 30 days
Analysis: Taking the discount is equivalent to earning:
(2% / 98%) × (365 / 20) = 37.2% annualized return
This far exceeds typical investment returns, making early payment financially attractive when cash is available.
Managing Accrued Expenses
Strategic timing of expense recognition and payment affects operating liabilities:
Accrual Management Strategies:
- Accurate estimation of period-end accruals
- Consistent accrual policies across periods
- Matching expense recognition with economic reality
Warning: Aggressive accrual manipulation to smooth earnings is both unethical and illegal. Legitimate accrual management focuses on accuracy and consistency.
Deferred Revenue as a Competitive Advantage
Companies with subscription or prepayment models create significant deferred revenue:
Strategic Benefits:
- Predictable cash flow from customer prepayments
- Lower cost of capital (customer financing vs. bank financing)
- Strong customer retention indicator
Example: A SaaS company with $10 million in annual recurring revenue collected upfront creates $10 million in deferred revenue (operating liability) while receiving cash immediately. This cash funds operations without debt financing.
Understanding budgeting fundamentals helps companies plan for managing these operating liabilities effectively.
Working Capital Optimization
Companies optimize working capital by balancing operating assets and liabilities:
Target Operating Working Capital Ratio = (Accounts Receivable + Inventory – Operating Liabilities) / Revenue
Lower ratios indicate more efficient working capital usage.
Improvement Strategies:
- Accelerate collections (reduce accounts receivable)
- Optimize inventory levels (reduce inventory)
- Extend payment terms (increase operating liabilities)
Industry Best Practices
Different industries employ specific operating liability management strategies:
Retail:
- Vendor-managed inventory (reduces inventory, increases accounts payable)
- Consignment arrangements (eliminates inventory, no accounts payable until sale)
Manufacturing:
- Just-in-time inventory (reduces inventory and associated payables)
- Strategic supplier partnerships (favorable payment terms)
Software:
- Annual billing (maximizes deferred revenue)
- Multi-year contracts (creates long-term deferred revenue)
Monitoring and Metrics
Companies track key metrics to manage operating liabilities:
Days Payable Outstanding (DPO) = (Accounts Payable / Cost of Goods Sold) × 365
Higher DPO indicates longer payment periods, which is generally favorable for cash flow.
Operating Liability Turnover = Operating Expenses / Average Operating Liabilities
This ratio shows how many times per year operating liabilities are paid and renewed.
Risk Management Considerations
While extending operating liabilities improves cash flow, it creates risks:
Liquidity Risk: Excessive operating liabilities without corresponding cash or receivables
Supplier Risk: Damaged relationships from slow payment
Operational Risk: Potential supply disruptions if suppliers demand faster payment
Balanced management requires weighing cash flow benefits against these operational risks.
Technology and Automation
Modern companies leverage technology to optimize operating liability management:
- Automated accounts payable systems ensure timely payments and capture discounts
- Cash flow forecasting tools predict operating liability payment timing
- Supplier portals improve communication and relationship management
- Dynamic discounting platforms automatically evaluate early payment opportunities
The Cash Flow Advantage
Effective operating liability management directly impacts cash flow:
Increase in Operating Liabilities = Source of Cash
Decrease in Operating Liabilities = Use of Cash
Companies growing operating liabilities in line with revenue growth generate cash from operations, funding expansion without external financing.
Example: A company increases annual revenue from $50 million to $60 million (+20%). Operating liabilities increase from $8 million to $9.6 million (+20%). The $1.6 million increase in operating liabilities represents cash generated from improved working capital management.
This demonstrates how strategic management of operating liabilities contributes to sustainable growth and financial flexibility—core principles of wealth building through operational excellence.
📊 Operating Liabilities Calculator
Calculate operating liabilities and Net Operating Assets (NOA) for financial analysis
Calculation Results
Formula: Operating Liabilities = Total Liabilities – Non-Operating Liabilities
NOA Formula: Net Operating Assets = Operating Assets – Operating Liabilities
Conclusion: Mastering Operating Liabilities for Financial Success
Operating liabilities represent far more than simple accounting entries on a balance sheet. They are the financial obligations that enable business operations, drive working capital efficiency, and reveal the true operational health of a company.
Understanding operating liabilities provides critical insights for investors, business owners, and financial analysts. By separating operational obligations from financing decisions, you gain a clearer picture of how effectively a company deploys capital in its core business activities.
Key Insights to Remember
Operating liabilities are obligations directly tied to revenue-generating activities—accounts payable, accrued wages, taxes payable, and deferred revenue. They differ fundamentally from financing liabilities like long-term debt and bonds.
The formula for calculating operating liabilities (Total Liabilities – Non-Operating Liabilities) provides the foundation for computing Net Operating Assets, a crucial metric for evaluating operational efficiency and return on invested capital.
Strategic management of operating liabilities creates competitive advantages through improved cash flow, optimized working capital, and reduced financing costs. Companies that master this balance demonstrate superior financial management.
Actionable Next Steps
For Investors:
- Calculate Net Operating Assets (NOA) for companies in your portfolio
- Compare Return on Net Operating Assets (RNOA) across competitors
- Monitor changes in operating liabilities relative to revenue growth
- Identify companies with efficient working capital management
For Business Owners:
- Classify all balance sheet liabilities as operating or financing
- Calculate your operating liability ratio and compare it to industry benchmarks
- Negotiate extended payment terms with key suppliers
- Implement systems to track and optimize Days Payable Outstanding
For Financial Learners:
- Practice identifying operating liabilities in real company financial statements
- Calculate NOA for companies in different industries
- Analyze how operating liabilities impact cash flow statements
- Study the relationship between operating liabilities and working capital
The Math Behind Money in Operating Liabilities
The math is straightforward: Operating Liabilities = Total Liabilities – Non-Operating Liabilities
But the implications are profound. Companies that efficiently manage operating liabilities require less capital to generate revenue, produce higher returns on invested capital, and create more value for shareholders.
This represents a fundamental principle of wealth building: efficiency in capital deployment multiplies returns over time. Just as compound interest multiplies savings, operational efficiency multiplies business value.
Building Financial Literacy Through Evidence-Based Analysis
Operating liabilities exemplify why financial literacy requires more than memorizing definitions—it demands understanding the cause-and-effect relationships that drive business performance.
When you see accounts payable increasing in line with revenue, you recognize efficient supplier relationships and working capital management. When operating liabilities grow faster than revenue, you identify potential cash flow stress requiring investigation.
This analytical framework—grounded in data, driven by logic, and focused on evidence—represents the foundation of sound financial decision-making.
Your Journey Continues
Mastering operating liabilities is one step in understanding how businesses create value and how investors identify quality companies. Continue building your financial knowledge by exploring related concepts like working capital management, financial statement analysis, and valuation principles.
The math behind money becomes clearer with each concept mastered. Operating liabilities reveal the operational efficiency that separates exceptional businesses from mediocre ones—a distinction that matters significantly for long-term wealth building through evidence-based investing.
Start applying these principles today. Review a company’s financial statements, identify its operating liabilities, calculate its Net Operating Assets, and evaluate its operational efficiency. This practical application transforms theoretical knowledge into actionable financial wisdom.
References
[1] Financial Accounting Standards Board (FASB). “Statement of Financial Accounting Concepts No. 6: Elements of Financial Statements.” FASB.org.
[2] Palepu, K.G., Healy, P.M., & Peek, E. “Business Analysis and Valuation: IFRS Edition.” Cengage Learning, 2019.
[3] Penman, S.H “Financial Statement Analysis and Security Valuation.” McGraw-Hill Education, 5th Edition, 2013.
[4] Securities and Exchange Commission (SEC). “Financial Reporting Manual.” SEC.gov.
[5] CFA Institute. “Corporate Finance and Portfolio Management.” CFA Program Curriculum, Level I, 2025.
[6] Damodaran, A. “Investment Valuation: Tools and Techniques for Determining the Value of Any Asset.” Wiley Finance, 3rd Edition, 2012.
[7] International Accounting Standards Board (IASB). “IAS 1: Presentation of Financial Statements.” IFRS.org.
[8] Brigham, E.F. & Ehrhardt, M.C “Financial Management: Theory & Practice.” Cengage Learning, 16th Edition, 2020.
Author Bio
Max Fonji is the founder of The Rich Guy Math, a data-driven financial education platform that explains the math behind money with precision and authority. With a background in financial analysis and a passion for evidence-based investing, Max translates complex financial concepts into clear, actionable insights for beginner to intermediate investors. His analytical approach combines rigorous quantitative methods with accessible teaching, empowering readers to make informed financial decisions based on logic, data, and proven principles.
Educational Disclaimer
This article is provided for educational and informational purposes only and does not constitute financial, investment, accounting, or legal advice. The content represents general information about operating liabilities and financial analysis concepts and should not be relied upon as the sole basis for financial decisions.
Financial situations vary significantly based on individual circumstances, industry factors, and economic conditions. Before making any financial or investment decisions, consult with qualified professionals, including certified public accountants (CPAs), financial advisors, or other appropriate experts who can evaluate your specific situation.
The Rich Guy Math and its authors make no representations or warranties regarding the accuracy, completeness, or timeliness of the information presented. Financial markets, accounting standards, and business conditions change continuously, and information that is accurate today may become outdated.
Past performance does not guarantee future results. All investments and business decisions carry risk, including the potential loss of principal. Readers are solely responsible for their own financial decisions and outcomes.
Frequently Asked Questions (FAQ)
What is the difference between operating liabilities and current liabilities?
Current liabilities include all obligations due within one year, regardless of their purpose. Operating liabilities are a subset of current liabilities that specifically support core business operations. Current liabilities include both operating items (accounts payable, accrued wages) and financing items (short-term debt, current portion of long-term debt), while operating liabilities exclude all financing-related obligations.
How do you calculate operating liabilities from a balance sheet?
To calculate operating liabilities, subtract non-operating liabilities from total liabilities: Operating Liabilities = Total Liabilities – (Long-term Debt + Short-term Borrowings + Bonds Payable + Other Financial Liabilities). Alternatively, directly sum operational obligations: Operating Liabilities = Accounts Payable + Accrued Wages + Taxes Payable + Accrued Expenses + Deferred Revenue + Other Operating Obligations.
Are accounts payable always considered operating liabilities?
Yes, accounts payable to suppliers for goods and services used in core operations are always classified as operating liabilities. However, if a company has accounts payable to related parties for financing transactions or non-operational purposes, those specific payables would be excluded. Standard trade accounts payable represent obligations to suppliers and are definitively operating liabilities.
What is Net Operating Assets (NOA) and why does it matter?
Net Operating Assets (NOA) equals Operating Assets minus Operating Liabilities. It represents the net capital invested in a company’s core operations, excluding financing decisions. NOA matters because it enables calculation of Return on Net Operating Assets (RNOA), which measures operational efficiency independent of capital structure. This provides clearer insights into business performance than total assets or equity-based metrics.
Can a company have negative operating liabilities?
No, a company cannot have negative operating liabilities. Operating liabilities represent actual obligations owed to suppliers, employees, tax authorities, and customers (deferred revenue). These are real debts that must be positive values. If your calculation produces negative operating liabilities, you’ve likely misclassified items or made an arithmetic error. Review your classification of operating versus non-operating liabilities.
How do operating liabilities affect cash flow?
Increases in operating liabilities generate cash flow because the company receives goods or services but delays payment. Decreases in operating liabilities use cash because the company pays down obligations. On the cash flow statement, an increase in accounts payable or accrued expenses appears as a positive adjustment to operating cash flow, while decreases appear as negative adjustments.
What’s the ideal ratio of operating liabilities to total assets?
The ideal ratio varies significantly by industry. Retail companies typically have higher ratios (15–25%) due to inventory purchased on credit. Manufacturing companies range from 20–30%. Software companies often have lower ratios (10–20%) but higher deferred revenue. Compare a company’s ratio to industry peers rather than using absolute benchmarks. Consistent ratios aligned with revenue growth indicate healthy working capital management.
Is deferred revenue really a liability?
Yes, deferred revenue is a genuine operating liability. When customers pay in advance for products or services not yet delivered, the company has an obligation to either deliver the promised goods/services or refund the payment. This represents a real liability on the balance sheet. As the company delivers the product or service over time, it recognizes revenue and reduces the deferred revenue liability.
Related posts:
 What Is the 3x Rent Rule & How to Calculate It (With Examples)
 Portfolio Income: Definition, Examples, Tax Rules, and Strategies
 Bookkeeping vs Accounting: What’s the Difference & Which Do You Need?
 What Is Profitability Analysis & How to Do It: Metrics, Example & Tips
 Emergency Fund vs Savings: What’s the Real Difference and Why It Matters
 Debt Service Coverage Ratio (DSCR): Formula, Meaning & Examples