Imagine you’re running a lemonade stand. You’ve sold $500 worth of lemonade this month, spent $200 on lemons, sugar, and cups, and paid your little brother $50 to help you squeeze lemons. Before you celebrate your success, you need to answer one crucial question: How much money did you actually make from running your lemonade business?
This is where operating profit comes in, and it’s not just for lemonade stands. Whether you’re analyzing stocks for dividend investing or trying to understand why some companies thrive while others struggle, operating profit is one of the most important metrics you’ll ever learn.
Operating profit tells you how much money a business makes from its core operations, before accounting for things like taxes and interest payments. It’s the financial heartbeat of any company, revealing whether the business model actually works or if the company is just burning cash. SEC
In this guide, we’ll break down everything you need to know about operating profit, from the basic definition to real-world examples that make it crystal clear. By the end, you’ll be able to analyze any company’s financial health like a seasoned investor.
Key Takeaways
- Operating profit measures how much money a company earns from its core business operations, excluding taxes and interest expenses
- The formula is simple: Operating Profit = Revenue – Operating Expenses (COGS + Operating Expenses)
- Operating profit margin shows efficiency: higher margins typically indicate better-managed companies
- Unlike net profit, operating profit focuses solely on business performance, not financing decisions or tax situations
- Analyzing operating profit helps investors identify truly profitable businesses versus those masking problems with financial engineering
What Is Operating Profit?
Operating profit is the amount of money a company earns from its regular business activities after subtracting all operating expenses, but before deducting interest and taxes. Think of it as the “pure” profit from what the company actually does, whether that’s selling smartphones, brewing coffee, or providing cloud computing services. Investopedia
Here’s why this matters: A company might show a healthy net profit on paper, but if that profit comes from selling off assets or one-time tax breaks rather than actual business operations, it’s not sustainable. Operating profit cuts through the noise and shows you the real story.
Why Operating Profit Matters More Than You Think
When legendary investor Warren Buffett evaluates companies, he doesn’t just look at the bottom line. He wants to know: Can this business generate consistent profits from what it does best?
Operating profit answers that question. It tells you:
Whether the company’s core business model is profitable
How efficiently does management run operations
If the company can sustain profits without financial tricks
How the business performs compared to competitors
For anyone interested in building passive income through investing, understanding operating profit is essential. Companies with strong, growing operating profits are more likely to pay reliable dividends and increase shareholder value over time.
The Operating Profit Formula
Let’s break down the formula step by step. Don’t worry, there’s no advanced math required!
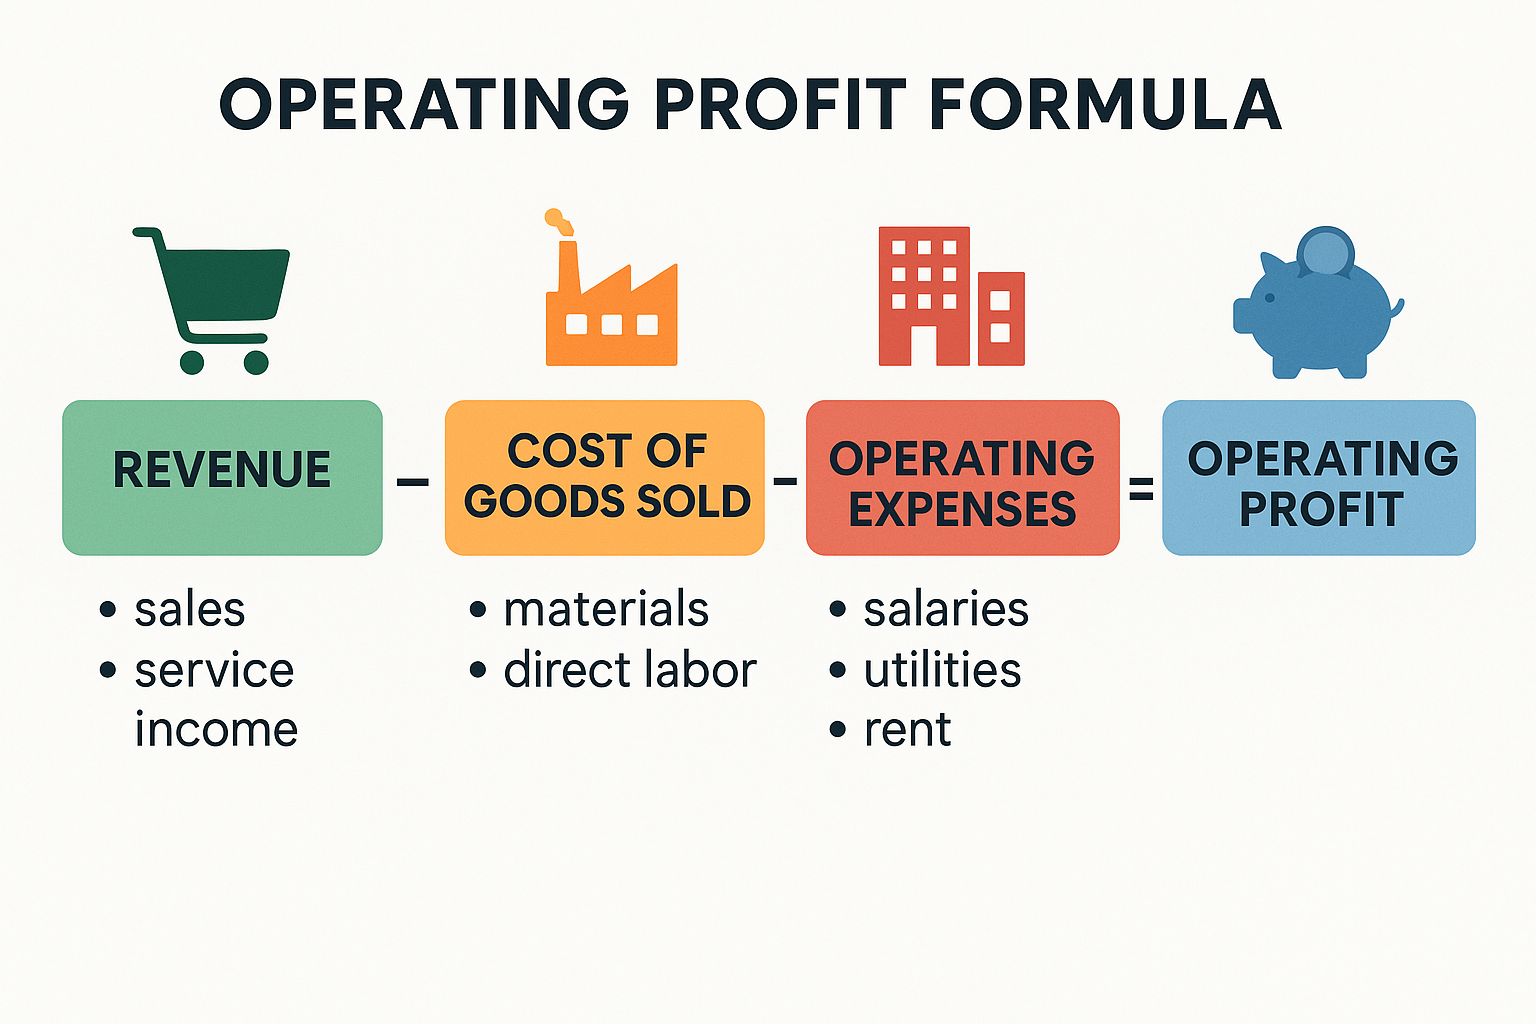
Basic Formula
Operating Profit = Revenue - Cost of Goods Sold (COGS) - Operating ExpensesOr, expressed another way:
Operating Profit = Gross Profit - Operating ExpensesUnderstanding Each Component
| Component | What It Means | Example (Coffee Shop) |
|---|---|---|
| Revenue | Total money from sales | $100,000 from coffee sales |
| COGS | Direct costs to make products | $30,000 for coffee beans, milk, cups |
| Gross Profit | Revenue minus COGS | $70,000 |
| Operating Expenses | Costs to run the business | $45,000 (rent, wages, utilities, marketing) |
| Operating Profit | What’s left after operating costs | $25,000 |
Real-World Example: Coffee Shop
Let’s say Sarah owns a coffee shop called “Bean There, Done That.” Here’s her monthly breakdown:
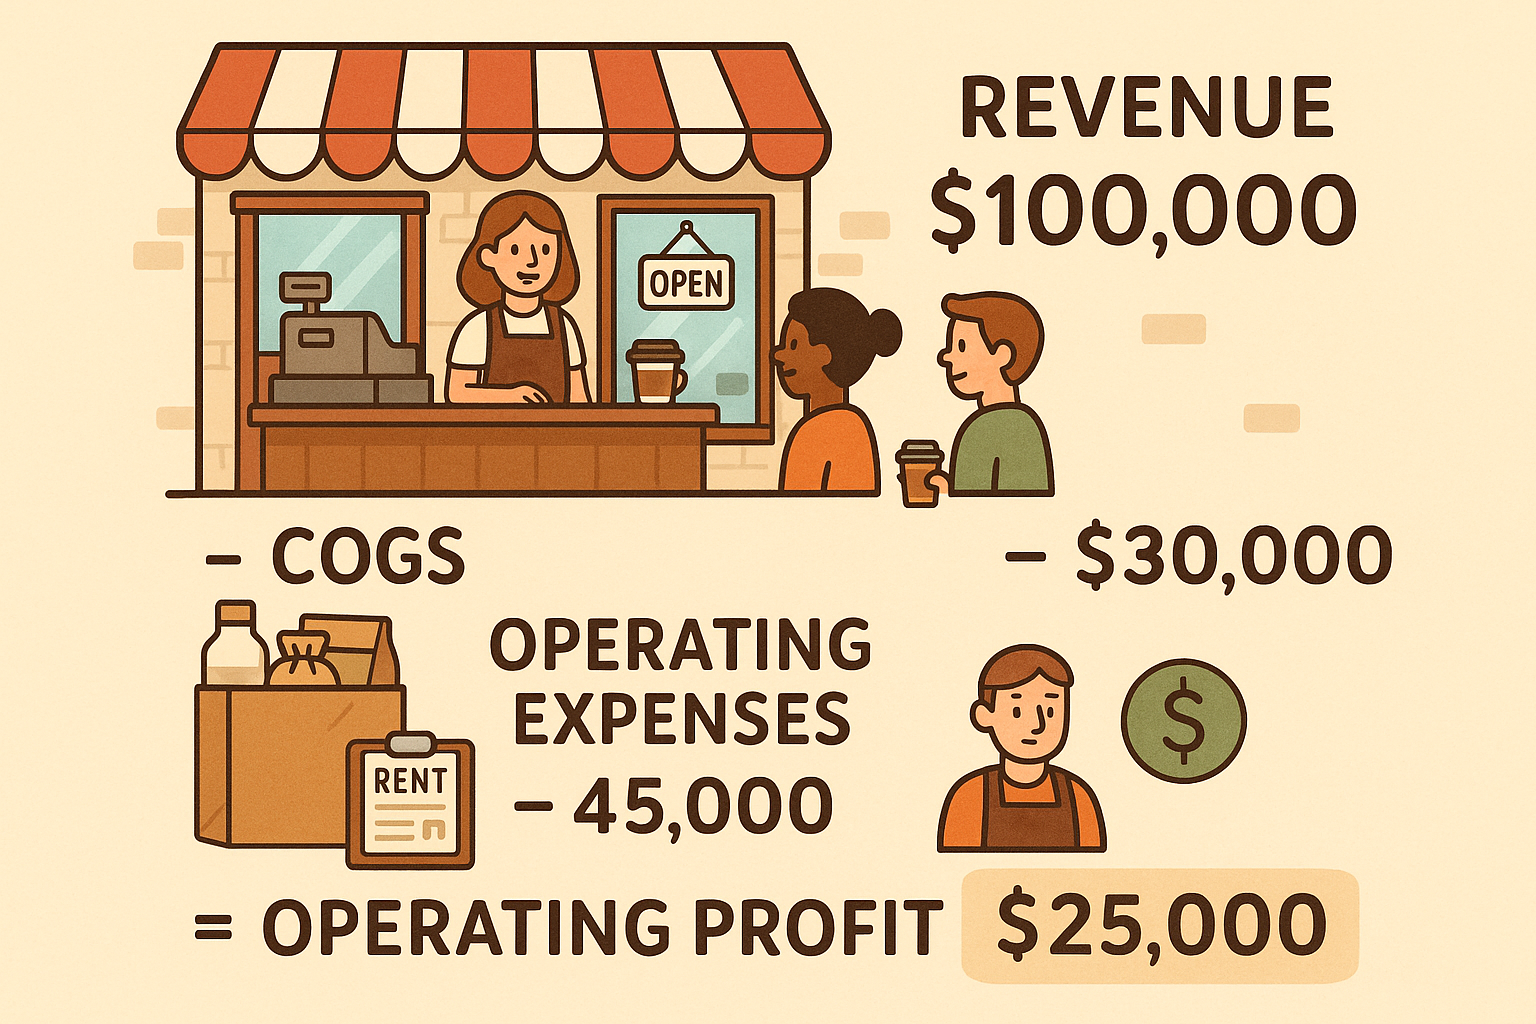
Revenue (Sales): $100,000
Cost of Goods Sold:
- Coffee beans: $15,000
- Milk and syrups: $8,000
- Cups, lids, and supplies: $7,000
- Total COGS: $30,000
Gross Profit: $100,000 – $30,000 = $70,000
Operating Expenses:
- Rent: $12,000
- Employee wages: $25,000
- Utilities: $3,000
- Marketing: $4,000
- Equipment maintenance: $1,000
- Total Operating Expenses: $45,000
Operating Profit: $70,000 – $45,000 = $25,000
This means Sarah’s coffee shop generates $25,000 per month from its core business operations. That’s a solid 25% operating profit margin ($25,000 ÷ $100,000), which is excellent for a coffee shop!
Operating Profit vs Other Profit Metrics
Many beginners get confused by all the different “profits” on an income statement. Let’s clear that up with a simple comparison:
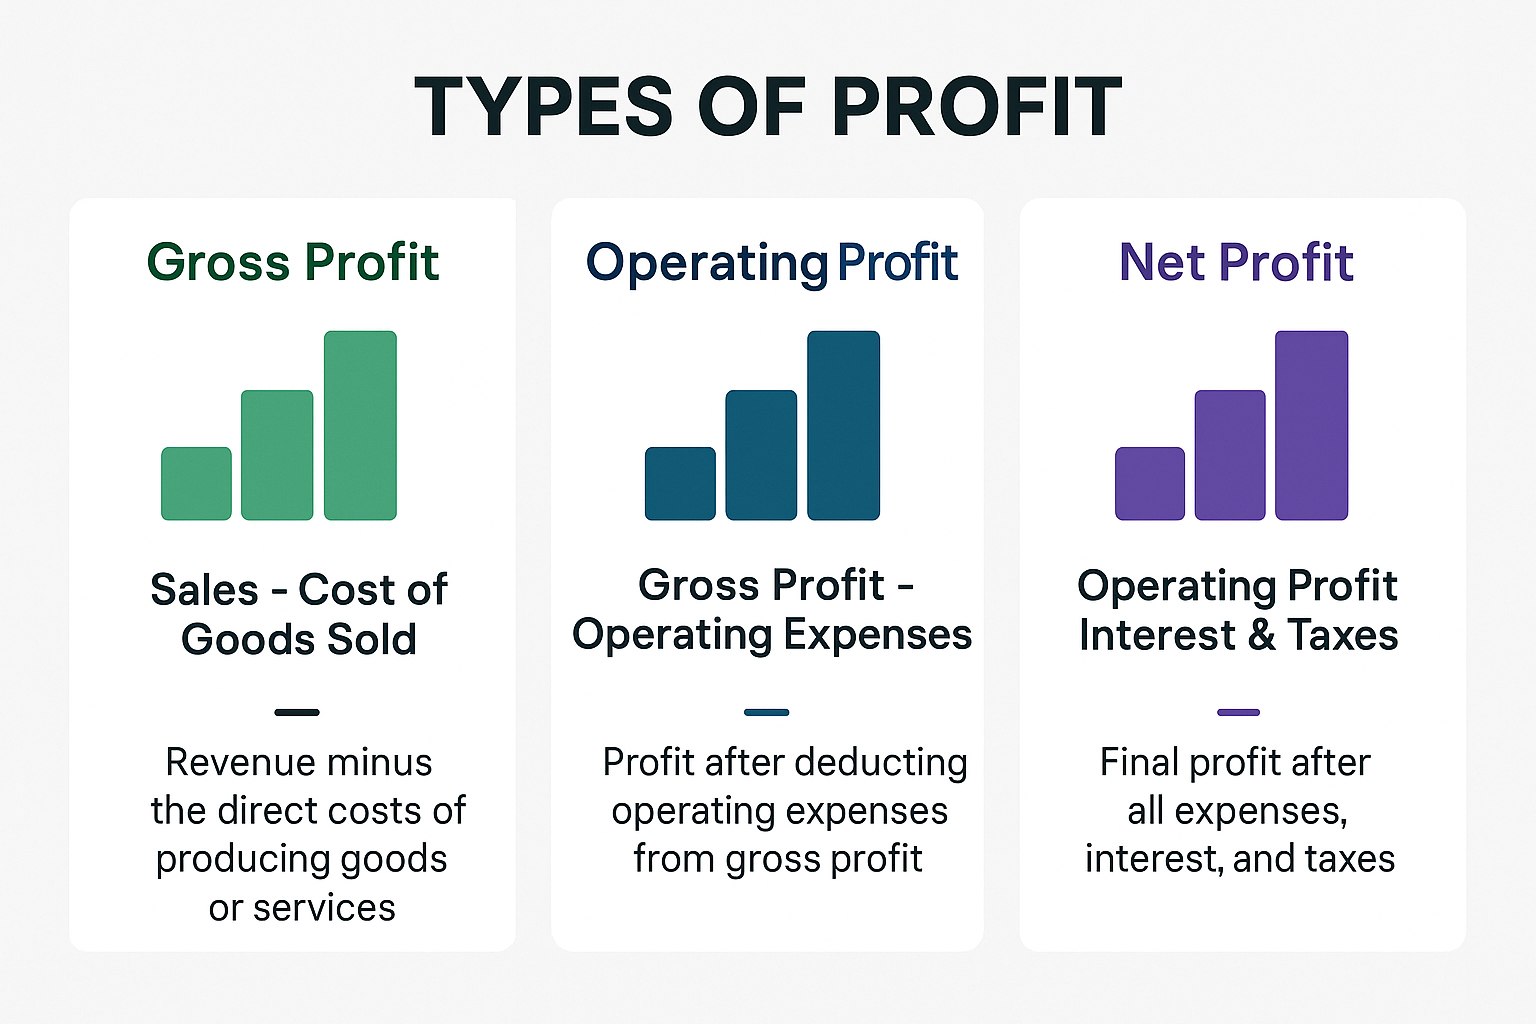
The Profit Hierarchy
Think of profit metrics as layers of an onion, with each layer revealing something different:
1. Gross Profit (Outermost Layer)
- Revenue minus COGS
- Shows if you can sell products for more than they cost to make
- Doesn’t include operating expenses
2. Operating Profit (Middle Layer)
- Gross profit minus operating expenses
- Shows if the business model actually works
- Excludes interest and taxes
3. Net Profit (Core)
- Operating profit minus interest, taxes, and other non-operating items
- The final “bottom line”
- What shareholders actually get to keep
Operating Profit vs EBIT vs EBITDA
You might also hear these terms thrown around:
EBIT (Earnings Before Interest and Taxes)
- Essentially the same as operating profit in most cases
- Sometimes includes non-operating income (like investment gains)
EBITDA (Earnings Before Interest, Taxes, Depreciation, and Amortization)
- Operating profit PLUS depreciation and amortization
- Shows cash generation potential
- Popular in industries with heavy equipment investments
Quick Tip: For most beginner investors, operating profit and EBIT are interchangeable. Focus on understanding operating profit first, and you’ll naturally grasp the others.
How to Calculate Operating Profit (Step-by-Step)
Let’s walk through a complete example using a fictional company’s income statement. We’ll use “TechGadget Inc.,” a company that makes smartphone accessories.
Step 1: Find the Revenue
Look at the top line of the income statement:
Total Revenue: $5,000,000
Step 2: Identify Cost of Goods Sold (COGS)
These are direct costs to manufacture products:
- Raw materials: $1,200,000
- Manufacturing labor: $800,000
- Factory overhead: $300,000
- Total COGS: $2,300,000
Step 3: Calculate Gross Profit
Gross Profit = Revenue - COGS
Gross Profit = $5,000,000 - $2,300,000
Gross Profit = $2,700,000
Step 4: List Operating Expenses
These are costs to run the business (not make products):
- Sales and marketing: $800,000
- Research and development: $400,000
- Administrative salaries: $350,000
- Rent and utilities: $200,000
- Insurance and legal: $100,000
- Other operating costs: $150,000
- Total Operating Expenses: $2,000,000
Step 5: Calculate Operating Profit
Operating Profit = Gross Profit - Operating Expenses
Operating Profit = $2,700,000 - $2,000,000
Operating Profit = $700,000
TechGadget Inc.’s operating profit is $700,000, which represents a 14% operating profit margin ($700,000 ÷ $5,000,000). This tells us that for every dollar of sales, the company keeps 14 cents from operations.
Operating Profit Margin: The Efficiency Metric
Knowing the operating profit dollar amount is useful, but the operating profit margin is even more powerful because it allows you to compare companies of different sizes.
The Formula
Operating Profit Margin = (Operating Profit ÷ Revenue) × 100What’s a “Good” Operating Profit Margin?
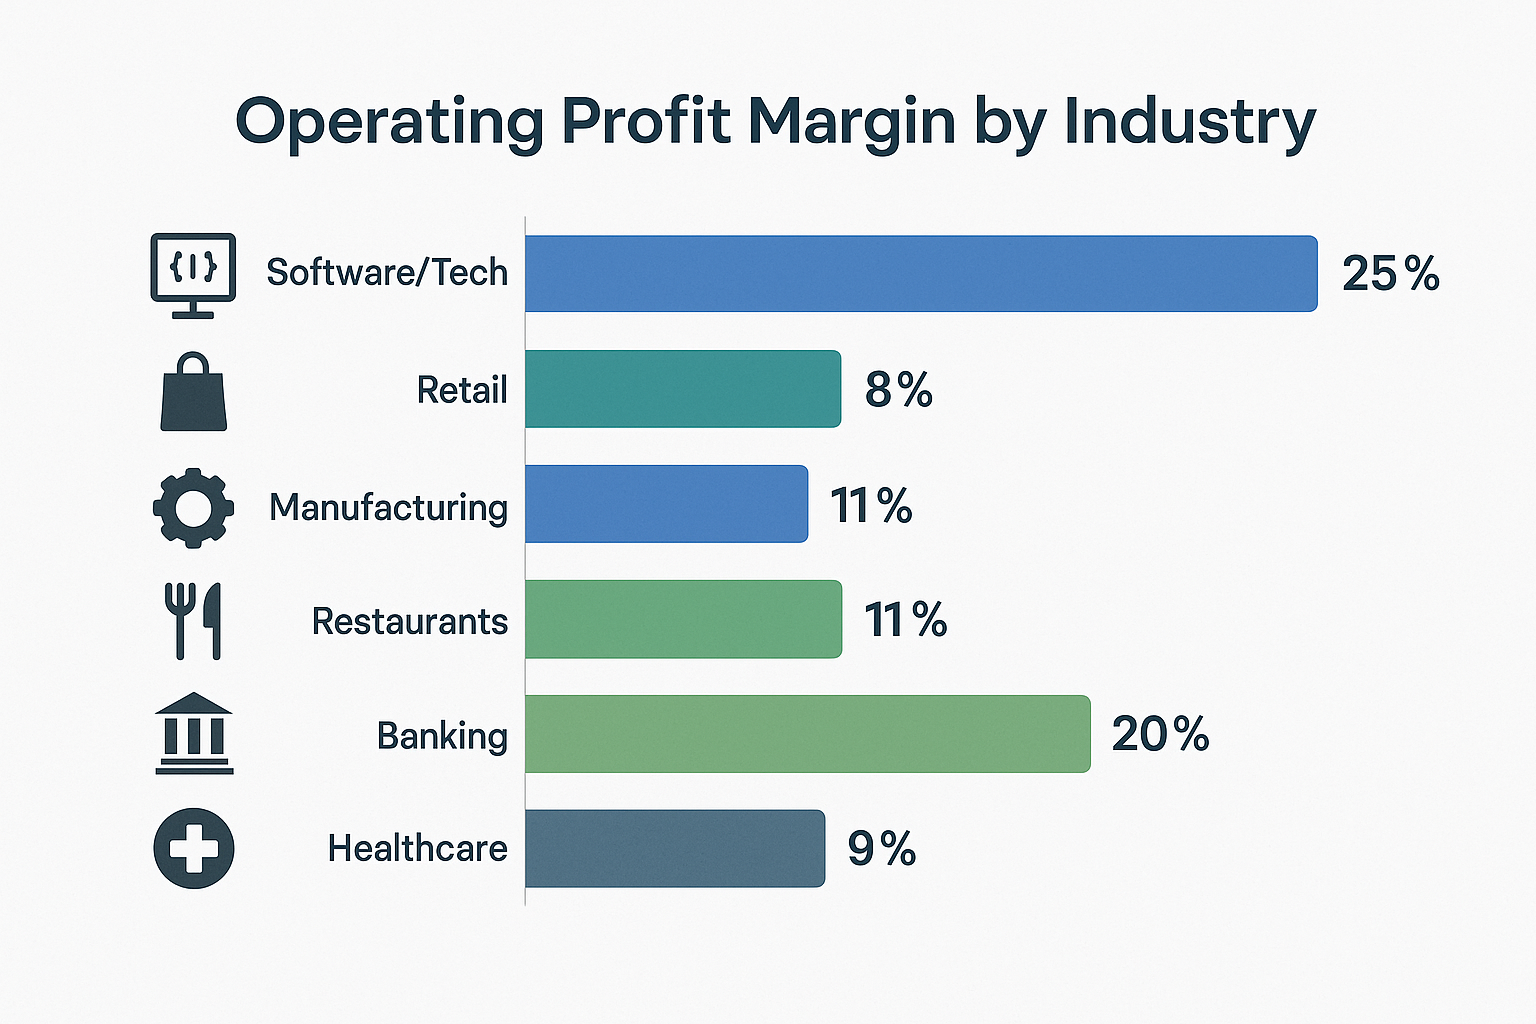
This varies dramatically by industry:
| Industry | Typical Operating Margin | Why? |
|---|---|---|
| Software/Tech | 20-40% | Low COGS, high scalability |
| Retail | 2-10% | Thin margins, high competition |
| Manufacturing | 8-15% | Moderate costs, capital intensive |
| Restaurants | 5-15% | High labor and food costs |
| Banking | 25-40% | Service-based, low COGS |
Real Example: Apple vs Walmart
Apple (2024 Fiscal Year):
- Operating Profit Margin: ~30%
- Why so high? Premium pricing, brand loyalty, and efficient supply chain
Walmart (2024 Fiscal Year):
- Operating Profit Margin: ~4%
- Why so low? Razor-thin retail margins, volume-based business model
Both are successful companies, but their business models are completely different. Apple focuses on high margins and premium products, while Walmart succeeds through massive volume and operational efficiency.
Understanding these differences helps when evaluating stocks in the market; you can’t compare a tech company’s margins to a retailer’s margins and draw meaningful conclusions.
Why Investors Love Operating Profit
When seasoned investors analyze potential investments, operating profit sits at the heart of their analysis. Here’s why:
1. It Reveals Business Quality
A company with consistently strong operating profit has a business model that works. It’s not relying on accounting tricks, asset sales, or tax loopholes to show profits.
2. It’s Harder to Manipulate
While companies can use various accounting methods to boost net profit, operating profit is more straightforward. It’s based on actual business performance.
3. It Shows Management Effectiveness
Good management teams maximize operating profit by:
- Controlling costs without sacrificing quality
- Pricing products appropriately
- Operating efficiently
- Making smart operational decisions
4. It Predicts Future Performance
Companies with growing operating profits usually have sustainable competitive advantages. This is exactly what you want when building a dividend portfolio or seeking long-term growth.
The Story of Two Companies
Let me share a quick story that illustrates why operating profit matters:
Company A reports $10 million in net profit. Impressive, right? But when you dig deeper, you discover:
- Operating profit: $2 million
- One-time asset sale: $12 million
- Interest and tax benefits: $1 million
- Actual operating loss: -$5 million
Company B also reports $10 million in net profit, but:
- Operating profit: $12 million
- Interest expense: -$1 million
- Taxes: -$1 million
Which company would you invest in? Company B, obviously! Its core business is profitable and sustainable. Company A is masking serious operational problems with one-time gains.
This is why understanding why people lose money in the stock market often comes down to not understanding the difference between real profitability and accounting illusions.
Analyzing Operating Profit: What to Look For
When you’re reviewing a company’s operating profit, here are the key questions to ask:
1. Is Operating Profit Growing?
Look at the trend over 3-5 years:
- Growing: Excellent sign of business health
- Stable: Acceptable for mature companies
- Declining: Red flag requiring investigation
2. Is Operating Margin Improving?
Even if absolute operating profit is growing, check if the margin is improving:
- Improving margin: The Company is becoming more efficient
- Stable margin with revenue growth: Healthy scaling
- Declining margin: Costs are growing faster than revenue (warning sign)
3. How Does It Compare to Competitors?
A company with a 10% operating margin might seem healthy until you discover competitors average 20%. Industry comparison is crucial.
4. What’s Driving the Numbers?
Dig into the components:
- Is revenue growing, or are they just cutting costs?
- Are operating expenses being managed wisely or dangerously slashed?
- Is gross margin healthy (indicating pricing power)?
5. Is It Consistent?
Wild swings in operating profit suggest:
- Unstable business model
- Cyclical industry (which isn’t necessarily bad, but requires different analysis)
- Management issues
Operating Profit in Action: Real Company Examples
Let’s look at how operating profit analysis works with actual companies (using simplified numbers for clarity):
Example 1: Amazon (E-commerce & Cloud)
Amazon is fascinating because it operates two very different businesses:
Amazon Web Services (AWS):
- High operating margins (30%+)
- Highly profitable
- Funds expansion in other areas
Retail Operations:
- Low operating margins (2-5%)
- Volume-based business
- Invests heavily in infrastructure
Amazon’s overall operating profit might seem modest, but when you understand the mix, you realize AWS is a cash-generating machine subsidizing retail growth. This is why understanding market dynamics requires looking beyond surface numbers.
Example 2: McDonald’s (Franchise Model)
McDonald’s operating profit margins are surprisingly high (40%+) for a restaurant company. Why?
- Most locations are franchised
- McDonald’s collects royalties and rent
- Low direct operating costs
- Highly efficient operations
This franchise model creates predictable, high-margin operating profit—perfect for generating the cash needed to pay dividends to shareholders.
Example 3: Tesla (Manufacturing Evolution)
Tesla’s operating profit journey tells a growth story:
- 2018: Negative or barely positive operating profit
- 2020: Achieved consistent positive operating profit
- 2022-2024: Operating margins reached 15%+
This progression showed Tesla transitioning from a startup burning cash to a mature automaker with a profitable business model. Investors who understood this operating profit trajectory made significant returns.
Common Mistakes When Analyzing Operating Profit
Even experienced investors sometimes stumble. Here are pitfalls to avoid:
1: Ignoring One-Time Items
Some companies include one-time gains in operating profit. Always check the footnotes and look for “adjusted operating profit” or “recurring operating profit.”
2: Not Considering Industry Context
A 5% operating margin might be excellent for a grocery store but terrible for a software company. Always compare within the same industry.
3: Focusing Only on the Current Quarter
Operating profit can fluctuate seasonally. Look at:
- Year-over-year comparisons
- Trailing twelve months (TTM)
- Multi-year trends
4: Forgetting About Capital Requirements
High operating profit doesn’t always mean great cash flow if the company needs massive capital expenditures to maintain operations. (This is why EBITDA is sometimes more useful for capital-intensive businesses.)
5: Overlooking Operating Leverage
Companies with high fixed costs can see operating profit swing dramatically with small revenue changes. Understanding operating leverage is crucial for cyclical businesses.
How to Use Operating Profit in Your Investment Decisions
Now that you understand operating profit, here’s how to put this knowledge to work:
For Stock Analysis
When evaluating a potential investment:
- Check the trend: Is operating profit growing consistently?
- Calculate the margin: Compare it to industry peers
- Assess quality: Is profit from core operations or one-time events?
- Project forward: Can the company maintain or improve these metrics?
This analysis is especially important when deciding whether to invest in individual stocks.
For Portfolio Construction
Companies with strong operating profits often make excellent core holdings:
- Dividend stocks: Strong operating profit supports dividend payments
- Growth stocks: Growing operating profit signals a scalable business model
- Defensive holdings: Stable operating profit weathers economic storms
For Risk Management
Operating profit helps you spot problems early:
- Declining operating profit while revenue grows = margin compression (bad)
- Negative operating profit = business model issues (very bad)
- Volatile operating profit = unpredictable business (risky)
Understanding these warning signs helps you avoid the emotional cycle of market losses by making data-driven decisions.
Operating Profit and Business Valuation
Operating profit plays a crucial role in valuing companies. Here’s how:
EV/EBIT Multiple
Enterprise Value to EBIT (operating profit) is a popular valuation metric:
EV/EBIT = Enterprise Value ÷ Operating ProfitThis ratio helps you determine if a stock is cheap or expensive relative to its operating earnings.
Comparable Company Analysis
When comparing similar companies, operating profit multiples provide apples-to-apples comparisons:
- Lower multiple: Potentially undervalued (or facing problems)
- Higher multiple: Market expects growth (or overvalued)
- Industry average: Fairly valued
DCF Models
Sophisticated investors use Discounted Cash Flow (DCF) models that start with operating profit projections to estimate a company’s intrinsic value.
Operating Profit Across Different Business Models
Different business models generate operating profit in unique ways:
Subscription Businesses (SaaS)
- High initial customer acquisition costs
- Low marginal cost per customer
- Operating profit grows as customer base scales
- Example: Netflix, Spotify
Marketplace Platforms
- Low COGS (they don’t own inventory)
- Operating expenses mainly in tech and marketing
- High operating margins at scale
- Example: Airbnb, Etsy
Traditional Retail
- High COGS (buying inventory)
- Significant operating expenses (stores, staff)
- Lower operating margins
- Success depends on volume and efficiency
- Example: Target, Costco
Manufacturing
- Moderate to high COGS
- Significant operating expenses (facilities, labor)
- Operating profit is sensitive to capacity utilization
- Example: Ford, Boeing
Understanding these patterns helps you set realistic expectations when analyzing different types of companies in your investment portfolio.
Advanced Operating Profit Concepts
Once you’ve mastered the basics, these advanced concepts will deepen your analysis:
Operating Leverage
Operating leverage measures how sensitive operating profit is to revenue changes:
- High operating leverage: Fixed costs dominate; small revenue changes create big profit swings
- Low operating leverage: Variable costs dominate; profit changes proportionally with revenue
Example: Airlines have high operating leverage. Whether a plane carries 50 or 200 passengers, fuel and crew costs are similar. Adding passengers dramatically increases operating profit.
Contribution Margin
This shows how much each additional sale contributes to operating profit:
Contribution Margin = (Revenue - Variable Costs) ÷ RevenueHigher contribution margins mean faster operating profit growth as sales increase.
Break-Even Analysis
Operating profit helps calculate the break-even point:
Break-Even Revenue = Fixed Operating Costs ÷ Contribution MarginThis tells you how much revenue a company needs to achieve positive operating profit.
Improving Operating Profit: Management Strategies
Understanding how companies improve operating profit makes you a better analyst:
Revenue-Side Strategies
- Increase prices (if demand allows)
- Sell more units (volume growth)
- Improve product mix (sell more high-margin items)
- Expand into new markets
Cost-Side Strategies
- Negotiate better supplier terms (reduce COGS)
- Improve operational efficiency (reduce waste)
- Automate processes (lower labor costs)
- Optimize marketing spend (better ROI)
The Amazon Playbook
Amazon famously prioritized growth over operating profit for years, then flipped the switch:
- Built massive scale and infrastructure
- Achieved purchasing power and efficiency
- Leveraged fixed costs across growing revenue
- Result: Operating margins expanded dramatically
This long-term thinking is one reason smart investors study operating profit trends, not just current numbers.
Operating Profit Red Flags
Watch for these warning signs:
1. Declining Operating Profit Despite Revenue Growth
This means costs are growing faster than sales, a serious problem indicating:
- Loss of pricing power
- Inefficient scaling
- Management issues
2. Operating Profit Volatility
Wild swings suggest:
- Unstable business model
- Poor cost management
- Cyclical industry (not always bad, but requires a different approach)
3. Negative Operating Profit,
If a company can’t generate operating profit, it has fundamental business model problems. Occasional quarters are acceptable for seasonal businesses, but chronic negative operating profit is a massive red flag.
4. Operating Margin Compression
When operating margins shrink over time:
- Competition is intensifying
- The company is losing its competitive advantage
- Costs are out of control
5. Divergence Between Operating and Net Profit
If net profit looks great but operating profit is weak, investigate:
- One-time gains masking operational problems
- Unsustainable tax benefits
- Financial engineering
💰 Operating Profit Calculator
Calculate your company’s operating profit and margin instantly
Practical Tips for Beginners
As you start using operating profit analysis, keep these tips in mind:
1. Start Simple
Don’t try to analyze 50 metrics at once. Master operating profit and operating margin first, then expand your toolkit.
2. Build a Spreadsheet
Track operating profit for companies you’re interested in:
- Current quarter
- Same quarter last year
- Trailing twelve months
- 3-year trend
This creates a powerful reference database.
3. Read the Footnotes
Company financial statements include footnotes explaining unusual items. Read them! They reveal whether operating profit includes one-time events.
4. Compare Apples to Apples
Only compare companies in the same industry. A software company’s 30% margin isn’t “better” than a grocery store’s 3% margin; they’re different business models.
5. Think Long-Term
One quarter doesn’t make a trend. Look for consistent patterns over multiple years before concluding.
FAQ
Operating profit focuses solely on business operations, while net profit includes everything, interest, taxes, one-time gains/losses, and other non-operating items. Operating profit shows if the core business is healthy; net profit shows what shareholders actually keep.
Absolutely! This happens when:
High interest expenses (heavy debt)
Large tax bills
One-time losses (lawsuits, asset write-downs)
Restructuring charges
This scenario often indicates a fundamentally sound business with temporary financial challenges.
Generally, yes, but context matters:
A company investing heavily in growth might temporarily sacrifice operating profit
Comparing across industries isn’t meaningful (tech vs. retail)
Quality matters more than quantity (sustainable vs. one-time boost)
For active investors:
Quarterly: When earnings are released
Annually: For comprehensive analysis
Before buying/selling: Always check recent trends
For long-term investors, annual reviews are usually sufficient unless major news breaks.
All public companies must file detailed financial statements showing revenue, COGS, and operating expenses, everything you need to calculate operating profit yourself. Sometimes it’s called “operating income” or “income from operations.”
Conclusion: Your Operating Profit Mastery Journey
Congratulations! You’ve just completed a comprehensive deep dive into one of the most important financial metrics in investing. Let’s recap what you’ve learned:
✅ Operating profit reveals whether a company’s core business is actually profitable
✅ The formula (Revenue – COGS – Operating Expenses) is simple but powerful
✅ Operating profit margin allows meaningful comparisons across companies
✅ Strong, growing operating profit indicates a sustainable competitive advantage
✅ Industry context is crucial; margins vary dramatically by business model
Your Next Steps
Immediate Actions:
- Practice with real companies: Pick three companies in different industries and calculate their operating profit margins using their latest quarterly reports
- Build a watchlist: Identify 5-10 companies with strong, growing operating profits in industries you understand
- Create a tracking system: Use the spreadsheet tip mentioned earlier to monitor trends
Ongoing Development:
- Read quarterly earnings reports, focusing on the operating profit section
- Follow smart investment strategies that incorporate fundamental analysis
- Learn complementary metrics like free cash flow and return on invested capital
- Stay informed about market dynamics that affect operating profits
The Bigger Picture
Understanding operating profit isn’t just about numbers on a spreadsheet; it’s about developing the analytical mindset that separates successful long-term investors from those who chase hot tips and lose money.
When you can look at a company’s financial statements and quickly assess whether the business model works, whether management is executing well, and whether the stock price makes sense relative to operating performance, you’ve developed a superpower that will serve you for decades.
Remember Sarah’s coffee shop from our earlier example? That same analytical framework applies whether you’re evaluating a neighborhood business or a Fortune 500 company. The principles are universal.
As you continue your investing journey, operating profit analysis will become second nature. You’ll instinctively look for it in financial reports, compare it across competitors, and use it to spot opportunities others miss.
The path to financial independence through investing isn’t about finding secret formulas or timing the market perfectly. It’s about understanding businesses, recognizing value, and making informed decisions based on solid fundamentals.
Operating profit is one of those fundamentals. Master it, and you’re well on your way to becoming a confident, capable investor who makes decisions based on data, not emotion.
Now get out there and start analyzing! Your future self will thank you for developing this crucial skill today.
Disclaimer
The information provided in this article is for educational purposes only and should not be considered financial advice. Always consult with a qualified financial advisor before making investment decisions. Past performance does not guarantee future results. Investing involves risk, including the potential loss of principal.
About the Author
Max Fonji is a financial educator and investment analyst with over 15 years of experience helping beginners navigate the complex world of investing. He specializes in breaking down sophisticated financial concepts into clear, actionable insights that anyone can understand and apply. Max is passionate about financial literacy and believes that understanding fundamentals like operating profit is the foundation of successful long-term investing.
Through TheRichGuyMath.com, Max has helped thousands of readers build confidence in their investment decisions and achieve their financial goals. When he’s not analyzing financial statements, you can find him enjoying coffee (while calculating the shop’s operating margin) or teaching his kids about money management.
Related posts:
 What Is SmartPass? Raptor Digital Hall Pass Explained for K-12 Schools
 What Is the 3x Rent Rule & How to Calculate It (With Examples)
 Portfolio Income: Definition, Examples, Tax Rules, and Strategies
 Bookkeeping vs Accounting: What’s the Difference & Which Do You Need?
 Return on Assets (ROA): Definition, Formula & How to Improve It
 How to Save Money Fast: A Smart Savings Plan That Actually Works