Imagine walking into a bustling coffee shop where every espresso machine is humming and customers are lined up out the door. The owner proudly announces they made $100,000 in revenue last month. Impressive, right? But here’s the catch: after paying for coffee beans, milk, rent, baristas, and utilities, they only kept $5,000. Meanwhile, a quieter shop down the street made $50,000 in revenue but kept $15,000 after their operating expenses. (Operating profit margin)
Which business would you rather own?
This is exactly why operating profit margin matters. Revenue tells you how much money flows through a business, but operating profit margin reveals how efficiently that business converts sales into actual profit. Whether you’re evaluating stocks in the stock market, analyzing companies for dividend investing, or running your own business, understanding this crucial metric can mean the difference between smart investments and costly mistakes. investopedia.com
Key Takeaways
- Operating profit margin measures how much profit a company makes from its core operations for every dollar of revenue, expressed as a percentage
- The formula is simple: (Operating Income ÷ Revenue) × 100
- Higher margins indicate better operational efficiency and stronger competitive positioning
- Industry benchmarks vary widely; what’s excellent in retail might be poor in software
- Analyzing operating margin trends over time reveals more than single snapshots
What Is Operating Profit Margin?
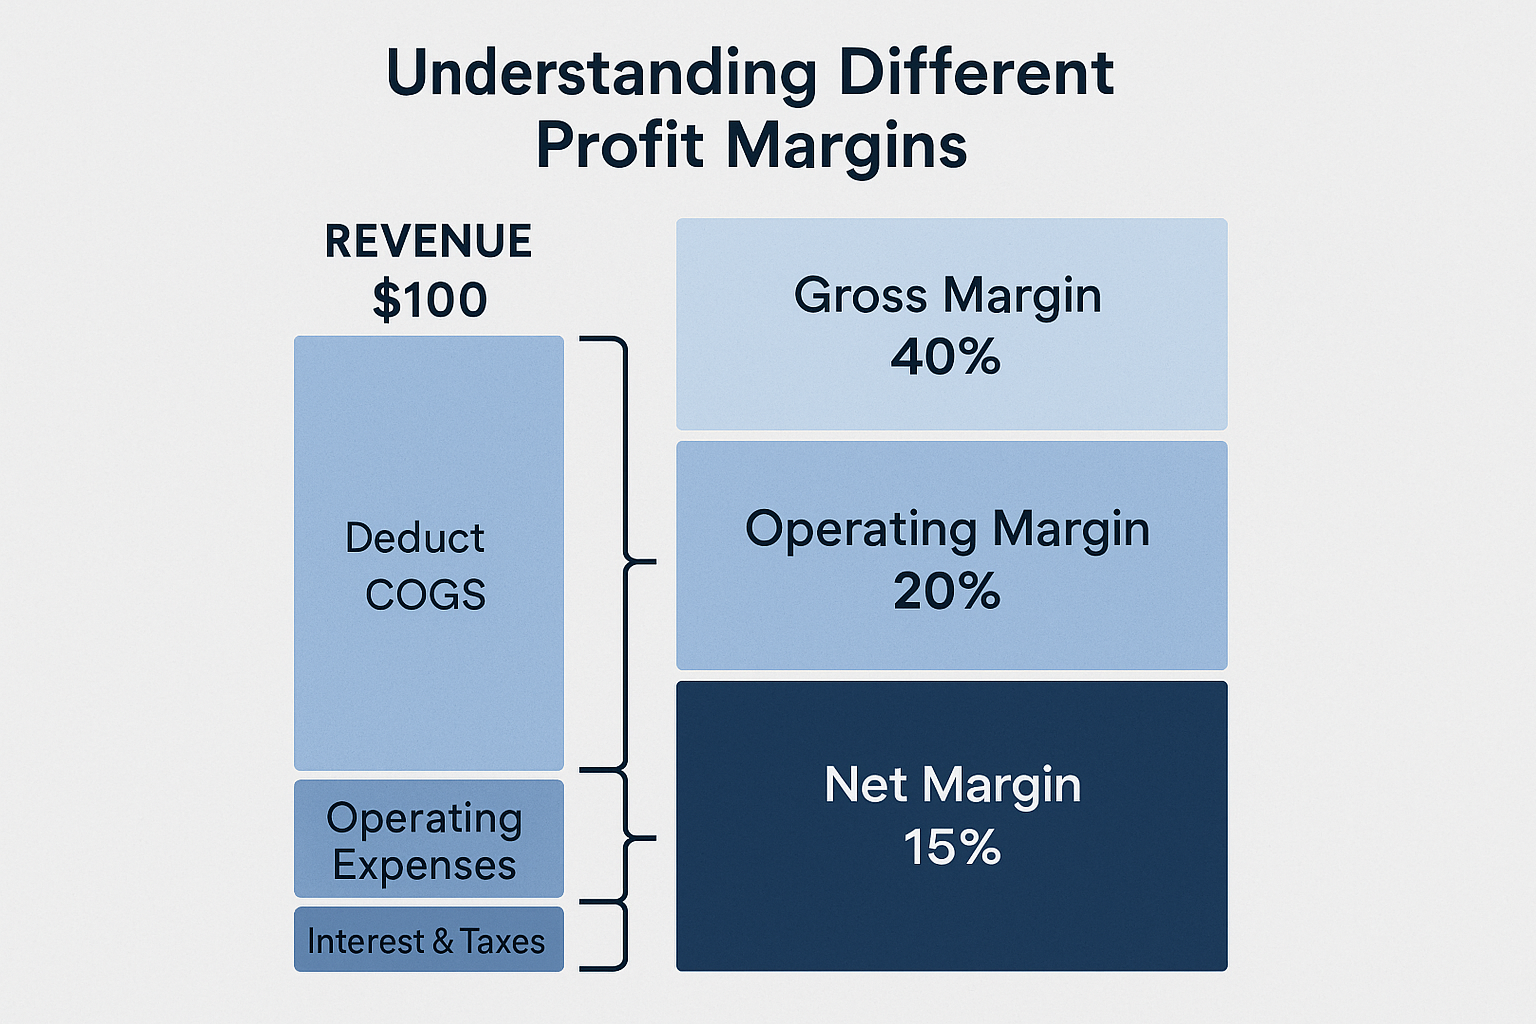
Operating profit margin is a profitability ratio that shows what percentage of a company’s revenue remains after paying for variable costs of production and day-to-day operating expenses, but before interest and taxes. Think of it as a financial health checkup that tells you how well a company manages its core business operations.
Unlike gross profit margin (which only considers the cost of goods sold) or net profit margin (which includes everything, including taxes and interest), operating profit margin focuses specifically on operational efficiency. It answers the question: “How good is this company at running its actual business?”
Why Operating Profit Margin Matters
For investors and business owners alike, operating profit margin serves as a powerful diagnostic tool:
Operational Efficiency Indicator: Shows how well management controls costs relative to revenue
Competitive Positioning: Companies with higher margins often have stronger competitive advantages
Sustainability Assessment: Reveals whether profits come from sustainable operations or one-time events
Comparison Tool: Enables apples-to-apples comparisons between companies in the same industry
When you’re researching high dividend stocks or evaluating potential investments, operating profit margin helps you identify companies with sustainable business models that can weather economic storms.
The Operating Profit Margin Formula Explained
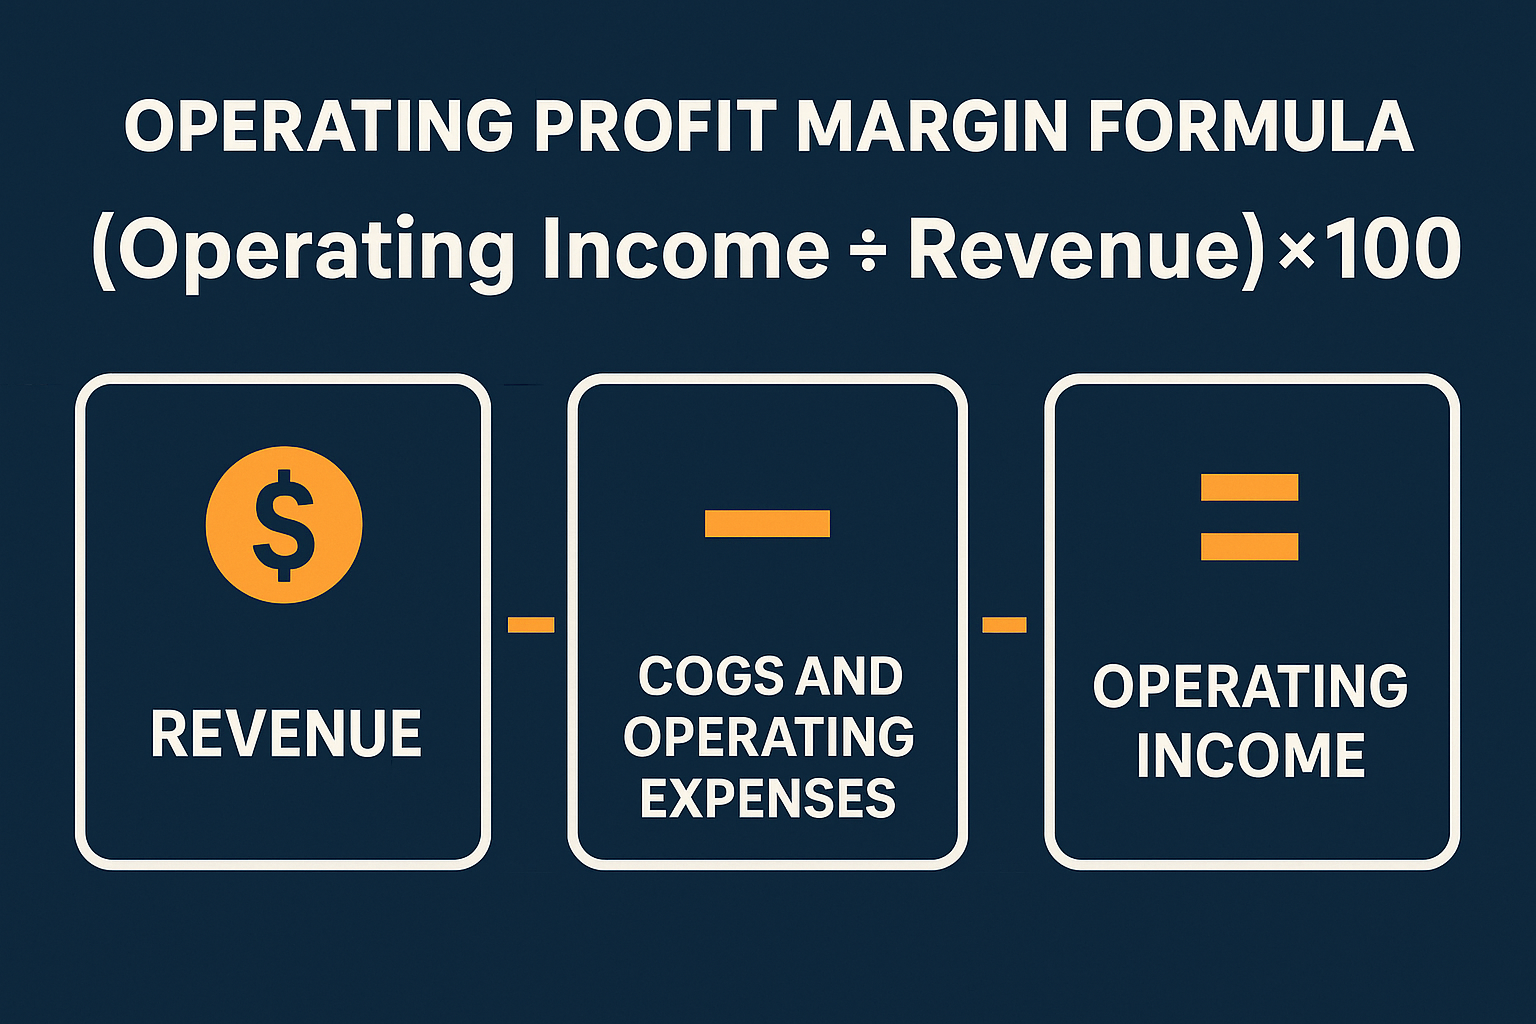
The formula for calculating operating profit margin is straightforward:
Operating Profit Margin = (Operating Income ÷ Revenue) × 100
Let’s break down each component:
Operating Income (EBIT)
Operating income, also called EBIT (Earnings Before Interest and Taxes), represents profit from core business operations. You calculate it by:
Operating Income = Revenue – Cost of Goods Sold (COGS) – Operating Expenses
Operating expenses include:
- Salaries and wages
- Rent and utilities
- Marketing and advertising costs
- Research and development (R&D)
- Depreciation and amortization
- Administrative expenses
Important: Operating income excludes interest payments, taxes, and non-operating items like investment gains or losses.
Revenue (Net Sales)
Revenue is the total amount of money a company receives from selling goods or services during a specific period. This is your “top line” number, what most people think of when they hear “how much did the company make?”
The Multiplication by 100
Multiplying by 100 converts the decimal result into a percentage, making it easier to interpret and compare.
How to Calculate Operating Profit Margin: Step-by-Step Example
Let’s walk through a real-world example with a fictional company called TechGadget Inc.
TechGadget Inc. Annual Financial Data:
- Total Revenue: $10,000,000
- Cost of Goods Sold: $4,000,000
- Operating Expenses: $3,500,000
Step 1: Calculate Operating Income
Operating Income = Revenue – COGS – Operating Expenses
Operating Income = $10,000,000 – $4,000,000 – $3,500,000
Operating Income = $2,500,000
Step 2: Apply the Operating Profit Margin Formula
Operating Profit Margin = (Operating Income ÷ Revenue) × 100
Operating Profit Margin = ($2,500,000 ÷ $10,000,000) × 100
Operating Profit Margin = 25%
This means TechGadget Inc. keeps 25 cents as operating profit for every dollar of revenue generated. Not bad! britannica.com
Another Example: Comparing Two Companies
Let’s compare two retail companies to see how operating profit margin helps with investment decisions:
| Company | Revenue | Operating Income | Operating Profit Margin |
|---|---|---|---|
| RetailCo A | $50,000,000 | $5,000,000 | 10% |
| RetailCo B | $30,000,000 | $6,000,000 | 20% |
Even though RetailCo A has higher revenue and slightly lower operating income, RetailCo B demonstrates superior operational efficiency with a 20% margin versus 10%. This suggests RetailCo B has better cost control, pricing power, or both.
📊 Operating Profit Margin Calculator
Calculate your company’s operational efficiency
Operating Income = Revenue – COGS – Operating Expenses
What Is a Good Operating Profit Margin?
Here’s the million-dollar question: what counts as a “good” operating profit margin? The answer is frustratingly simple: it depends.
Operating profit margins vary dramatically across industries due to differences in business models, competition, capital requirements, and pricing power.
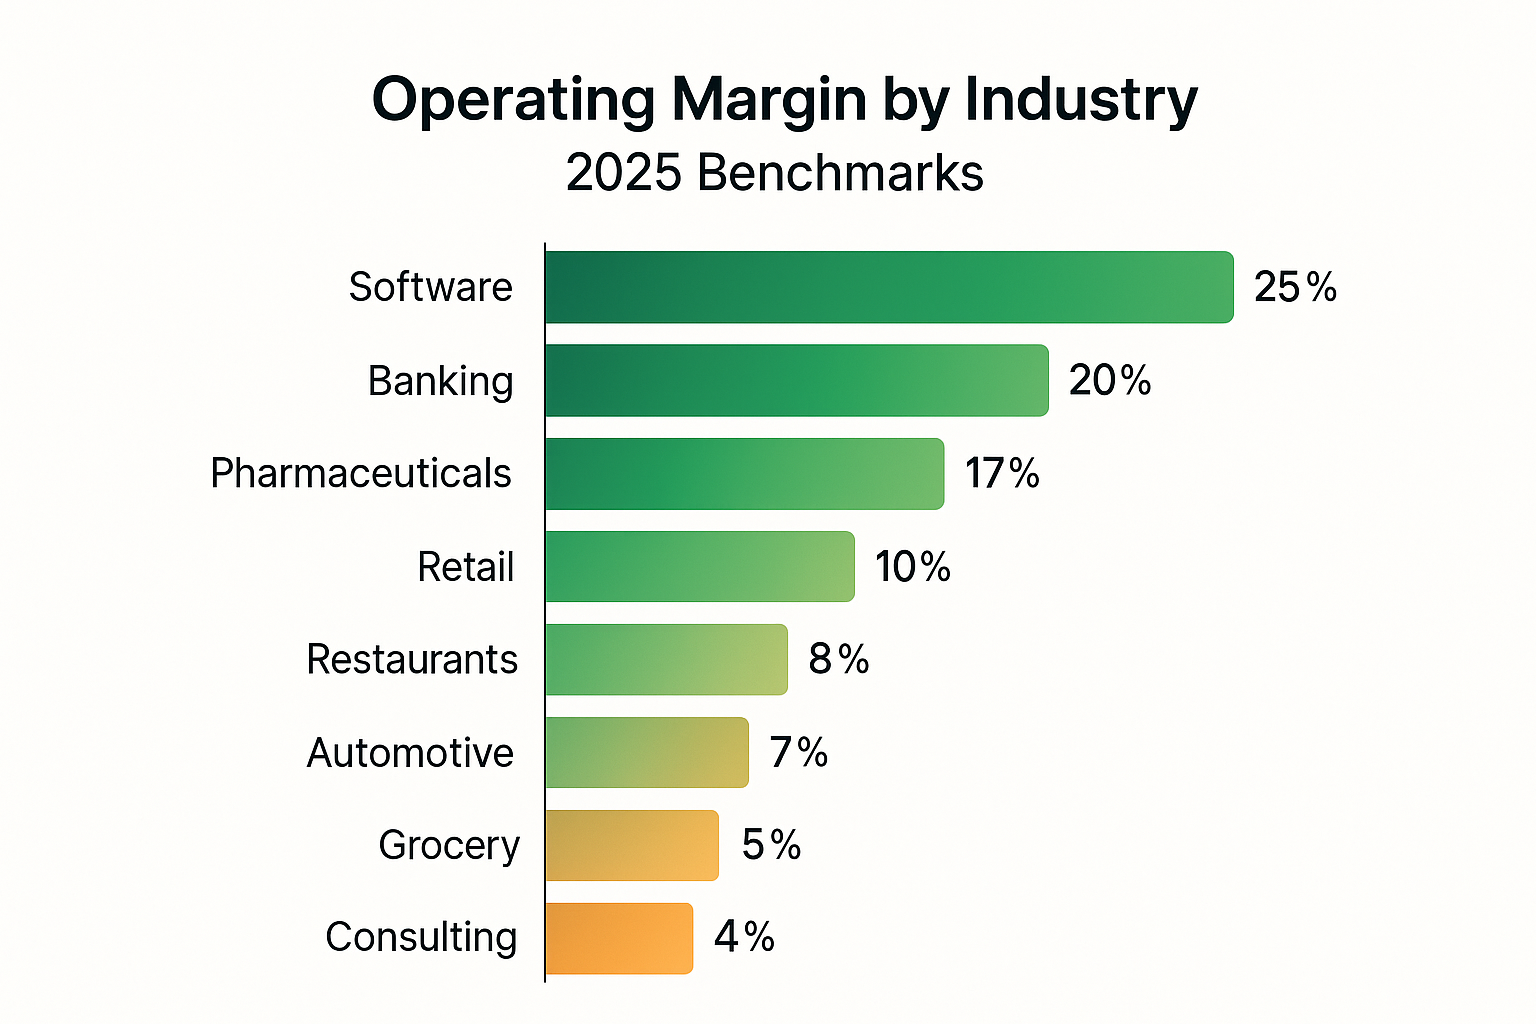
Industry Benchmarks (2025 Averages)
| Industry | Typical Operating Margin | Notes |
|---|---|---|
| Software & SaaS | 20-40% | High margins due to low variable costs |
| Pharmaceuticals | 15-25% | High R&D costs but strong pricing power |
| Banking | 25-35% | Service-based with operational leverage |
| Retail (General) | 2-5% | Highly competitive, thin margins |
| Grocery Stores | 1-3% | Extremely competitive, volume-based |
| Restaurants | 5-10% | Labor and food costs create pressure |
| Automotive | 5-10% | Capital intensive with cyclical demand |
| Consulting Services | 10-20% | Capital-intensive with cyclical demand |
Key Insight: A 3% operating margin might be excellent for a grocery chain but disastrous for a software company. Always compare companies within the same industry.
What Makes a Margin “Good”?
Rather than focusing on absolute numbers, consider these factors:
1. Industry Context: Compare against direct competitors and industry averages
2. Trend Direction: Is the margin improving, stable, or declining over time?
3. Consistency: Stable margins often indicate sustainable competitive advantages
4. Scale: Does the margin improve as the company grows? (Economies of scale)
5. Economic Cycle: How does the margin perform during recessions versus expansions?
A company with a 15% operating margin that’s been growing steadily for five years might be a better investment than one with a 25% margin that’s been declining.
Operating Profit Margin vs Other Profitability Metrics
Understanding how operating profit margin differs from related metrics helps you build a complete picture of financial health.
Operating Margin vs Gross Profit Margin
Gross Profit Margin = (Revenue – COGS) ÷ Revenue × 100
Gross margin only considers the direct costs of producing goods or services (COGS). It ignores operating expenses like marketing, R&D, and administrative costs.
Example: A company might have a 60% gross margin but only a 10% operating margin because it spends heavily on research and development.
Operating Margin vs Net Profit Margin
Net Profit Margin = (Net Income ÷ Revenue) × 100
Net margin is the “bottom line” that includes everything: operating expenses, interest, taxes, and one-time items.
Key Difference: A company might have a strong 20% operating margin but a lower 12% net margin due to high interest payments on debt. This reveals financial structure issues that operating margin alone wouldn’t show.
Operating Margin vs EBITDA Margin
EBITDA Margin = (EBITDA ÷ Revenue) × 100
EBITDA (Earnings Before Interest, Taxes, Depreciation, and Amortization) adds back depreciation and amortization to operating income.
When It Matters: EBITDA margin is useful for capital-intensive industries where depreciation significantly impacts operating income, or when comparing companies with different depreciation methods.
The Complete Picture
Think of these metrics as different lenses examining the same business:
- Gross Margin: Production efficiency
- Operating Margin: Overall operational efficiency
- Net Margin: Total profitability after all expenses
- EBITDA Margin: Cash generation potential
For smart investing decisions, examine all these metrics together rather than relying on just one.
How to Improve Operating Profit Margin
Whether you’re running a business or evaluating potential investments, understanding how companies can improve their operating margins provides valuable insights. netsuite.com
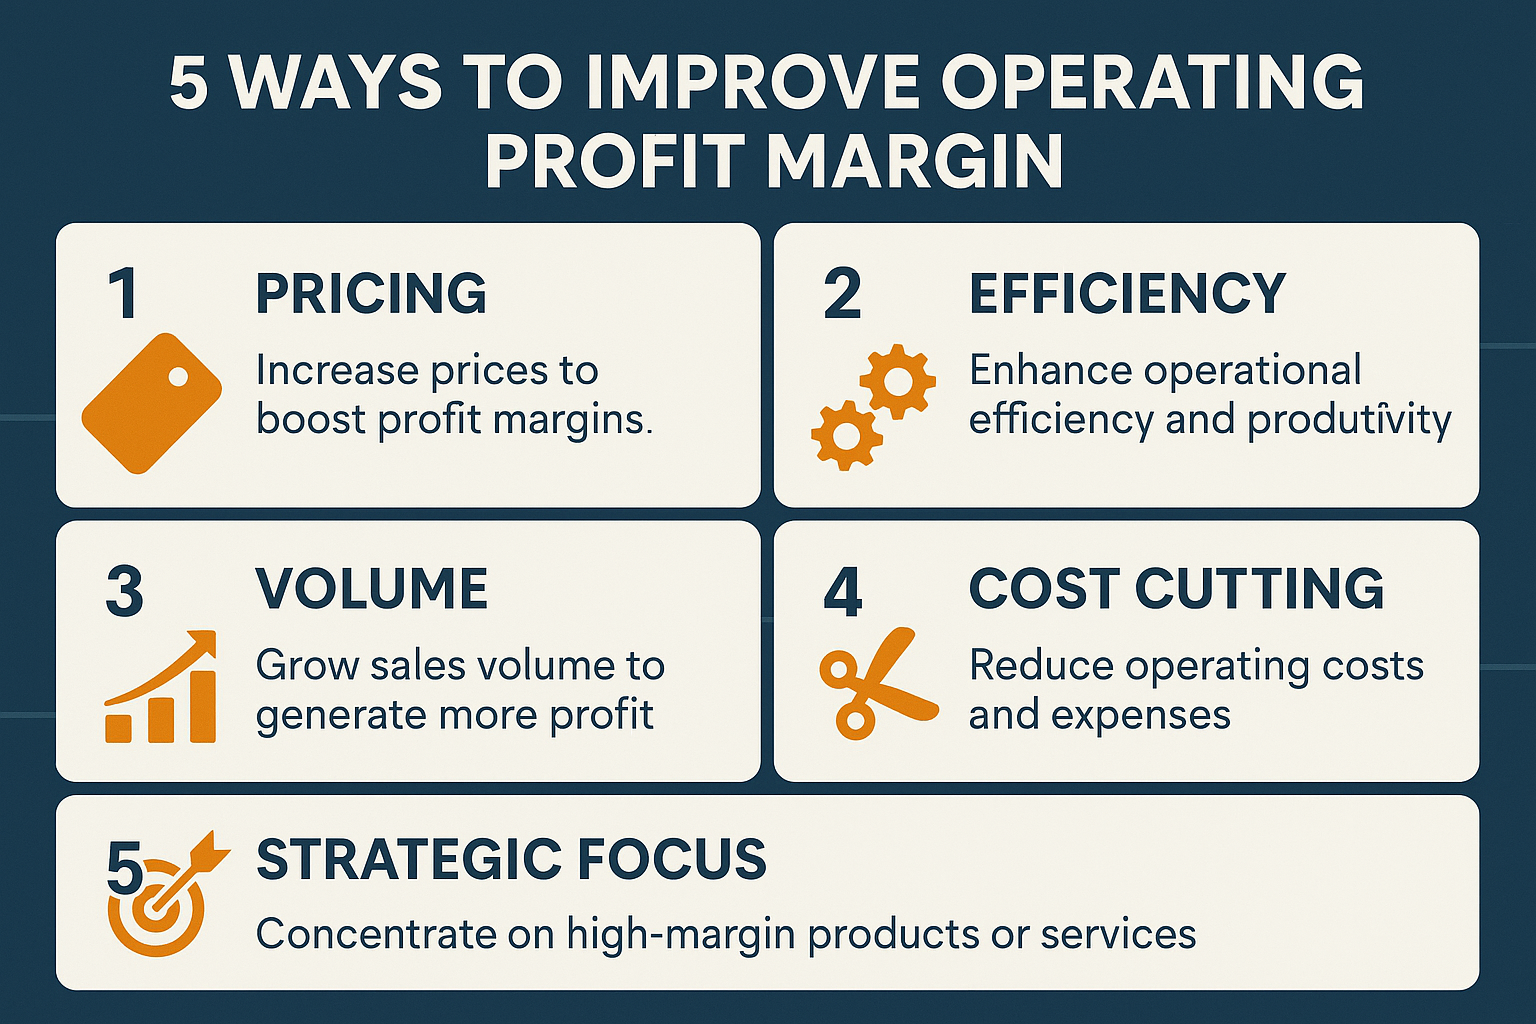
Strategy 1: Increase Revenue Without Proportional Cost Increases
The most powerful way to boost operating margin is to grow revenue faster than costs grow. This happens through:
Pricing Power: Companies with strong brands or unique products can raise prices without losing customers. Think Apple is increasing iPhone prices while maintaining market share.
Volume Growth: Selling more units spreads fixed costs across more revenue. A factory running at 90% capacity is more profitable than one at 60%.
Product Mix Optimization: Shifting sales toward higher-margin products improves overall margins. For example, a restaurant promotes signature cocktails (high margin) over beer (low margin).
Strategy 2: Reduce Cost of Goods Sold
Lowering production costs directly improves both gross and operating margins:
- Negotiate better supplier contracts
- Improve manufacturing efficiency
- Reduce waste and defects
- Automate production processes
- Optimize inventory management
Real-World Example: When Walmart implemented advanced inventory systems and negotiated directly with manufacturers, it reduced COGS while maintaining quality, creating competitive advantages through superior margins.
Strategy 3: Control Operating Expenses
Smart expense management without sacrificing growth:
Marketing Efficiency: Shift from expensive traditional advertising to cost-effective digital marketing with better ROI tracking
Technology Automation: Invest in systems that reduce manual labor costs over time
Remote Work Models: Reduce real estate and facility costs (accelerated since 2020)
Outsourcing Non-Core Functions: Let specialists handle functions like payroll or IT support more efficiently
Strategy 4: Achieve Economies of Scale
As companies grow, per-unit costs often decline:
- Fixed costs (rent, executive salaries) are spread across more revenue
- Bulk purchasing power increases
- Operational processes become more refined
- Technology investments deliver better returns at scale
This is why larger competitors often have a margin advantage over smaller players in the same industry.
Strategy 5: Strategic Focus
Sometimes improving margins means saying “no”:
- Exit low-margin product lines or customer segments
- Focus resources on the highest-return activities
- Discontinue unprofitable locations or divisions
- Streamline product offerings to reduce complexity
Important Note: When evaluating investments, watch for companies executing these strategies. Improving margins often signals strong management and can lead to stock price appreciation.
Analyzing Operating Profit Margin: What Investors Should Look For
When researching potential investments or evaluating dividend stocks, here’s how to analyze operating profit margin like a pro:
1. Examine the Trend (5+ Years)
Single-year margins can be misleading. Look at the five-year trend:
Improving Margins: Suggests increasing efficiency, pricing power, or economies of scale
Stable Margins: Indicates consistent operations and sustainable competitive position
Declining Margins: Red flag requiring investigation, increasing competition? Rising costs? Poor management?
2. Compare to Competitors
Pull up the operating margins for 3-5 direct competitors:
- If your target company significantly outperforms peers, investigate why (competitive advantage?)
- If it underperforms, understand the reasons (temporary issues or structural problems?)
- Industry leaders often maintain margin premiums for years
3. Understand the Business Model
Different business models naturally produce different margins:
High-Margin Models:
- Software/SaaS (low incremental costs)
- Financial services (leverage and scale)
- Luxury brands (pricing power)
Low-Margin Models:
- Retail (competitive pressure)
- Commodities (price takers)
- Food service (high labor and material costs)
4. Check for Red Flags
Warning Sign 1: Margins declining while competitors remain stable
Warning Sign 2: Margins propped up by one-time cost cuts rather than sustainable improvements
Warning Sign 3: Revenue growing but margins shrinking (pricing pressure or inefficient growth)
Warning Sign 4: Margins that seem “too good to be true” compared to industry (accounting questions?)
5. Connect to Cash Flow
High operating margins should eventually translate to strong cash flow. If a company shows great margins but poor cash flow, dig deeper into:
- Aggressive revenue recognition
- Working capital management issues
- Capital expenditure requirements
6. Consider the Economic Cycle
Some businesses are more cyclical than others. Understanding why the stock market goes up and down helps you evaluate whether current margins are sustainable or inflated by favorable conditions.
Cyclical Industries: Automotive, construction, luxury goods (margins expand in booms, contract in recessions)
Defensive Industries: Utilities, consumer staples, healthcare (more stable margins through cycles)
Real-World Case Study: Operating Margin in Action
Let me share a story about two companies that illustrate why operating margin matters so much.
In 2015, two retail companies, let’s call them “DiscountMart” and “PremiumRetail”, had similar revenues of around $5 billion. Both were publicly traded, and many investors viewed them as comparable investment opportunities.
DiscountMart’s Numbers:
- Revenue: $5.2 billion
- Operating Income: $156 million
- Operating Margin: 3%
PremiumRetail’s Numbers:
- Revenue: $4.8 billion
- Operating Income: $672 million
- Operating Margin: 14%
On the surface, DiscountMart looked impressive with higher revenue. But the operating margin told a different story.
Over the next five years:
DiscountMart struggled to compete with online retailers. Their thin 3% margin left no room for error. When they needed to invest in e-commerce and lower prices to compete, they couldn’t do it without going into the red. The stock declined 45%.
PremiumRetail used its 14% margin cushion to invest heavily in customer experience, technology, and brand building. Even after these investments, they maintained healthy profitability. The stock increased 180%.
The lesson? Revenue is vanity, margin is sanity, cash is reality. The company with superior operating efficiency and margin protection had the financial flexibility to adapt and thrive.
This is exactly why understanding operating profit margin matters when you’re trying to avoid losing money in the stock market.
Common Mistakes When Analyzing Operating Profit Margin
Even experienced investors sometimes stumble when interpreting operating margins. Avoid these common pitfalls:
1: Ignoring Industry Context
Comparing a software company’s 35% margin to a grocery chain’s 2% margin and concluding the grocer is “bad” ignores fundamental business model differences. Always use industry-appropriate benchmarks.
2: Focusing Only on Current Margin
A single quarter or year doesn’t tell the whole story. Temporary factors (seasonal fluctuations, one-time expenses, unusual market conditions) can distort margins. Always examine multi-year trends.
3: Overlooking the Quality of Earnings
Not all operating income is created equal. Some companies boost margins through:
- Aggressive accounting practices
- Cutting essential investments (R&D, maintenance)
- Unsustainable cost reductions
Sustainable margins come from genuine competitive advantages and operational excellence.
4: Ignoring the Margin-Growth Tradeoff
Sometimes companies deliberately accept lower margins to invest in growth. Amazon famously operated with razor-thin margins for years while building market dominance. The question isn’t just “what’s the margin?” but “what’s the strategy?”
5: Neglecting the Balance Sheet
A company might show strong operating margins while drowning in debt. Operating margin doesn’t reflect interest expenses, so always examine the complete financial picture.
6: Misunderstanding Margin Expansion
If margins improve because a company cuts R&D spending, that’s very different from margins improving due to economies of scale. One is borrowing from the future; the other is sustainable improvement.
Operating Profit Margin and Investment Decisions
How should operating profit margin influence your investment choices? Here’s a practical framework:
For Value Investors
Look for companies with:
- Stable or improving margins over 5+ years
- Margins at or above the industry average
- Strong margins provide downside protection during recessions
- Margin improvements driven by operational excellence, not accounting tricks
For Growth Investors
Consider:
- Whether the company is sacrificing short-term margins for long-term market share (acceptable if strategic)
- The path to margin expansion as the company scales
- Whether the business model can eventually deliver strong margins
- Competitive dynamics that might pressure future margins
For Dividend Investors
When evaluating opportunities for passive income through dividend investing, operating margin is crucial because:
- Higher margins provide more cash to fund dividends
- Stable margins suggest sustainable dividend payments
- Margin cushion protects dividends during downturns
- Improving margins may signal future dividend increases
For All Investors
Operating profit margin should be one factor in a comprehensive analysis that includes:
- Revenue growth trends
- Cash flow generation
- Balance sheet strength
- Competitive positioning
- Management quality
- Valuation metrics
Think of operating margin as one instrument in an orchestra, important, but most powerful when harmonizing with other metrics.
Where to Find Operating Profit Margin Data
You don’t need expensive financial terminals to access operating margin data. Here are reliable, mostly free sources:
Company Financial Statements
The most authoritative source is the company’s own filings:
10-K (Annual Report): Contains a complete income statement with revenue and operating income
10-Q (Quarterly Report): Provides quarterly updates
Find these free at:
- Company investor relations websites
- SEC EDGAR database (for U.S. public companies)
Financial Websites
These platforms calculate operating margins for you:
Yahoo Finance: Free, user-friendly, includes historical data
Morningstar: Excellent for fundamental analysis; some features require a subscription
Seeking Alpha: Good for comparing multiple companies
MarketWatch: Clean presentation of financial metrics
Stock Screeners
If you want to find companies with specific margin characteristics:
Finviz: Free screener with operating margin filters
Stock Rover: More advanced screening tools
TradingView: Visual charts of margin trends over time
Brokerage Platforms
Most modern brokerages (Fidelity, Charles Schwab, TD Ameritrade, etc.) provide comprehensive fundamental data, including operating margins, in their research sections.
Beyond the Numbers: Qualitative Factors That Affect Operating Margin
Numbers tell part of the story, but understanding the “why” behind margins requires examining qualitative factors:
Competitive Moats
Companies with strong competitive advantages often maintain superior margins:
Brand Power: Luxury brands command premium prices (higher margins)
Network Effects: Platforms become more valuable as they grow (Facebook, Visa)
Switching Costs: Enterprise software with high switching costs protects margins
Cost Advantages: Walmart’s scale creates cost advantages that competitors can’t match
Management Quality
Great management teams consistently find ways to improve margins:
- Operational discipline
- Strategic resource allocation
- Innovation in cost reduction
- Smart capital deployment
Poor management might show temporarily strong margins that aren’t sustainable.
Industry Disruption
Understanding market emotions and cycles helps you recognize when entire industries face margin pressure from disruption:
- Retail is facing e-commerce competition
- Traditional media facing streaming services
- Taxi services are facing ride-sharing apps
- Hotels facing short-term rental platforms
Regulatory Environment
Regulations can significantly impact margins:
- Healthcare companies are facing pricing pressure
- Financial services dealing with compliance costs
- Environmental regulations affecting manufacturing
Economic Conditions
Broader economic factors influence margins:
- Inflation is increasing input costs
- Labor market tightness is raising wages
- Interest rates affect borrowing costs
- Currency fluctuations for international businesses
Operating Profit Margin for Small Business Owners
While much of this article focuses on analyzing public companies, the operating profit margin is equally crucial for small business owners and entrepreneurs.
Why Small Businesses Should Track Operating Margin
Cash Flow Management: Understanding your margin helps predict cash availability
Pricing Decisions: Know your minimum margin to stay profitable
Growth Planning: Determine if you can afford to invest in expansion
Competitive Positioning: Benchmark against industry standards
Investor Appeals: If seeking funding, strong margins attract investors
How to Improve Your Small Business Operating Margin
Start with Accurate Tracking: You can’t improve what you don’t measure. Use accounting software (QuickBooks, Xero, FreshBooks) to track all revenue and expenses accurately.
Categorize Expenses Properly: Separate COGS from operating expenses to understand where money actually goes.
Find Your Most Profitable Products/Services: Not all revenue is equal. Identify high-margin offerings and promote them.
Reduce Waste: Small efficiency improvements compound over time, eliminate unnecessary expenses, reduce inventory waste, and optimize processes.
Strategic Pricing: Don’t compete solely on price. Add value that justifies premium pricing.
Leverage Technology: Automation tools often pay for themselves through reduced labor costs and improved efficiency.
Small Business Margin Targets
While it varies by industry, here are general guidelines:
- Below 5%: Vulnerable—very little cushion for unexpected expenses
- 5-10%: Acceptable for many service businesses and retail
- 10-20%: Healthy—provides room for investment and growth
- Above 20%: Excellent—strong competitive position or unique offering
Remember, the goal isn’t just achieving a target margin once, but maintaining and improving it over time.
The Future of Operating Profit Margins
As we move through 2025 and beyond, several trends are reshaping operating margins across industries:
Technology and Automation
Artificial intelligence and automation are transforming cost structures. Companies investing in these technologies may see:
- Short-term margin pressure from implementation costs
- Long-term margin expansion from reduced labor costs and improved efficiency
Sustainability Pressures
Environmental, social, and governance (ESG) considerations increasingly affect margins:
- Initial costs for sustainable practices
- Potential long-term savings from efficiency
- Consumer willingness to pay premiums for sustainable products
Remote Work Evolution
The shift to remote and hybrid work models impacts margins differently across industries:
- Reduced real estate costs
- Potential productivity changes
- Technology infrastructure investments
Supply Chain Restructuring
Post-pandemic supply chain rethinking affects margins through:
- Nearshoring increases labor costs but reduces risk
- Diversification adds complexity and costs
- Technology is improving visibility and efficiency
Market Consolidation
Many industries are seeing consolidation, which typically leads to:
- Larger players are achieving better margins through scale
- Smaller competitors are facing margin pressure
- Innovation potentially disrupting established margin structures
Understanding these trends helps investors identify companies positioned to maintain or expand margins in changing environments.
Practical Action Steps: Using Operating Profit Margin Today
Ready to put this knowledge into practice? Here’s your action plan:
For Investors (Next 30 Days)
Week 1: Choose 3-5 companies you’re interested in or currently own. Pull their last 5 years of annual reports.
Week 2: Calculate or compile their operating profit margins for each year. Create a simple spreadsheet tracking the trend.
Week 3: Research their top 3 competitors and compare operating margins. Identify who leads and why.
Week 4: Read recent earnings call transcripts to understand management’s discussion of margin trends and initiatives.
For Business Owners (Next 30 Days)
Week 1: Gather your financial statements for the past 3 years. Calculate your operating profit margin for each year.
Week 2: Break down your operating expenses by category. Identify the largest expense items.
Week 3: Research typical margins in your industry. How do you compare?
Week 4: Develop 2-3 specific initiatives to improve your margin by 1-2 percentage points over the next year.
For Students/Learners (Next 30 Days)
Week 1: Practice calculating operating margins using real company financial statements (start with companies you know well).
Week 2: Create a comparison chart of operating margins across different industries. Notice the patterns.
Week 3: Follow one company’s quarterly earnings releases for a year, tracking how margins change and why.
Week 4: Write a brief analysis of a company’s margin trends and what they suggest about the business.
If you’re working toward building wealth for the next generation, understanding metrics like operating profit margin is an essential skill to develop and teach.
FAQ
A “good” operating profit margin varies by industry. For example, software or financial services companies may have margins above 25%, while retailers or manufacturers often range between 5–15%. Always compare a company’s margin with its industry peers, not across sectors.
Operating profit margin excludes taxes and interest expenses, focusing on core business operations. Net profit margin includes all costs, interest, taxes, and one-time items, providing a broader view of total profitability.
Yes. This happens when a company controls production costs well (high gross margin) but has high operating expenses like marketing or administrative costs, which lower the operating margin.
Companies can raise their operating margins by reducing overhead costs, improving efficiency, automating workflows, or increasing prices strategically without losing customers.
They are essentially the same metric. EBIT (Earnings Before Interest and Taxes) represents operating income. Thus, operating profit margin = EBIT ÷ Revenue × 100.
Conclusion
Operating profit margin is far more than just another financial ratio, it’s a window into a company’s operational soul. It reveals how efficiently a business converts revenue into profit, how well management controls costs, and whether competitive advantages actually exist or are just marketing talk.
Throughout this guide, we’ve explored:
✅ The fundamentals: What operating profit margin is and how to calculate it using the simple formula: (Operating Income ÷ Revenue) × 100
✅ Context matters: Why industry benchmarks vary wildly and why a “good” margin depends entirely on the business model and competitive landscape
✅ Comparative analysis: How operating margin differs from gross margin, net margin, and EBITDA margin, and why examining all these metrics together provides the clearest picture
✅ Improvement strategies: The five key approaches companies use to expand margins, from increasing pricing power to achieving economies of scale
✅ Investment applications: How to use operating margin analysis when evaluating stocks, whether you’re a value investor, growth investor, or dividend seeker
✅ Practical tools: Where to find margin data and how to analyze it like a professional investor
✅ Real-world wisdom: Common mistakes to avoid and qualitative factors that numbers alone can’t capture
Remember the coffee shop example from the beginning? Revenue impresses at parties, but margin pays the bills. Whether you’re analyzing potential investments, running a business, or simply trying to understand how companies really work, operating profit margin is one of the most valuable metrics in your financial toolkit.
The companies with sustainable competitive advantages, excellent management, and long-term potential almost always demonstrate strong, stable, or improving operating margins. They’re the businesses that can weather economic storms, invest in growth, reward shareholders, and compound wealth over decades.
Your next step is simple: start looking at operating margins. Pull up your portfolio holdings or companies you’re researching. Calculate the margins. Examine the trends. Compare to competitors. Ask “why?” when you see unusual patterns.
This one metric won’t tell you everything, but it will tell you a lot, and that knowledge can make the difference between mediocre and exceptional investment outcomes.
Now you know. The question is: what will you do with it?
Disclaimer
The information provided in this article is for educational and informational purposes only and should not be construed as financial, investment, tax, or legal advice. Operating profit margin analysis is just one component of comprehensive financial analysis, and investment decisions should be based on thorough research and consideration of your individual financial situation, goals, and risk tolerance.
Past performance of companies or investments does not guarantee future results. All investments carry risk, including the potential loss of principal. The examples and case studies presented are hypothetical or simplified for educational purposes and may not reflect actual company performance.
Before making any investment decisions, please consult with qualified financial, tax, and legal professionals who can provide advice tailored to your specific circumstances. The author and publisher are not responsible for any financial decisions made based on the information contained in this article.
About the Author
Max Fonji is a financial educator and investment analyst with over a decade of experience helping everyday investors understand complex financial concepts. Through TheRichGuyMath.com, Max breaks down investing, personal finance, and wealth-building strategies into accessible, actionable guidance. His mission is to democratize financial knowledge and help readers build lasting wealth through informed decision-making.
When not analyzing financial statements or writing about investing, Max enjoys teaching financial literacy to young adults and exploring smart ways to generate passive income.