The stock market offers countless metrics to evaluate investment opportunities, but few combine simplicity with analytical power quite like the PEG ratio. While most investors rely solely on the traditional Price-to-Earnings (P/E) ratio, they often miss a critical piece of the puzzle: growth. A stock trading at a P/E of 30 might seem expensive, until you discover the company is growing earnings at 40% annually. This is where the PEG ratio transforms valuation analysis from a simple snapshot into a dynamic assessment of value versus growth potential.
The PEG ratio answers a fundamental question that keeps investors awake at night: “Am I paying too much for this growth stock?” By incorporating earnings growth into the valuation equation, this metric provides a more complete picture than the P/E ratio alone. Understanding the math behind this powerful tool unlocks better investment decisions and helps distinguish between genuinely undervalued opportunities and expensive traps disguised as growth stories.
Key Takeaways
- The PEG ratio divides a company’s P/E ratio by its earnings growth rate, providing a growth-adjusted valuation metric that reveals whether high P/E ratios are justified
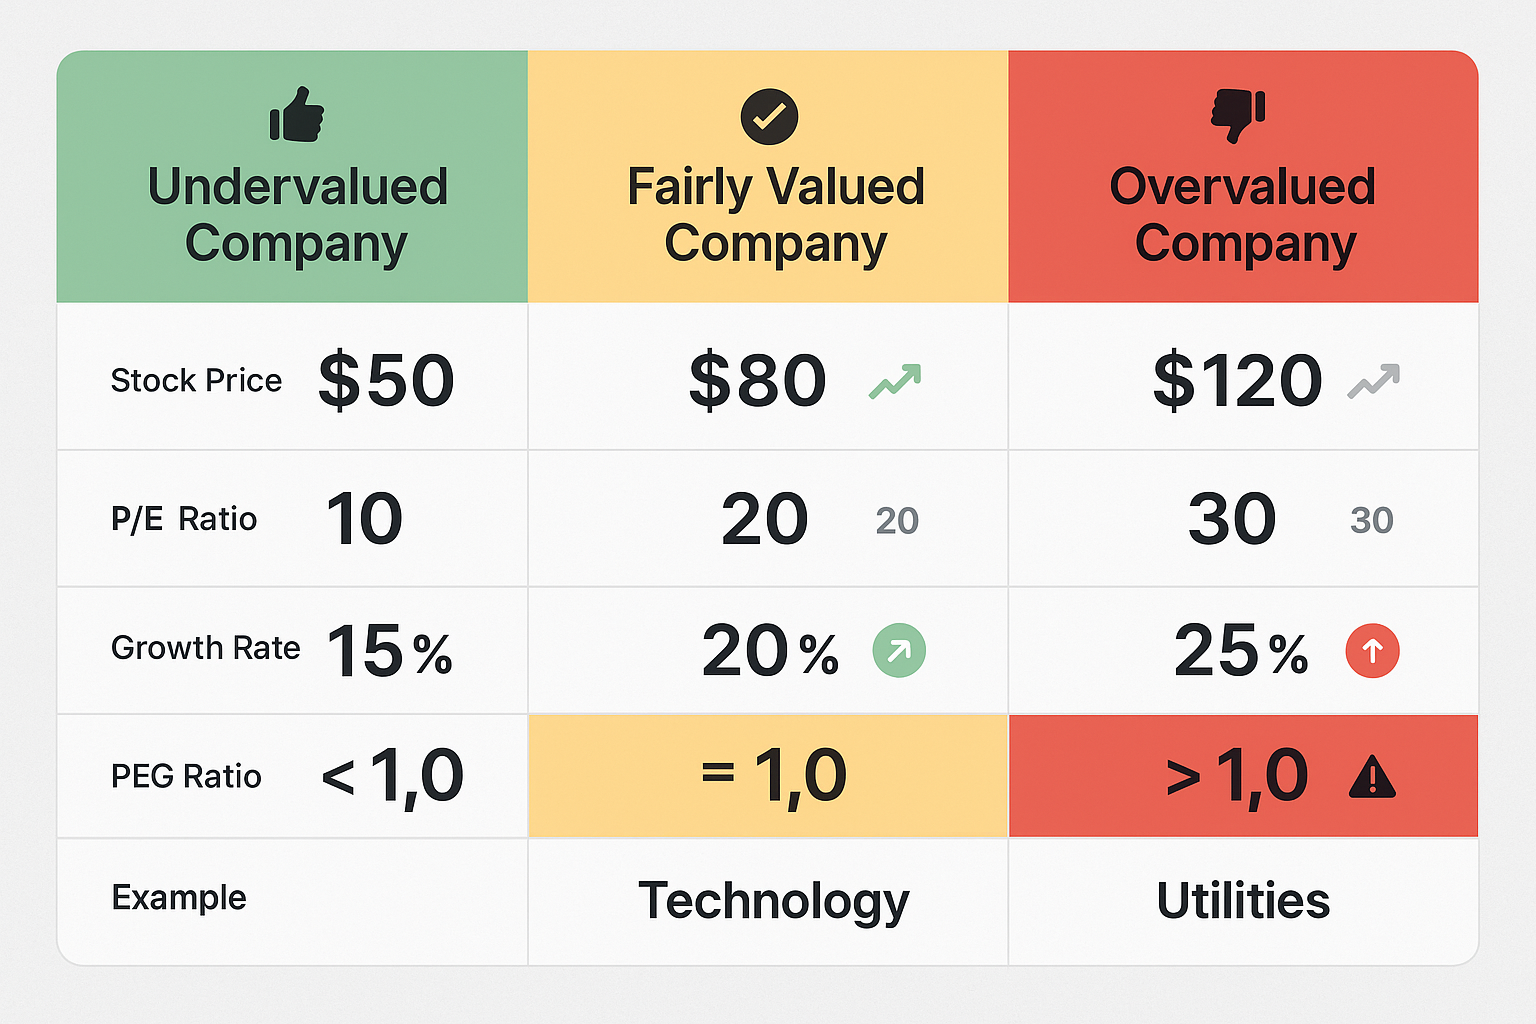
- A PEG ratio below 1.0 typically signals undervaluation, while readings above 1.0 suggest overvaluation relative to growth expectations
- This metric works best for comparing companies within the same industry that have different growth trajectories and positive earnings
- PEG ratios rely on forward earnings estimates, making them subject to analyst optimism and forecast errors that can distort investment conclusions
- The ratio has significant limitations, including the inability to handle negative earnings, neglect of capital requirements, and sensitivity to interest rate changes
What Is the PEG Ratio?
The PEG ratio (Price/Earnings-to-Growth ratio) is a valuation metric that adjusts the traditional P/E ratio for a company’s expected earnings growth rate. This creates a more nuanced assessment of whether a stock’s current price reflects fair value given its growth prospects.
The PEG Ratio formula
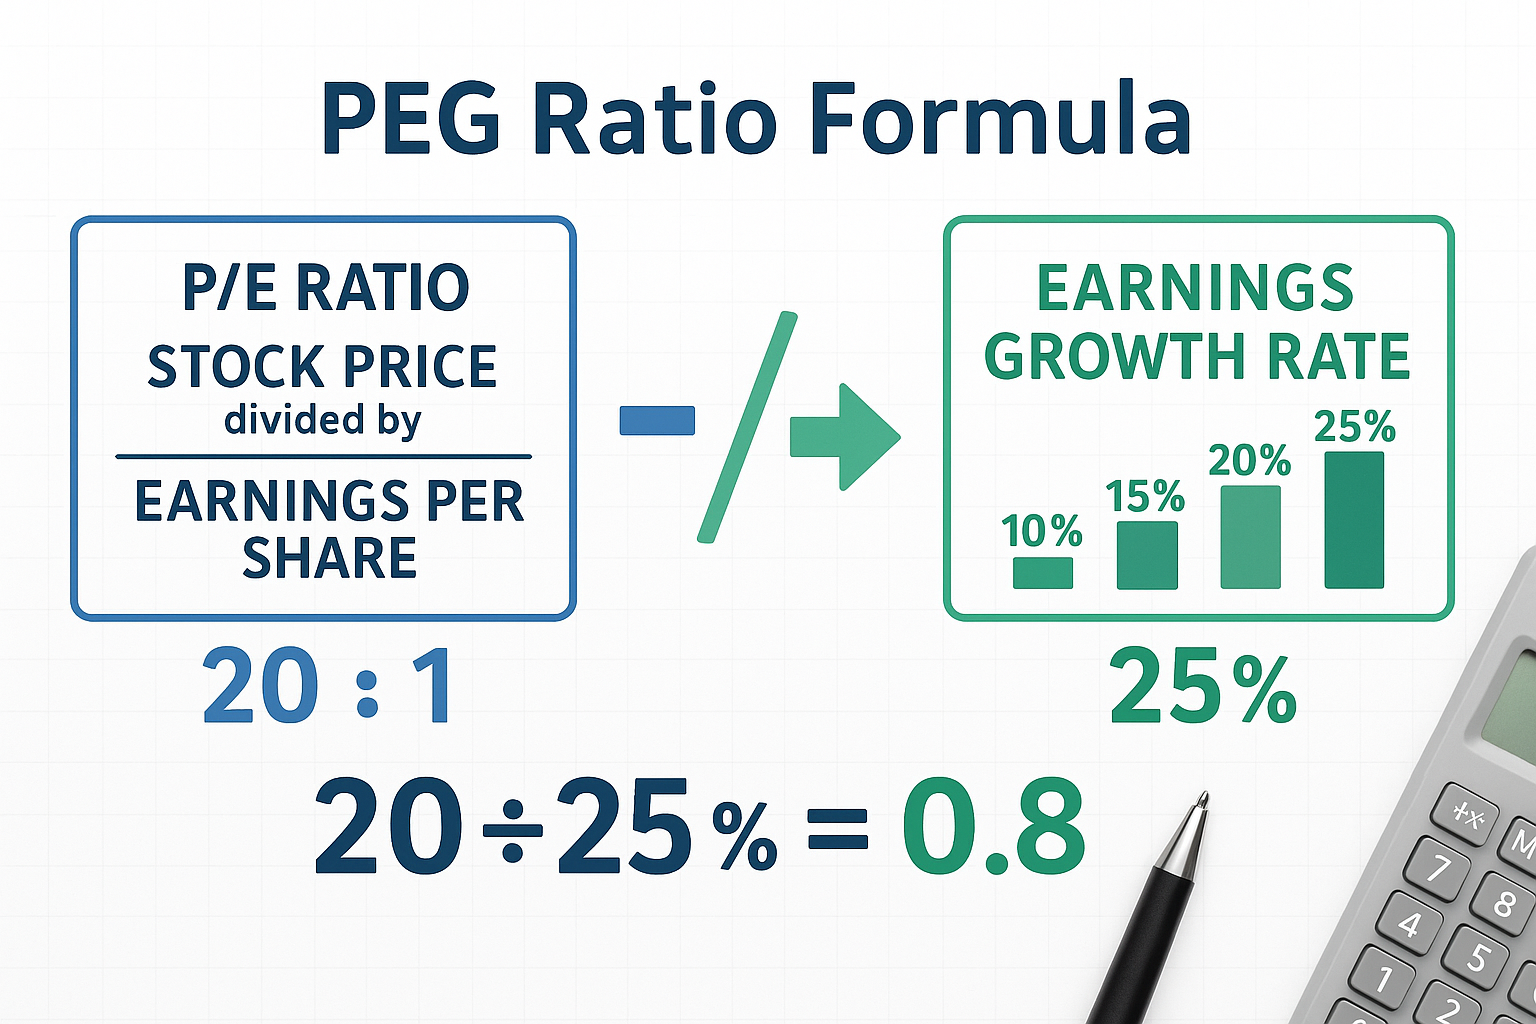
PEG Ratio = (Price-to-Earnings Ratio) ÷ (Annual EPS Growth Rate)
Each component carries a specific meaning. The P/E ratio represents how many dollars investors pay for each dollar of current earnings. The annual EPS growth rate projects how quickly those earnings will expand, typically expressed as a percentage over 1-3 years.
Breaking Down the Calculation
Consider a practical example. Company A trades at $100 per share with earnings per share of $5, creating a P/E ratio of 20. Analysts project 25% annual earnings growth over the next three years.
The PEG calculation becomes: 20 ÷ 25 = 0.8
This 0.8 reading suggests the stock trades below fair value relative to its growth rate. Investors pay $20 for each dollar of earnings, but those earnings are growing at 25% annually, a favorable relationship.
Compare this to Company B with the same $100 stock price and $5 EPS (P/E of 20), but only 10% projected growth:
20 ÷ 10 = 2.0
The 2.0 PEG ratio indicates potential overvaluation. Both companies have identical P/E ratios, but Company B’s slower growth makes its current price less attractive. This demonstrates why the PEG ratio provides superior insight compared to P/E alone; it contextualizes valuation within growth expectations.
The metric originated from legendary investor Peter Lynch, who popularized it in his investment philosophy. Lynch believed that a fairly valued company should have a PEG ratio approximately equal to 1.0, creating a simple benchmark for quick assessment.
Key insight: The PEG ratio transforms static valuation into dynamic analysis by answering whether today’s price makes sense given tomorrow’s growth.
How to Calculate and Interpret the PEG Ratio
Calculating the PEG ratio requires two inputs: the current P/E ratio and the projected earnings growth rate. While the math is simple, the interpretation demands understanding of what drives each component.
Step-by-Step Calculation Process
Step 1: Determine the P/E Ratio
The P/E ratio equals the current stock price divided by earnings per share. Most financial websites provide this automatically, but calculating manually ensures accuracy.
Example: Stock price $150 ÷ EPS of $7.50 = P/E of 20
Step 2: Identify the Earnings Growth Rate
This requires forward-looking projections, typically sourced from:
- Consensus analyst estimates (most common)
- Company guidance from earnings calls
- Historical growth rates (less reliable for PEG)
- Your own financial modeling
The time horizon matters significantly. One-year projections capture near-term momentum but may miss longer-term trends. Three-to-five-year estimates provide better stability but introduce more uncertainty.
Step 3: Divide P/E by Growth Rate
Using the example above with 20% projected annual growth:
PEG = 20 ÷ 20 = 1.0
This 1.0 reading suggests fair valuation; the P/E ratio matches the growth rate.
Interpretation Guidelines
The traditional interpretation framework provides useful starting points:
| PEG Ratio Range | Interpretation | Investment Signal |
|---|---|---|
| Below 1.0 | Potentially undervalued | Stock may be bargain relative to growth |
| 1.0 | Fairly valued | Price matches growth expectations |
| Above 1.0 | Potentially overvalued | Premium price relative to growth |
| Above 2.0 | Significantly overvalued | High risk of correction |
However, these guidelines require context. Industry norms vary considerably. Technology companies historically trade at higher PEG ratios than utilities because investors accept premium valuations for higher growth potential and market disruption opportunities.
A PEG of 1.5 might signal overvaluation in the consumer staples sector but represent a bargain in biotechnology. This is why comparing PEG ratios across industries produces misleading conclusions; always benchmark against sector peers.
Forward vs Trailing PEG Ratios
The standard PEG ratio uses forward earnings estimates, but trailing versions exist that incorporate historical growth rates. Forward PEG ratios offer predictive value but depend on analyst accuracy. Trailing PEG ratios use verified historical data but assume past growth continues unchanged.
Most professional investors prefer forward PEG ratios because investing is inherently forward-looking. The question isn’t “What did this company do?” but rather “What will it do?” This aligns with fundamental valuation principles that discount future cash flows.
Practical insight: Calculate PEG ratios using multiple growth timeframes (1-year, 3-year, 5-year) to identify consistency. Divergent results across timeframes signal growth rate instability that warrants deeper investigation.
Best Use Cases for the PEG Ratio
The PEG ratio delivers maximum value in specific investment scenarios where growth differentials create valuation complexity. Understanding when to apply this metric and when to look elsewhere separates sophisticated analysis from mechanical application.
Comparing Growth Stocks Within the Same Industry
The PEG ratio excels at evaluating multiple companies in the same sector with varying growth trajectories. This scenario arises frequently in technology, healthcare, and consumer discretionary sectors, where innovation drives divergent growth rates.
Consider three software companies:
- Company X: P/E of 35, growth rate of 30% → PEG of 1.17
- Company Y: P/E of 45, growth rate of 50% → PEG of 0.90
- Company Z: P/E of 25, growth rate of 15% → PEG of 1.67
Despite Company Y having the highest P/E ratio, its superior growth rate produces the lowest PEG ratio, suggesting it offers the best value-for-growth proposition. This comparison would be impossible using P/E ratios alone, which would incorrectly identify Company Z as the bargain.
This application works because companies in the same industry face similar:
- Market dynamics and competitive pressures
- Regulatory environments
- Capital intensity requirements
- Business model economics
These similarities make growth rate differences more meaningful and PEG comparisons more valid.
Evaluating High-Growth Companies
Traditional value metrics often fail when analyzing high-growth companies because elevated P/E ratios appear expensive by conventional standards. A company trading at a P/E of 50 seems overpriced until you discover it’s growing earnings at 60% annually, producing a PEG of 0.83.
The PEG ratio provides a framework for distinguishing between:
- Justified premium valuations: High P/E supported by proportionally higher growth
- Speculative bubbles: High P/E unsupported by growth fundamentals
This distinction proved particularly valuable during the technology boom of the late 1990s and again during the 2020-2021 growth stock surge. Companies with PEG ratios above 3.0 experienced severe corrections when growth slowed, while those maintaining PEG ratios near 1.0 demonstrated resilience.
Screening for Value in Growth-Oriented Sectors
Investment screening processes benefit from PEG ratio filters that identify potentially undervalued opportunities within growth sectors. A typical screen might include:
- Market cap above $2 billion (liquidity requirement)
- Positive earnings (PEG ratio applicability)
- Projected growth above 15% (growth threshold)
- PEG ratio below 1.0 (value criterion)
- Industry-specific filters
This approach combines growth investing principles with value discipline, seeking companies where the market hasn’t fully recognized growth potential. Similar methodologies appear in evidence-based investing strategies that prioritize quantitative metrics.
Monitoring Portfolio Holdings
The PEG ratio serves as an early warning system for existing positions. Rising PEG ratios signal that either:
- Stock price appreciation has outpaced growth expectations (valuation expansion)
- Growth projections have declined (fundamental deterioration)
Both scenarios warrant review. A position that entered the portfolio at a PEG of 0.8 but now trades at 2.5 has experienced significant multiple expansion. This suggests reduced upside potential and increased downside risk if growth disappoints.
Regular PEG monitoring creates discipline around position sizing and profit-taking decisions. When a stock’s PEG ratio exceeds industry averages by 50% or more, consider trimming the position to lock in gains, a practical application of risk management principles.
Identifying Sector Rotation Opportunities
Relative PEG ratios across sectors reveal rotation opportunities as market conditions shift. During economic expansions, cyclical sectors often show improving growth rates that compress PEG ratios before stock prices fully adjust. Conversely, defensive sectors may exhibit PEG expansion as growth slows.
Comparing average PEG ratios across S&P 500 sectors provides macro-level insight:
- Technology sector average PEG: 1.8
- Healthcare sector average PEG: 1.5
- Financial sector average PEG: 1.2
- Utility sector average PEG: 2.1
These relationships shift with economic cycles, interest rate environments, and technological disruption. Sectors trading below their historical average PEG ratios may offer tactical opportunities, particularly when combined with fundamental analysis confirming improving business conditions.
Strategic takeaway: The PEG ratio works best as a comparative tool within defined contexts, same industry, similar business models, comparable growth stages, rather than as an absolute valuation measure across all market conditions.
Limitations and Drawbacks of the PEG Ratio
Despite its analytical power, the PEG ratio contains significant limitations that can distort investment decisions when applied without critical judgment. Understanding these constraints prevents overreliance on a single metric and promotes more robust analysis.
Dependence on Earnings Growth Estimates
The PEG ratio’s greatest weakness lies in its reliance on projected earnings growth—inherently uncertain forecasts subject to analyst bias and forecasting error. Research consistently shows that analyst estimates exhibit optimistic bias, with actual earnings growth falling short of projections approximately 60% of the time [1].
This creates systematic overvaluation risk. If analysts project 25% growth but the company delivers only 15%, a stock that appeared undervalued at a PEG of 0.8 actually trades at 1.3 using realized growth rates. The investment thesis collapses because the foundation, the growth assumption, proved incorrect.
The problem intensifies with longer projection horizons. One-year estimates show reasonable accuracy (average error of 10-15%), but three-year projections often miss by 30% or more. Five-year estimates become little more than educated guesses, particularly for companies in rapidly evolving industries.
Mitigation strategy: Calculate PEG ratios using conservative growth estimates below consensus projections. Apply a 20-30% haircut to analyst forecasts to account for optimism bias, creating a margin of safety in valuation assessments.
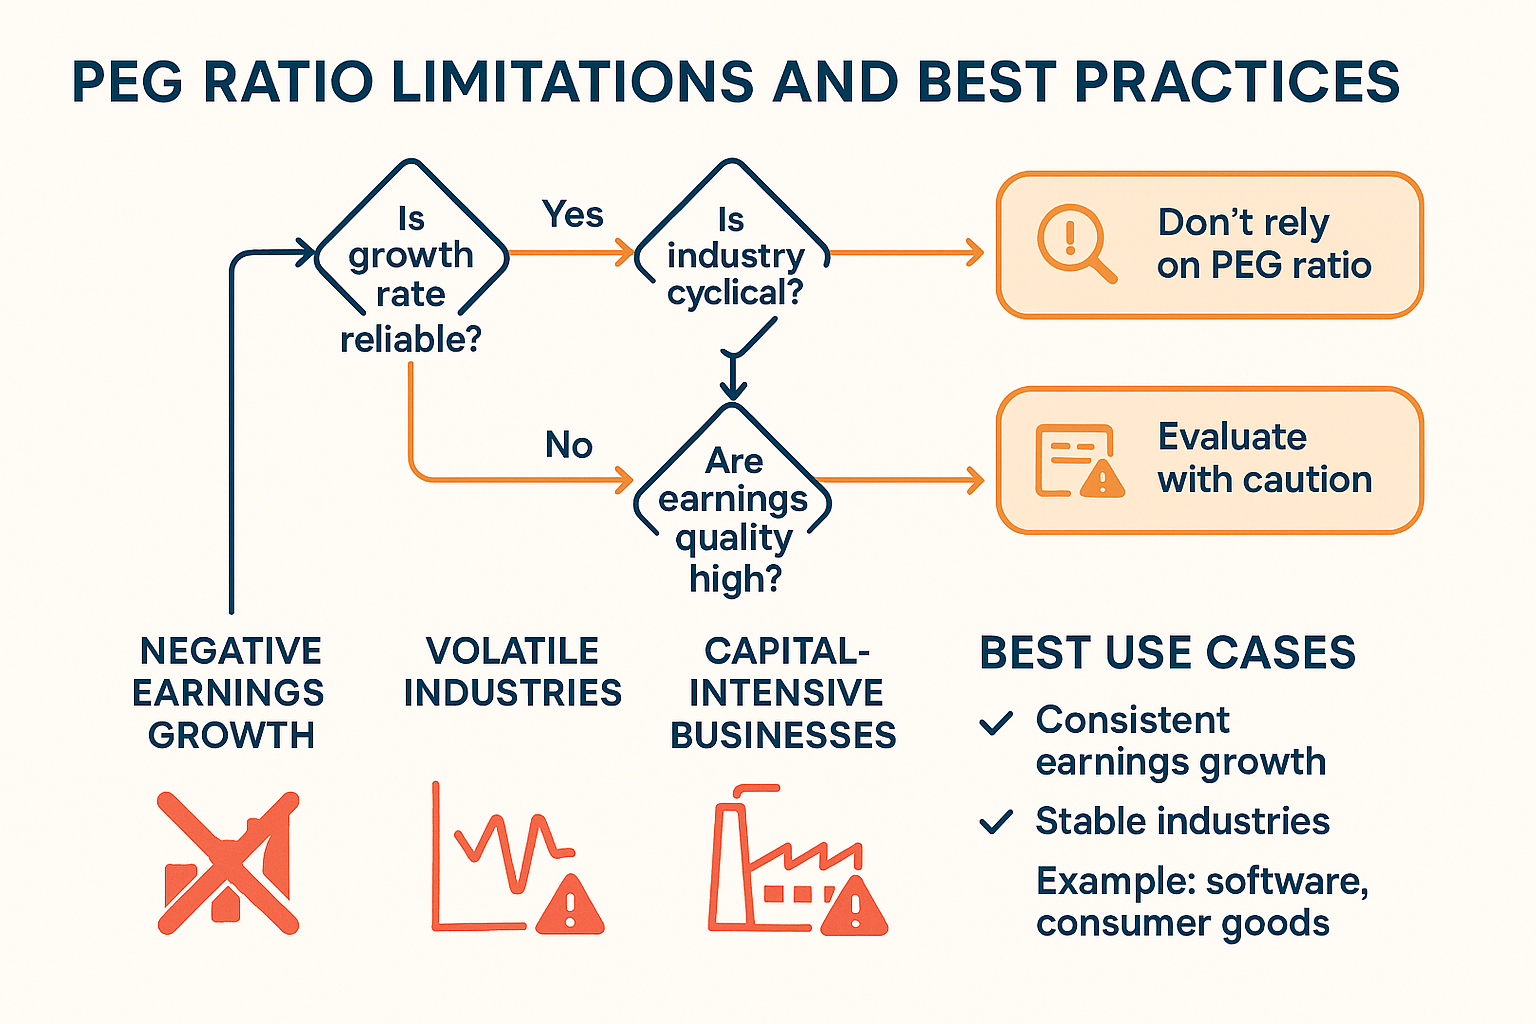
Inability to Handle Negative Earnings
The PEG ratio becomes mathematically meaningless when companies report negative earnings or negative growth rates. Dividing a negative P/E ratio by a growth rate produces nonsensical results that cannot inform investment decisions.
This eliminates the metric’s usefulness for:
- Unprofitable growth companies (common in early-stage technology)
- Turnaround situations (declining earnings before recovery)
- Cyclical companies at earnings troughs
- Companies experiencing temporary earnings disruptions
Many of the most compelling investment opportunities fall into these categories. Amazon traded at negative or extremely high P/E ratios for years during its growth phase, making PEG ratio analysis impossible despite its extraordinary long-term returns.
Alternative metrics better serve these situations:
- Price-to-Sales ratio for unprofitable growth companies
- Price-to-Book ratio for asset-heavy businesses
- Enterprise Value-to-EBITDA for capital-intensive industries
- Free cash flow analysis for mature companies
Neglect of Capital Requirements
The PEG ratio treats all earnings growth as equivalent, ignoring the capital investment required to generate that growth. A company growing earnings at 20% while consuming massive amounts of capital differs fundamentally from one that achieves the same growth with minimal investment.
Consider two companies, both projecting 20% earnings growth:
Company A (Capital-Intensive):
- Requires $500 million in annual capital expenditures
- Generates $100 million in free cash flow
- High reinvestment burden limits shareholder returns
Company B (Capital-Light):
- Requires $50 million in annual capital expenditures
- Generates $400 million in free cash flow
- Strong cash generation funds dividends and buybacks
Both show identical PEG ratios, but Company B offers superior investment quality because earnings convert efficiently to shareholder value. Company A’s growth requires continuous capital infusions that dilute returns.
This limitation connects to broader capital allocation strategies that evaluate how effectively companies deploy resources. High-quality growth requires minimal capital consumption, a distinction the PEG ratio cannot capture.
Interest Rate Sensitivity
The PEG ratio lacks explicit adjustment for interest rate environments, yet both components, P/E ratios and growth valuations, respond dramatically to rate changes. Rising interest rates compress P/E multiples across the market because future earnings get discounted at higher rates, reducing present value.
This creates interpretation challenges. A PEG ratio of 1.2 might signal overvaluation in a 5% interest rate environment, but represent fair value when rates fall to 2%. The metric itself hasn’t changed, but the appropriate valuation framework has shifted.
Growth stocks show particular sensitivity because their value derives primarily from distant future earnings. When discount rates rise, those future cash flows lose present value more severely than near-term earnings, causing growth stock P/E ratios to compress independent of company fundamentals.
Historical context: During the 2022 interest rate surge, technology stocks with PEG ratios near 1.0 declined 30-50% despite unchanged growth projections. The PEG ratio failed to signal risk because it didn’t account for the changing rate environment.
Industry-Specific Limitations
Certain industries render PEG ratio analysis problematic due to structural business characteristics:
Cyclical Industries: Companies in sectors like energy, materials, and industrials experience dramatic earnings swings tied to commodity prices and economic cycles. Using peak earnings to calculate PEG ratios produces artificially low readings that disappear when cycles turn. The growth rate becomes meaningless because it reflects cyclical recovery rather than sustainable expansion.
Financial Services: Banks and insurance companies show earnings volatility from loan loss provisions, investment gains, and regulatory capital requirements. Growth rates fluctuate with economic conditions rather than fundamental business expansion, making PEG comparisons unreliable.
Utilities and REITs: These sectors distribute most earnings as dividends, limiting reinvestment for growth. Low growth rates produce high PEG ratios that suggest overvaluation, yet the business models prioritize current income over expansion. The PEG framework misses this fundamental difference.
Short-Term Focus Bias
PEG ratios typically use 1-3 year growth projections, creating bias toward companies with near-term earnings momentum at the expense of longer-term value creation. This short-term orientation can favor:
- Companies pulling forward earnings through accounting choices
- Businesses sacrificing long-term positioning for quarterly results
- Cyclical companies at peak earnings (before inevitable decline)
Meanwhile, companies making strategic investments that temporarily depress earnings but build lasting competitive advantages appear overvalued. Amazon’s consistent reinvestment strategy produced elevated PEG ratios during its growth phase, yet those investments created the dominant platform that drives today’s profitability.
Understanding these limitations doesn’t invalidate the PEG ratio; it contextualizes the metric within a broader analytical framework. No single measure captures investment quality completely. The PEG ratio contributes a valuable perspective when combined with earnings quality analysis, cash flow assessment, and competitive positioning evaluation.
Critical insight: Use the PEG ratio as a screening tool and starting point for analysis, not as a definitive buy/sell signal. Companies with attractive PEG ratios warrant deeper investigation; those with unfavorable readings deserve skepticism but not automatic rejection.
PEG Ratio vs P/E Ratio: Key Differences
The relationship between PEG and P/E ratios reveals fundamental differences in valuation philosophy, static versus dynamic, absolute versus relative, current versus forward-looking. Understanding these distinctions clarifies when each metric provides superior insight.
What the P/E Ratio Tells You
The Price-to-Earnings ratio measures how much investors pay for each dollar of current earnings. A P/E of 15 means the stock price equals 15 times annual earnings per share. This provides a snapshot valuation, what the market values the company at this moment based on recent profitability.
The P/E ratio answers: “How expensive is this stock relative to its current earnings?”
This simplicity creates both strength and weakness. The metric requires minimal inputs (price and earnings) and allows quick comparison across companies. However, it ignores prospects entirely. A company with declining earnings shows the same P/E as one with stable earnings at identical price-to-earnings multiples, despite vastly different investment quality.
What the PEG Ratio Adds
The PEG ratio incorporates the critical missing element: growth expectations. By dividing P/E by projected earnings growth, it transforms static valuation into a dynamic assessment.
The PEG ratio answers: “How expensive is this stock relative to its earnings AND its growth potential?”
This forward-looking perspective reveals whether high P/E ratios reflect justified optimism or speculative excess. Consider these scenarios:
Scenario 1: Mature Utility Company
- P/E ratio: 15
- Growth rate: 3%
- PEG ratio: 5.0
- Interpretation: Expensive relative to limited growth
Scenario 2: Technology Growth Company
- P/E ratio: 30
- Growth rate: 35%
- PEG ratio: 0.86
- Interpretation: Reasonable value despite high P/E
The P/E ratio alone suggests the utility offers better value (15 vs. 30). The PEG ratio reveals the technology company provides superior value-for-growth, justifying its higher multiple through faster earnings expansion.
When to Use Each Metric
Use P/E Ratio When:
- Comparing mature companies with stable, predictable earnings
- Evaluating dividend-focused investments where growth matters less
- Analyzing companies in stable industries (utilities, consumer staples)
- Seeking current income rather than capital appreciation
- Growth rates are negligible or highly uncertain
Use the PEG Ratio When:
- Comparing growth-oriented companies with different expansion rates
- Evaluating technology, healthcare, or consumer discretionary stocks
- Assessing whether premium valuations reflect justified growth
- Screening for undervalued opportunities in growth sectors
- Growth projections are reasonably reliable
Complementary Analysis
The most effective approach combines both metrics within a comprehensive valuation analysis. The P/E ratio establishes a baseline valuation level, while the PEG ratio contextualizes whether that level makes sense given growth prospects.
A complete assessment might include:
- P/E ratio for absolute valuation level
- PEG ratio for growth-adjusted valuation
- Price-to-Book ratio for asset backing
- Dividend yield for income generation (relevant for dividend investing)
- Free cash flow yield for cash generation efficiency
This multi-metric framework prevents overreliance on any single measure and captures different dimensions of investment value. Similar comprehensive approaches appear in fundamental analysis methodologies that evaluate companies from multiple perspectives.
Analytical framework: Use P/E ratios to identify absolute valuation levels, then apply PEG ratios to determine whether those levels reflect appropriate pricing given growth expectations. This two-step process combines the strengths of both metrics while mitigating individual weaknesses.
Real-World Examples of PEG Ratio Analysis
Practical application demonstrates how the PEG ratio functions in actual investment scenarios, revealing both its analytical power and its limitations when confronted with market complexity.
Example 1: Technology Sector Comparison (2025)
Consider three major technology companies with different business models and growth trajectories:
Company Alpha (Cloud Infrastructure):
- Stock Price: $180
- Earnings Per Share: $6.00
- P/E Ratio: 30
- Projected 3-Year Growth: 28%
- PEG Ratio: 1.07
Company Beta (Software-as-a-Service):
- Stock Price: $95
- Earnings Per Share: $2.50
- P/E Ratio: 38
- Projected 3-Year Growth: 42%
- PEG Ratio: 0.90
Company Gamma (Hardware Manufacturing):
- Stock Price: $145
- Earnings Per Share: $8.50
- P/E Ratio: 17
- Projected 3-Year Growth: 12%
- PEG Ratio: 1.42
Analysis: Company Beta shows the most attractive PEG ratio despite having the highest P/E multiple. Its superior growth rate justifies the premium valuation. Company Gamma appears cheapest by P/E ratio but shows the highest PEG ratio, suggesting its low multiple reflects limited growth prospects rather than a value opportunity.
This comparison illustrates the PEG ratio’s core value proposition, revealing that the most expensive stock by traditional metrics may offer the best value when growth is considered. An investor focused solely on P/E ratios would miss Company Beta’s superior risk-reward profile.
However, deeper analysis reveals important context. Company Beta operates in a competitive SaaS market where customer acquisition costs are rising, and churn rates are increasing. The 42% growth projection assumes successful product launches and market share gains that may not materialize. The attractive PEG ratio depends entirely on optimistic assumptions.
Company Gamma’s hardware business generates substantial free cash flow with minimal capital requirements, funding consistent dividend growth. While the PEG ratio suggests overvaluation, the business quality and cash generation capacity provide value not captured by growth metrics alone.
Investment decision: The PEG ratio identifies Company Beta as worthy of deeper investigation, but the final decision requires evaluating competitive positioning, business model sustainability, and execution risk factors beyond the metric’s scope.
Example 2: Retail Sector Divergence
Two retailers demonstrate how business model differences affect PEG ratio interpretation:
Traditional Retailer:
- P/E Ratio: 12
- Projected Growth: 5%
- PEG Ratio: 2.4
- Business Model: Brick-and-mortar stores, declining foot traffic
E-Commerce Retailer:
- P/E Ratio: 45
- Projected Growth: 35%
- PEG Ratio: 1.29
- Business Model: Online platform, expanding market share
The traditional retailer’s low P/E ratio masks fundamental deterioration. Its 5% growth projection reflects analyst optimism rather than a realistic assessment given secular headwinds. The 2.4 PEG ratio correctly signals that even the modest valuation appears expensive relative to limited prospects.
The e-commerce retailer’s elevated P/E ratio initially suggests overvaluation, but the 1.29 PEG ratio indicates reasonable pricing given growth momentum. However, this company requires massive capital expenditure for fulfillment centers and technology infrastructure—a limitation the PEG ratio doesn’t capture.
This example demonstrates how PEG ratios can identify relative value within a sector experiencing disruption, but also shows the metric’s blindness to capital intensity and business model sustainability.
Example 3: The Growth Trap
A cautionary example from a biotech company illustrates PEG ratio limitations:
Initial Analysis (January 2024):
- P/E Ratio: 25
- Analyst Projected Growth: 50% (based on drug pipeline)
- PEG Ratio: 0.50
- Investment Thesis: Significantly undervalued given growth potential
Actual Results (January 2025):
- Clinical trial failure for lead drug candidate
- Revised Growth Projection: -15% (earnings decline)
- Stock Price Decline: -62%
- PEG Ratio: Meaningless (negative growth)
The initially attractive PEG ratio proved misleading because the growth projection rested on binary outcomes (drug approval) rather than sustainable business fundamentals. The metric correctly reflected analyst expectations but couldn’t account for execution risk and the probability-weighted nature of biotech returns.
This scenario appears frequently in high-risk growth sectors where projected growth depends on specific catalysts—product launches, regulatory approvals, market adoption—rather than established business momentum. The PEG ratio captures the upside scenario while ignoring downside probability.
Lesson learned: Attractive PEG ratios in speculative growth situations require additional analysis of the probability distribution of outcomes, not just the base case projection. Risk-adjusted expected growth rates provide more reliable inputs than optimistic point estimates.
Example 4: Cyclical Misinterpretation
An energy company demonstrates PEG ratio failure in cyclical industries:
Analysis at Cycle Peak:
- P/E Ratio: 8 (based on peak earnings)
- Projected Growth: 15% (assuming sustained commodity prices)
- PEG Ratio: 0.53
- Apparent Signal: Significantly undervalued
Reality Check:
- Earnings at cyclical peak, not sustainable level
- Growth projection assumes a continued favorable commodity environment
- Normalized earnings are 40% below the current level
- Normalized PEG Ratio: 2.1 (overvalued)
The low PEG ratio reflected temporary earnings elevation rather than structural undervaluation. Investors who bought based on the attractive metric suffered losses when commodity prices normalized, and earnings reverted to historical averages.
Cyclical companies require normalized earnings analysis—adjusting for where the company sits in the economic cycle. The PEG ratio using peak earnings produces systematically misleading signals that disappear when cycles turn. Similar analytical challenges appear in economic profit assessment during different cycle phases.
Practical application: For cyclical companies, calculate PEG ratios using normalized earnings (average through the complete cycle) rather than current earnings. This produces more stable and reliable valuation signals.
These real-world examples demonstrate that the PEG ratio provides a valuable perspective but requires contextual interpretation. The metric identifies questions to investigate rather than providing definitive answers. Companies with attractive PEG ratios deserve deeper analysis; those with unfavorable readings warrant skepticism but may still offer value through dimensions the ratio doesn’t capture.
How to Use the PEG Ratio in Your Investment Strategy
Integrating the PEG ratio into practical investment processes requires systematic application within a broader analytical framework. The metric delivers maximum value when combined with complementary analysis rather than used in isolation.
Building a PEG-Based Screening Process
Effective stock screening uses the PEG ratio as a filter to identify candidates for deeper research:
Step 1: Define Universe
Start with a focused market segment—specific sector, market cap range, or geographic region. The PEG ratio works best within comparable groups, so narrow the universe to companies with similar characteristics.
Example parameters:
- Technology sector companies
- Market cap above $5 billion
- Positive earnings (trailing 12 months)
- Analyst coverage of 5+ analysts (ensures reliable estimates)
Step 2: Apply PEG Filter
Screen for companies with PEG ratios below 1.0 or below the sector average. This identifies potential value opportunities where growth hasn’t been fully recognized in current pricing.
Additional quantitative filters might include:
- Revenue growth above 10% (confirms top-line momentum)
- Gross margins above industry median (indicates competitive strength)
- Debt-to-equity below 0.5 (financial stability)
Step 3: Verify Growth Quality
Examine the components driving projected growth:
- Is growth organic or acquisition-driven?
- Does growth require proportional capital investment?
- Are growth projections consistent across multiple analyst sources?
- Has the company met or exceeded growth targets historically?
This verification step prevents false positives where attractive PEG ratios rest on unreliable growth assumptions.
Step 4: Conduct Fundamental Analysis
The screening process identifies candidates; fundamental analysis determines investment merit. Evaluate:
- Competitive positioning and sustainable advantages
- Management quality and capital allocation track record
- Balance sheet strength and financial flexibility
- Industry dynamics and secular trends
- Valuation using multiple methodologies
This comprehensive approach mirrors evidence-based investing principles that combine quantitative screening with qualitative assessment.
Portfolio Construction Guidelines
The PEG ratio informs position sizing and portfolio balance decisions:
Concentration Decisions:
Companies with PEG ratios significantly below 1.0 (0.5-0.7 range) and high-conviction fundamental cases may warrant larger position sizes (5-8% of portfolio). The combination of quantitative attractiveness and qualitative strength justifies increased allocation.
Conversely, holdings with PEG ratios approaching 1.5 deserve reduced weights or elimination, particularly if fundamental deterioration accompanies multiple expansions.
Sector Allocation:
Compare average PEG ratios across sectors to identify relative value:
- Sectors with below-average PEG ratios may deserve overweight positions
- Sectors with elevated PEG ratios relative to history suggest caution
- Extreme PEG divergence between sectors signals potential rotation opportunities
This tactical approach complements strategic diversification strategies that maintain exposure across market segments while tilting toward relative value.
Monitoring and Rebalancing Framework
Establish systematic review processes using PEG ratio changes as signals:
Quarterly Review Protocol:
- Recalculate PEG ratios for all holdings using updated estimates
- Identify positions where PEG has expanded by 50% or more
- Investigate cause: multiple expansion or growth deterioration
- Determine whether the change reflects temporary factors or a fundamental shift
- Adjust position size or exit if valuation no longer justified
Trigger Points:
Set specific PEG thresholds that prompt action:
- PEG above 2.0: Reduce position by 50% or exit entirely
- PEG 1.5-2.0: Trim to minimum position size, monitor closely
- PEG 1.0-1.5: Maintain current allocation
- PEG below 1.0: Consider adding to the position
- PEG below 0.7: Investigate for potential increase
These mechanical rules create discipline and prevent emotional decision-making during market volatility.
Combining PEG with Other Metrics
The PEG ratio gains power when integrated with complementary analysis:
PEG + Free Cash Flow Yield:
Companies with low PEG ratios AND high free cash flow yields offer dual attractions, growth at reasonable prices plus strong cash generation. This combination indicates quality growth that converts to shareholder value.
PEG + Return on Invested Capital (ROIC):
High ROIC companies (above 15%) with attractive PEG ratios represent the highest-quality opportunities. They generate strong returns on capital while trading at reasonable valuations relative to growth.
PEG + Dividend Growth:
For income-focused strategies, combine PEG analysis with dividend growth assessment. Companies with low PEG ratios and consistent dividend increases offer both capital appreciation potential and rising income streams.
PEG + Technical Analysis:
Use PEG ratios to identify fundamentally attractive candidates, then apply technical analysis to optimize entry timing. Stocks with PEG ratios below 1.0 that also show positive momentum and strong relative strength offer improved risk-reward profiles.
Risk Management Integration
The PEG ratio informs risk management through position sizing and stop-loss placement:
Position Sizing Formula:
Base position size = (1 / PEG ratio) × Base allocation
Example: If the base allocation is 3% and the PEG ratio is 0.75:
Position size = (1 / 0.75) × 3% = 4%
This formula automatically increases allocation to more attractive valuations while limiting exposure to expensive stocks.
Stop-Loss Adjustment:
Tighter stops for high PEG ratio positions (15-20% below entry) protect against overvaluation risk. Wider stops for low PEG positions (25-30% below entry) allow time for market recognition of value.
Tax-Efficient Implementation
Consider tax implications when acting on PEG ratio signals:
In Taxable Accounts:
- Delay selling appreciated positions with rising PEG ratios until long-term capital gains treatment applies
- Harvest tax losses from positions with deteriorating PEG ratios and fundamentals
- Use PEG analysis to identify replacement securities in different sectors (avoid wash sales)
In Tax-Advantaged Accounts:
- Trade more actively based on PEG signals without tax friction
- Concentrate higher-turnover PEG-based strategies in IRAs and 401(k)s
- Use taxable accounts for buy-and-hold positions less sensitive to PEG changes
This tax-aware approach maximizes after-tax returns while maintaining analytical discipline. Similar considerations appear in capital gains tax planning strategies.
Implementation insight: The PEG ratio serves as one input within a comprehensive investment process, not a standalone decision rule. Use it to generate ideas, validate hypotheses, and monitor positions, but always within the context of broader fundamental analysis and portfolio management principles.
📊 PEG Ratio Calculator
Calculate the Price/Earnings-to-Growth ratio to evaluate stock valuation
💡 What This Means
Conclusion
The PEG ratio stands as a powerful yet nuanced tool in the investor’s analytical arsenal, bridging the gap between traditional valuation metrics and growth-oriented assessment. By dividing the P/E ratio by projected earnings growth, this metric reveals whether premium valuations reflect justified optimism or speculative excess, a distinction that separates successful growth investing from expensive mistakes.
The math behind the PEG ratio is elegantly simple: take what investors pay for current earnings and adjust for how quickly those earnings will expand. This growth-adjusted perspective transforms static snapshots into dynamic evaluations, particularly valuable when comparing companies within the same industry that show different expansion trajectories.
However, effectiveness depends on disciplined application within a proper context. The metric delivers maximum value when:
- Comparing companies in the same industry with positive earnings
- Growth projections rest on sustainable business fundamentals
- Analysis incorporates multiple timeframes and conservative estimates
- Results combine with complementary metrics to evaluate business quality
The limitations are equally important to understand. Reliance on uncertain growth forecasts, inability to handle negative earnings, neglect of capital requirements, and industry-specific challenges all constrain the PEG ratio’s applicability. No single metric captures investment quality completely; the PEG ratio contributes one perspective within comprehensive analysis.
Actionable next steps for implementing PEG ratio analysis:
- Build systematic screening processes that use PEG ratios below 1.0 as initial filters for identifying potentially undervalued growth opportunities
- Establish monitoring frameworks that track PEG ratio changes quarterly and trigger reviews when ratios expand beyond 1.5
- Combine PEG analysis with cash flow assessment to ensure growth converts to shareholder value rather than consuming capital
- Apply sector-specific benchmarks rather than universal thresholds, recognizing that appropriate PEG ratios vary by industry
- Stress-test growth assumptions by calculating PEG ratios using conservative estimates 20-30% below consensus projections
The journey toward financial literacy and wealth building requires mastering tools that reveal value where others see only price. The PEG ratio, properly understood and carefully applied, helps distinguish between companies growing their way to justified valuations and those racing toward inevitable disappointment.
Start incorporating PEG ratio analysis into your investment process today, not as a standalone decision rule, but as one component of the data-driven framework that transforms market noise into actionable insight. The math behind money rewards those who look beyond surface-level metrics to understand the relationship between price, earnings, and growth.
References
[1] Harvard Business Review – “The Accuracy of Analyst Forecasts” – Research on systematic optimism bias in earnings projections
Author Bio
Max Fonji is the founder of The Rich Guy Math, a data-driven financial education platform dedicated to teaching the mathematical principles behind wealth building and evidence-based investing. With a background in financial analysis and a passion for making complex concepts accessible, Max helps investors understand the cause-and-effect relationships that drive long-term financial success.
Educational Disclaimer
This article is provided for educational and informational purposes only and does not constitute financial, investment, tax, or legal advice. The PEG ratio analysis and examples presented represent general educational content and should not be interpreted as specific investment recommendations.
All investing involves risk, including potential loss of principal. Past performance does not guarantee future results. Growth projections and analyst estimates discussed in this article are inherently uncertain and may not materialize. Before making investment decisions, consult with qualified financial, tax, and legal professionals who understand your specific circumstances and objectives.
The Rich Guy Math does not provide personalized investment advice or recommendations. Always conduct thorough due diligence and consider your risk tolerance, time horizon, and financial goals before investing.
Frequently Asked Questions About PEG Ratio
What is a good PEG ratio for a stock?
A PEG ratio below 1.0 generally indicates potential undervaluation, suggesting the stock trades at a discount relative to its growth prospects. A ratio of 1.0 represents fair value where the P/E ratio matches the growth rate. Ratios above 1.5 typically signal overvaluation, though industry context matters significantly. Technology companies often trade at higher PEG ratios (1.5–2.0) than utilities or consumer staples. The “good” threshold depends on sector norms, business quality, and growth reliability.
How do you calculate the PEG ratio?
Calculate the PEG ratio by dividing a company’s Price-to-Earnings (P/E) ratio by its annual earnings per share growth rate. First, determine the P/E by dividing share price by earnings per share. Then obtain the projected annual earnings growth rate—typically a 3-year analyst estimate. Divide P/E by the growth rate percentage. Example: P/E of 20 divided by 25% growth equals a PEG ratio of 0.8.
What is the difference between P/E ratio and PEG ratio?
The P/E ratio measures stock price relative to current earnings but ignores future growth. The PEG ratio adjusts valuation for expected earnings expansion. P/E gives a static snapshot, while PEG offers a dynamic, growth-adjusted view. A stock with a P/E of 30 may seem expensive until PEG shows 40% annual growth—producing a favorable 0.75 PEG.
Can you use PEG ratio for companies with negative earnings?
No. PEG ratio becomes mathematically meaningless with negative earnings or negative growth rates. The metric requires positive earnings and positive projected growth. For unprofitable companies, better alternatives include Price-to-Sales, Price-to-Book, or discounted cash flow analysis. Many high-growth tech companies temporarily remain unprofitable, making PEG analysis inappropriate.
How reliable are the growth estimates used in PEG ratios?
Growth estimates often contain optimism bias. Research shows analysts overestimate results around 60% of the time, with forecast errors averaging 10–15% for one-year estimates and 30%+ for three-year estimates. This can make stocks appear cheaper than they are. Apply a 20–30% haircut to growth projections for a margin of safety, and verify that past performance supports the forecast.
What industries are best suited for PEG ratio analysis?
PEG works best in stable, consistent-growth industries—technology, healthcare, consumer discretionary, and business services. It struggles with cyclical sectors such as energy, materials, and industrials, where earnings swing with economic cycles. Financials can also be volatile. Utilities and REITs prioritize dividends over growth, making PEG less useful. Always compare PEG ratios within the same industry.
Should I use forward or trailing earnings growth for PEG calculations?
Forward estimates provide more relevant PEG ratios because investing is forward-looking. Most investors rely on 3-year analyst growth projections. However, forward estimates introduce uncertainty. Trailing growth uses verified historical data but assumes past trends continue. The best practice: calculate both forward and trailing PEG, then investigate significant differences between the two.
Related posts:
 What Is the 3x Rent Rule & How to Calculate It (With Examples)
 Portfolio Income: Definition, Examples, Tax Rules, and Strategies
 Bookkeeping vs Accounting: What’s the Difference & Which Do You Need?
 What Is Profitability Analysis & How to Do It: Metrics, Example & Tips
 Emergency Fund vs Savings: What’s the Real Difference and Why It Matters
 Debt Service Coverage Ratio (DSCR): Formula, Meaning & Examples