Imagine running a lemonade stand all summer, working every weekend, and at the end of the season, realizing you have no idea if you actually made money. Sounds ridiculous, right? Yet thousands of business owners, and even investors, operate exactly this way, focusing on revenue while ignoring the bottom line. Profitability analysis is the financial flashlight that reveals whether your business (or investment) is truly making money or just burning through cash with a smile.
Whether you’re a small business owner, an aspiring investor, or someone looking to understand how successful companies create wealth, mastering profitability analysis is non-negotiable. It’s the difference between guessing and knowing, between hoping and planning, between surviving and thriving.
In this comprehensive guide, we’ll break down everything you need to know about profitability analysis, from the basic definition to the essential metrics and a step-by-step process anyone can follow. By the end, you’ll have the tools to evaluate any business’s financial health like a seasoned analyst. Investopedia
Key Takeaways
- Profitability analysis examines whether a business generates more money than it spends, revealing true financial health beyond surface-level revenue.
- Three core metrics dominate profitability analysis: gross profit margin, operating profit margin, and net profit margin, each revealing different aspects of business performance.e
- Regular analysis (quarterly or monthly) helps identify trends, catch problems early, and make data-driven decisions before small issues become big crises.
- Industry context matters; a 5% profit margin might be excellent in retail but concerning in software, making benchmarking essential.l
- Profitability doesn’t equal cash flow; a profitable company can still run out of money if it doesn’t manage working capital effectively.
What Is Profitability Analysis?
Profitability analysis is the systematic examination of a company’s ability to generate earnings relative to its expenses, assets, and equity over a specific period. Think of it as a financial health checkup that answers one critical question: Is this business actually making money, or just creating the illusion of success?
Unlike revenue (which only tells you how much money comes in the door), profitability analysis reveals what stays in your pocket after paying all the bills. It’s the financial equivalent of distinguishing between gross income and take-home pay on your paycheck.
Why Profitability Analysis Matters
According to the U.S. Bureau of Labor Statistics, approximately 20% of small businesses fail within their first year, and about 50% don’t make it past five years. While many factors contribute to business failure, poor financial management, specifically not understanding profitability, ranks among the top causes.
Here’s why profitability analysis is essential:
- Reveals true financial health: Revenue can be misleading. A company with $10 million in sales might be losing money on every transaction
- Guides strategic decisions: Should you expand? Cut costs? Raise prices? Profitability metrics provide the answers
- Attracts investors: Profitable businesses attract capital; unprofitable ones struggle to survive
- Identifies problems early: Declining margins often signal issues before they become crises
- Enables benchmarking: Compare your performance against competitors and industry standards
For investors evaluating stock market opportunities, profitability analysis separates companies with sustainable business models from those burning through cash with no path to profitability. insightsoftware
The Three Pillars of Profitability Metrics
Profitability analysis relies on several key metrics, but three stand out as the foundation of any financial assessment. Each reveals a different layer of business performance, like peeling an onion to understand what’s really happening beneath the surface.
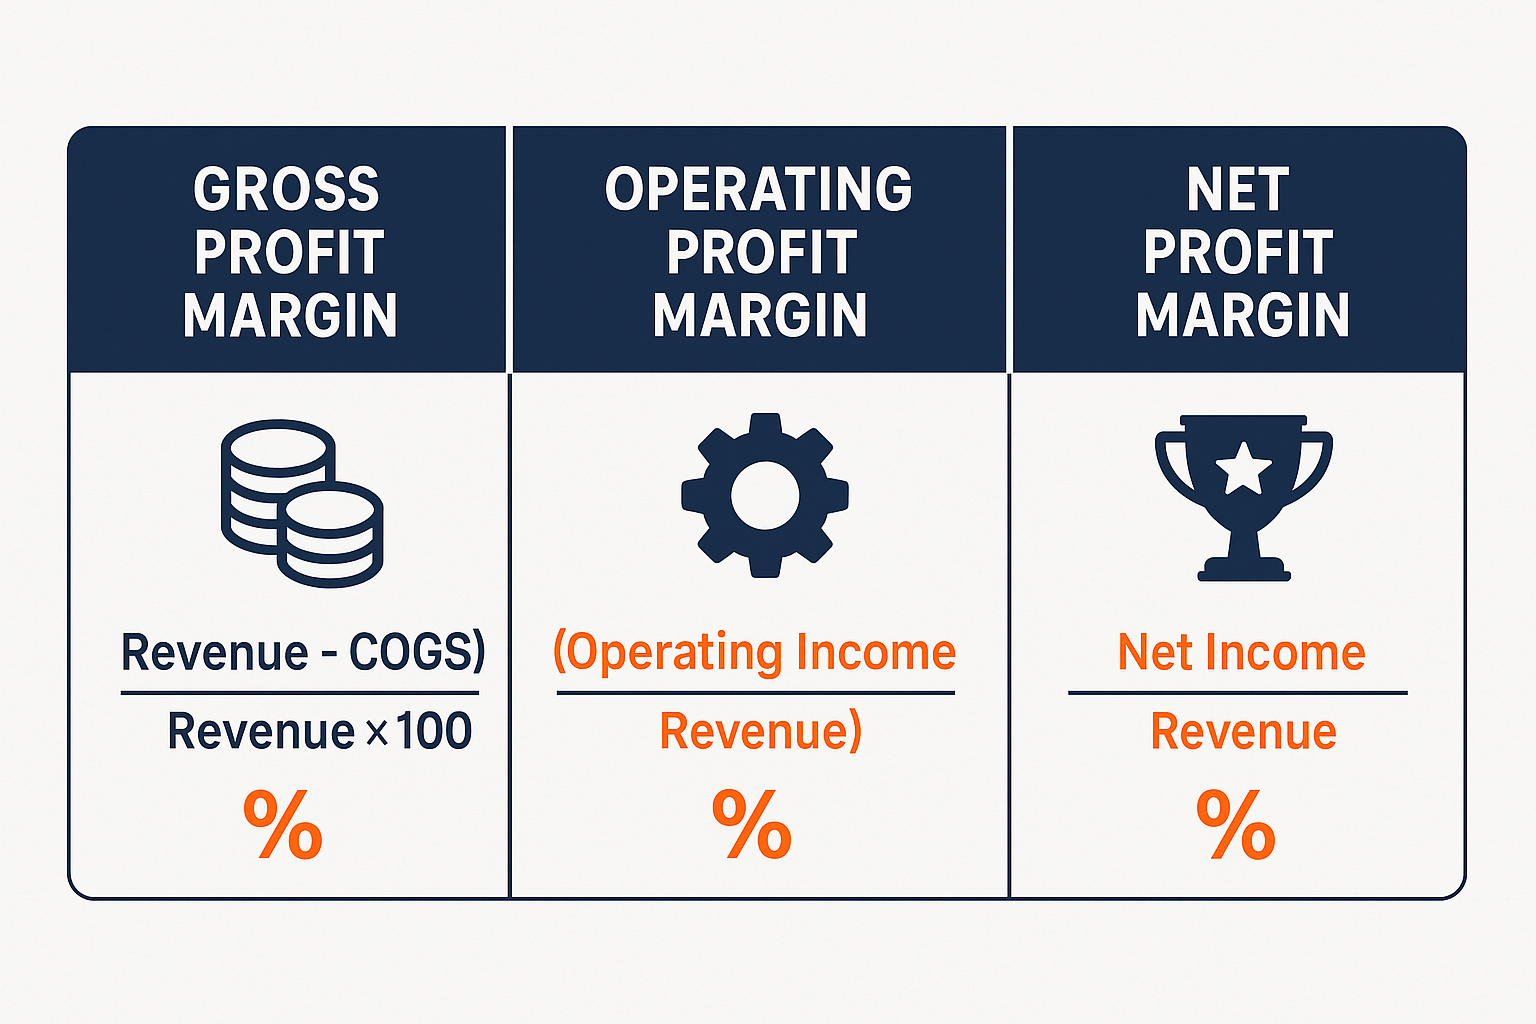
1. Gross Profit Margin
Gross profit margin measures how much money remains after subtracting the direct costs of producing goods or services (cost of goods sold, or COGS).
Formula:
Gross Profit Margin = (Revenue - COGS) / Revenue × 100Example: If your business generates $100,000 in revenue and spends $60,000 on COGS, your gross profit margin is 40% ($40,000 / $100,000 × 100).
What it tells you: This metric reveals your pricing power and production efficiency. A declining gross margin might indicate rising material costs, pricing pressure from competitors, or production inefficiencies.
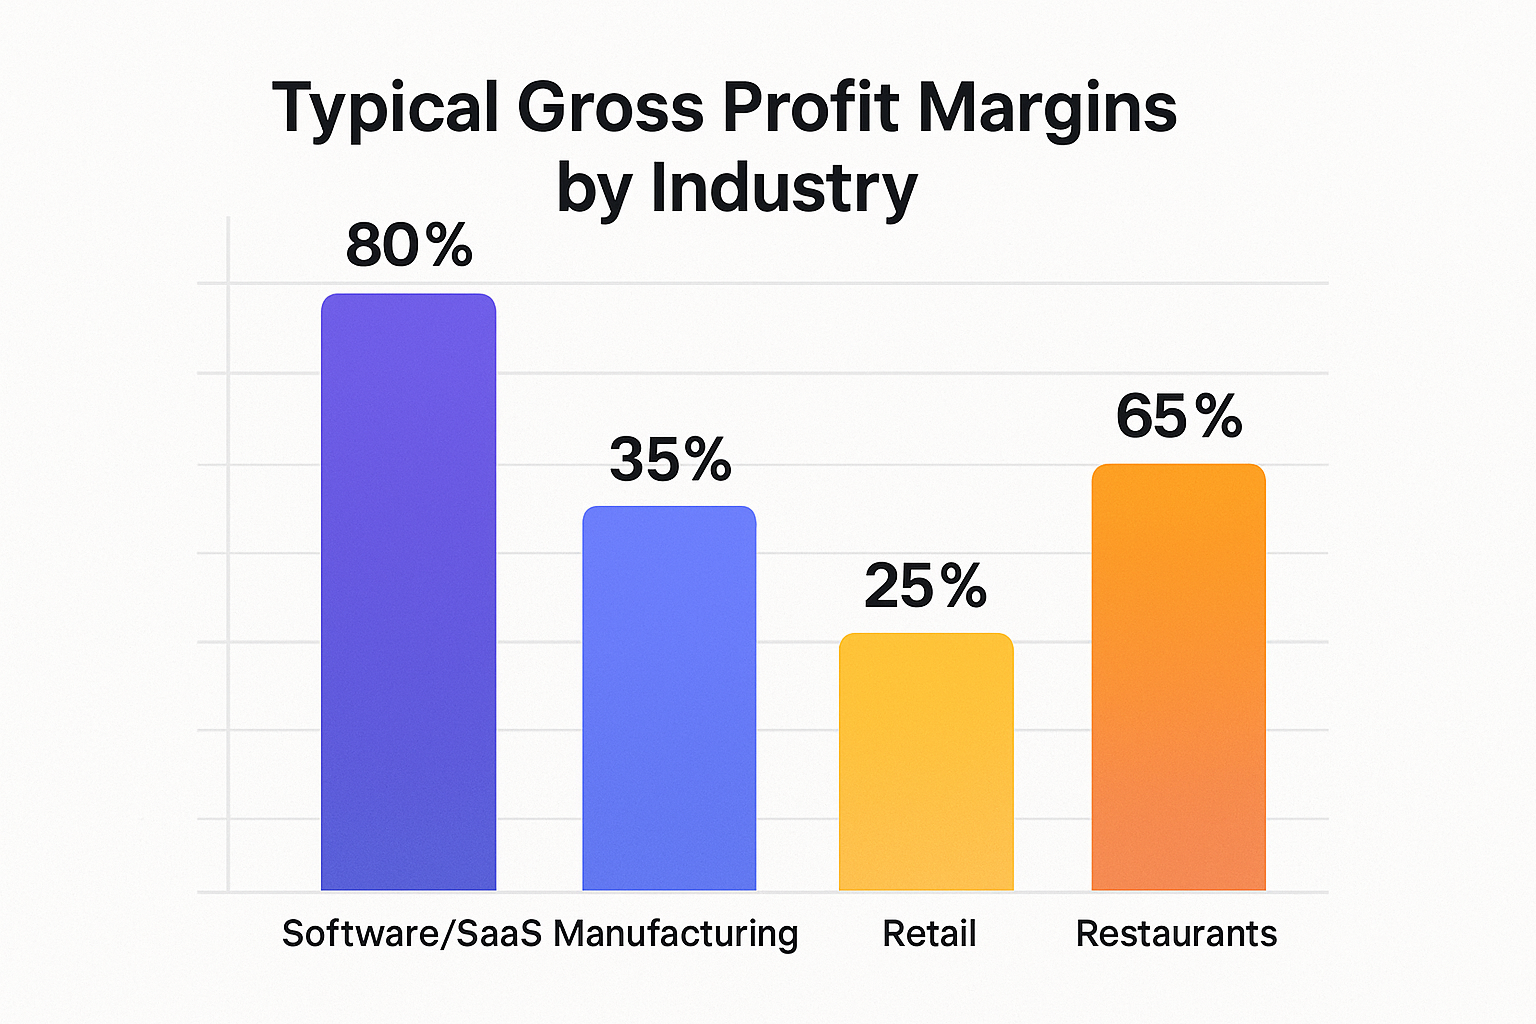
Industry benchmarks:
- Software/SaaS: 75-90% (minimal production costs)
- Retail: 20-50% (inventory and supplier costs)
- Manufacturing: 25-40% (raw materials and labor)
- Restaurants: 60-70% (food costs)
2. Operating Profit Margin
Operating profit margin (also called EBIT margin, Earnings Before Interest and Taxes) shows profitability after accounting for operating expenses like salaries, rent, marketing, and administrative costs.
Formula:
Operating Profit Margin = Operating Income / Revenue × 100Example: If your revenue is $100,000, COGS is $60,000, and operating expenses are $25,000, your operating profit is $15,000, giving you a 15% operating margin.
What it tells you: This metric reveals how efficiently management runs the business. It strips out financing decisions and tax strategies to focus purely on operational performance.
A company might have excellent gross margins but poor operating margins if it’s spending too much on overhead, marketing, or administrative bloat.
3. Net Profit Margin
Net profit margin is the ultimate bottom-line metric, showing what percentage of revenue becomes actual profit after all expenses, including interest, taxes, and one-time charges.
Formula:
Net Profit Margin = Net Income / Revenue × 100Example: If your revenue is $100,000 and your net income (after all expenses) is $10,000, your net profit margin is 10%.
What it tells you: This is the most comprehensive profitability measure. It reveals the true earning power of the business and what shareholders (or owners) actually keep.
For investors seeking passive income through dividend investing, net profit margin is crucial; companies can only sustain dividends if they generate consistent net profits.
Beyond the Big Three: Additional Profitability Metrics
While gross, operating, and net profit margins form the foundation, several other metrics provide valuable insights:
Return on Assets (ROA)
ROA measures how efficiently a company uses its assets to generate profit.
Formula:
ROA = Net Income / Total Assets × 100A 5% ROA means the company generates $5 in profit for every $100 in assets. Higher is better, and this metric is particularly useful for comparing capital-intensive businesses.
Return on Equity (ROE)
ROE shows how much profit a company generates with shareholders’ equity.
Formula:
ROE = Net Income / Shareholders' Equity × 100This metric matters tremendously to investors because it reveals returns on their invested capital. Warren Buffett famously seeks companies with consistently high ROE (15%+ sustained over many years).
EBITDA Margin
EBITDA (Earnings Before Interest, Taxes, Depreciation, and Amortization) margin strips out non-cash charges to show operational cash-generating ability.
Formula:
EBITDA Margin = EBITDA / Revenue × 100This metric is particularly useful for comparing companies with different capital structures or depreciation schedules.
How to Conduct a Profitability Analysis: Step-by-Step Guide
Ready to analyze profitability like a professional analyst? Follow this systematic approach:
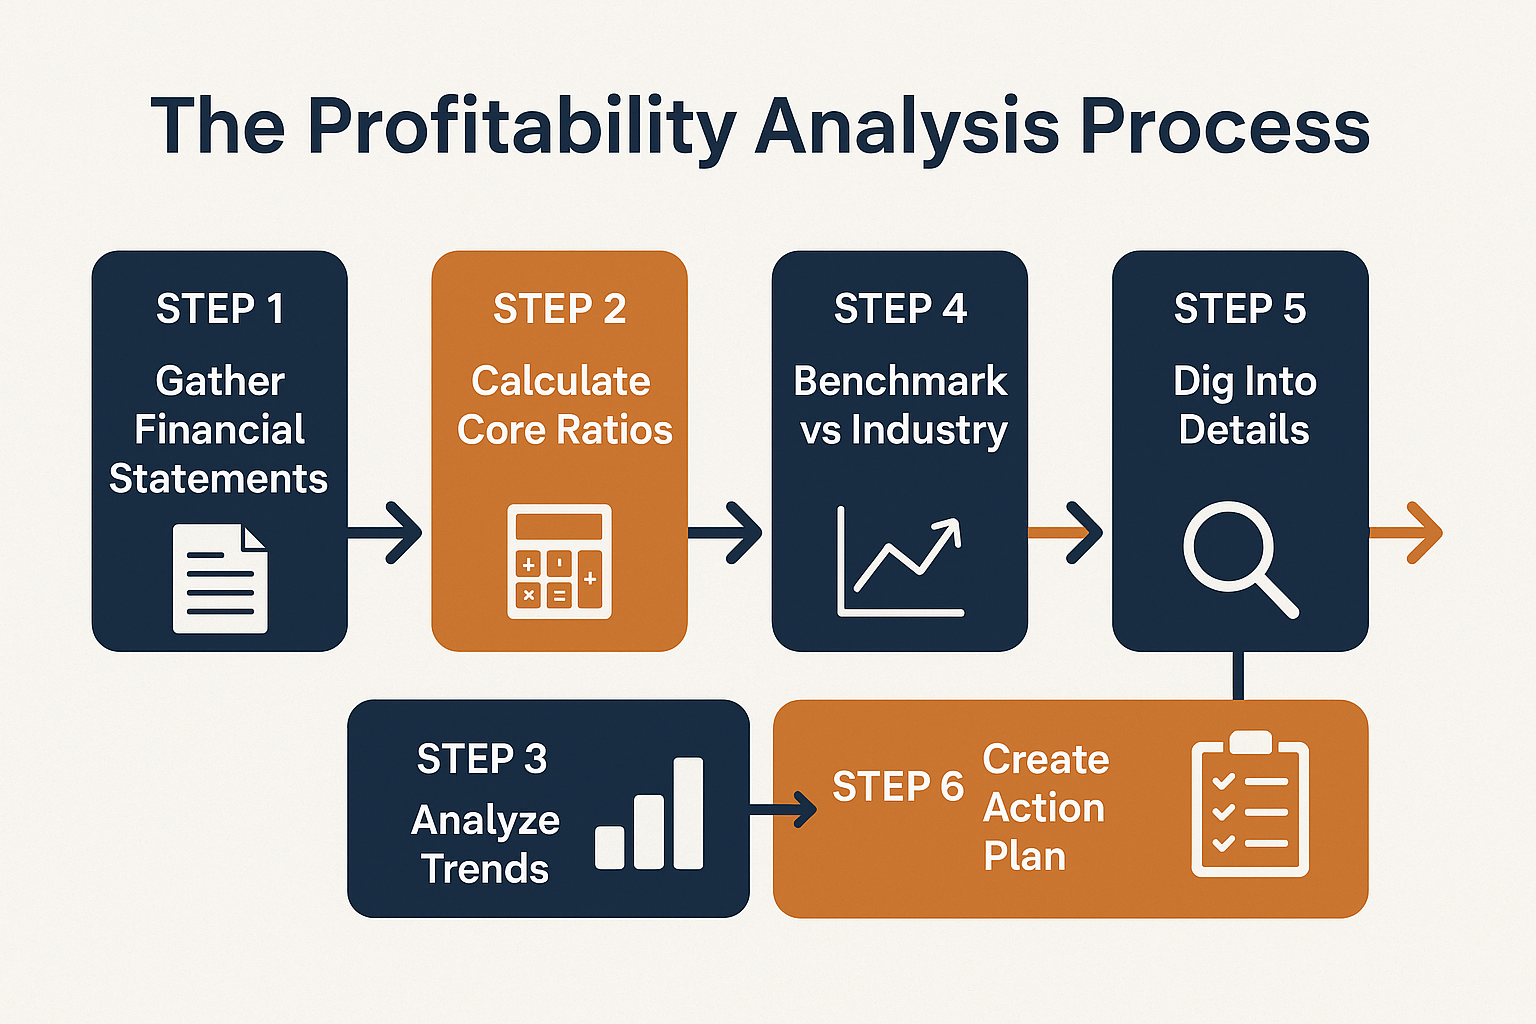
Step 1: Gather Financial Statements
You’ll need three core documents:
- Income Statement (Profit & Loss): Shows revenue, expenses, and profit over a period
- Balance Sheet: Displays assets, liabilities, and equity at a point in time
- Cash Flow Statement: Tracks actual cash movement (remember: profit ≠ cash)
For publicly traded companies, find these in quarterly (10-Q) and annual (10-K) reports filed with the SEC. For private businesses, request them from the owner or the accounting department.
Step 2: Calculate Core Profitability Ratios
Using the formulas above, calculate:
- Gross profit margin
- Operating profit margin
- Net profit margin
- ROA (if analyzing as an investor)
- ROE (if analyzing as an investor)
Pro tip: Calculate these metrics for at least 3-5 years to identify trends. A single snapshot doesn’t tell the full story.
Step 3: Analyze Trends Over Time
Plot your metrics on a simple line graph. Ask yourself:
- Are margins improving or declining?
- Are changes gradual or sudden?
- Do seasonal patterns exist?
- What external factors (economy, competition, regulations) might explain changes?
A company with steadily improving margins likely has competitive advantages, operational improvements, or pricing power. Declining margins signal problems that need investigation.
Step 4: Benchmark Against Competitors and Industry
Context is everything. A 5% net margin might be:
- Excellent for a grocery store (typical margins: 1-3%)
- Average for manufacturing (typical margins: 5-10%)
- Concerning software companies (typical margins: 15-25%+)
Use resources like:
- Industry reports from IBISWorld or Statista
- Competitor financial statements (for public companies)
- Trade associations that publish industry benchmarks
Understanding why the stock market goes up often connects directly to companies improving profitability faster than their competitors.
Step 5: Dig Into the Details
If you spot concerning trends, drill deeper:
- Declining gross margins? Investigate supplier costs, pricing strategies, or product mix changes
- Shrinking operating margins? Examine operating expense categories (salaries, marketing, rent)
- Falling net margins? Look at interest expenses, tax changes, or one-time charges
Step 6: Create an Action Plan
Profitability analysis without action is just interesting math. Based on your findings:
If margins are healthy and improving:
- Maintain current strategies
- Consider strategic investments for growth
- Explore expansion opportunities
If margins are declining:
- Identify specific cost drivers
- Evaluate pricing strategies
- Consider operational improvements
- Assess whether the business model remains viable
Common Profitability Analysis Mistakes to Avoid
Even experienced analysts make these errors:
Mistake #1: Confusing Profit with Cash Flow
The problem: A profitable company can still run out of cash if customers pay slowly or inventory ties up capital.
The solution: Always analyze cash flow statements alongside profitability metrics. A company showing profits but negative cash flow from operations deserves scrutiny.
Mistake #2: Ignoring One-Time Items
The problem: One-time gains (like selling a building) or losses (like lawsuit settlements) can distort profitability metrics.
The solution: Adjust for non-recurring items to understand “normalized” profitability. Most financial statements separate these items.
Mistake #3: Comparing Apples to Oranges
The problem: Comparing a startup to an established company, or businesses in different industries, produces meaningless conclusions.
The solution: Always benchmark against similar companies in the same industry and growth stage.
Mistake #4: Focusing Only on Margins
The problem: A 50% margin on $10,000 in revenue produces less absolute profit than a 10% margin on $1,000,000 in revenue.
The solution: Analyze both percentage margins AND absolute dollar profits. Sometimes lower margins with higher volume create more wealth.
Mistake #5: Neglecting the Competitive Context
The problem: Margins that look good in isolation might be declining relative to competitors, signaling loss of competitive advantage.
The solution: Always include competitive benchmarking in your analysis.
Many investors fall into similar traps when analyzing high dividend stocks, focusing on yield without examining the profitability that sustains those dividends.
Real-World Profitability Analysis: A Case Study
Let’s analyze a hypothetical company to see these concepts in action:
TechWidget Inc. manufactures smart home devices. Here are their financials for the past three years:
| Metric | 2023 | 2024 | 2025 |
|---|---|---|---|
| Revenue | $5M | $7M | $10M |
| COGS | $2M | $3.15M | $5M |
| Operating Expenses | $2M | $2.8M | $3.5M |
| Net Income | $750K | $750K | $1.125M |
Calculating margins:
2023:
- Gross margin: 60% ($3M / $5M)
- Operating margin: 20% ($1M / $5M)
- Net margin: 15% ($750K / $5M)
2024:
- Gross margin: 55% ($3.85M / $7M)
- Operating margin: 15% ($1.05M / $7M)
- Net margin: 10.7% ($750K / $7M)
2025:
- Gross margin: 50% ($5M / $10M)
- Operating margin: 15% ($1.5M / $10M)
- Net margin: 11.25% ($1.125M / $10M)
Analysis:
Positive: Revenue doubled from 2023 to 2025, showing strong growth
Concerning: Gross margin declined from 60% to 50%, suggesting:
- Increased competition is forcing lower prices
- Rising material costs
- Shift to lower-margin products
Mixed: Operating and net margins declined but stabilized in 2025
Recommendation: Investigate gross margin compression. Is this a temporary pricing strategy to gain market share, or a permanent competitive pressure? If the former, it might be acceptable; if the latter, the business model needs adjustment.
This scenario illustrates how understanding the cycle of market emotions helps investors avoid panic when they see declining margins, sometimes be strategically problematic.
Profitability Analysis for Different Audiences
The approach to profitability analysis varies depending on your role:
For Business Owners
Focus areas:
- Monthly or quarterly trend analysis
- Comparison to budget/forecasts
- Identification of cost-reduction opportunities
- Pricing strategy validation
Action items:
- Set target margins for each product/service
- Review expense categories monthly
- Benchmark against industry standards
- Adjust strategies based on findings
For Investors
Focus areas:
- Multi-year trend analysis
- Competitive comparison
- Sustainability of profit margins
- Relationship between profitability and stock price
Action items:
- Screen for companies with improving margins
- Avoid companies with deteriorating profitability
- Understand industry context before investing
- Consider profitability when evaluating smart ways to make passive income
For Job Seekers
Focus areas:
- Company stability and growth potential
- Industry health
- Ability to pay competitive salaries
Action items:
- Research profitability before accepting offers
- Favor profitable, growing companies
- Understand that unprofitable startups carry a higher risk
Tools and Resources for Profitability Analysis
You don’t need expensive software to conduct profitability analysis. Here are accessible tools:
Free Resources
- Microsoft Excel or Google Sheets: Perfect for calculations and trend analysis
- SEC EDGAR Database: Free access to all public company financial statements
- Yahoo Finance: Quick access to key financial metrics
- Company investor relations pages: Annual reports and presentations
Paid Tools (Optional)
- Bloomberg Terminal: Professional-grade financial data (expensive)
- Morningstar Premium: Comprehensive company analysis
- QuickBooks or Xero: For small business owners tracking their own profitability
Educational Resources
- Investopedia: Excellent definitions and examples
- SEC’s Investor Education: Free guides on reading financial statements
- Khan Academy: Free financial analysis courses
The Connection Between Profitability and Long-Term Wealth
Understanding profitability analysis isn’t just academic; it’s fundamental to building wealth. Companies that consistently generate strong profits:
- Compound value over time: Retained earnings fuel growth
- Survive economic downturns: Profitable businesses have cushions
- Attract capital: Investors fund profitable ventures
- Create sustainable jobs: Profitable companies can pay employees well
- Generate passive income: Through dividends and capital appreciation
This connects directly to making your kids millionaires; investing in consistently profitable companies over decades creates generational wealth through compounding.
Conversely, understanding why people lose money in the stock market often traces back to investing in unprofitable companies with unsustainable business models.
Advanced Profitability Concepts
Once you’ve mastered the basics, consider these advanced topics:
Contribution Margin Analysis
Contribution margin shows profitability at the product or service level:
Contribution Margin = (Price - Variable Costs) / Price × 100This helps businesses decide which products to promote and which to discontinue.
Break-Even Analysis
The break-even point identifies the sales volume needed to cover all costs:
Break-Even Point = Fixed Costs / (Price - Variable Cost per Unit)Understanding this helps businesses set realistic sales targets and evaluate new ventures.
Customer Profitability Analysis
Not all customers are equally profitable. Some require excessive service, demand discounts, or order in inefficient quantities. Analyzing profitability by customer segment helps businesses focus on their most valuable relationships.
DuPont Analysis
The DuPont formula breaks ROE into three components:
ROE = Net Margin × Asset Turnover × Equity MultiplierThis reveals whether a high ROE stems from operational efficiency, asset productivity, or financial leverage, which are important distinctions for investors.
Profitability Analysis in Different Industries
Industry context dramatically affects what “good” profitability looks like:
Technology/Software
- Typical gross margins: 70-90%
- Typical net margins: 15-30%
- Key factors: Scalability, minimal COGS, high development costs
- Watch for: Customer acquisition costs, churn rates
Retail
- Typical gross margins: 20-50%
- Typical net margins: 2-5%
- Key factors: Inventory management, location costs
- Watch for: Same-store sales growth, inventory turnover
Manufacturing
- Typical gross margins: 25-40%
- Typical net margins: 5-10%
- Key factors: Material costs, production efficiency
- Watch for: Capacity utilization, supply chain disruptions
Professional Services
- Typical gross margins: 40-60%
- Typical net margins: 10-20%
- Key factors: Billable hours, employee utilization
- Watch for: Revenue per employee, client concentration
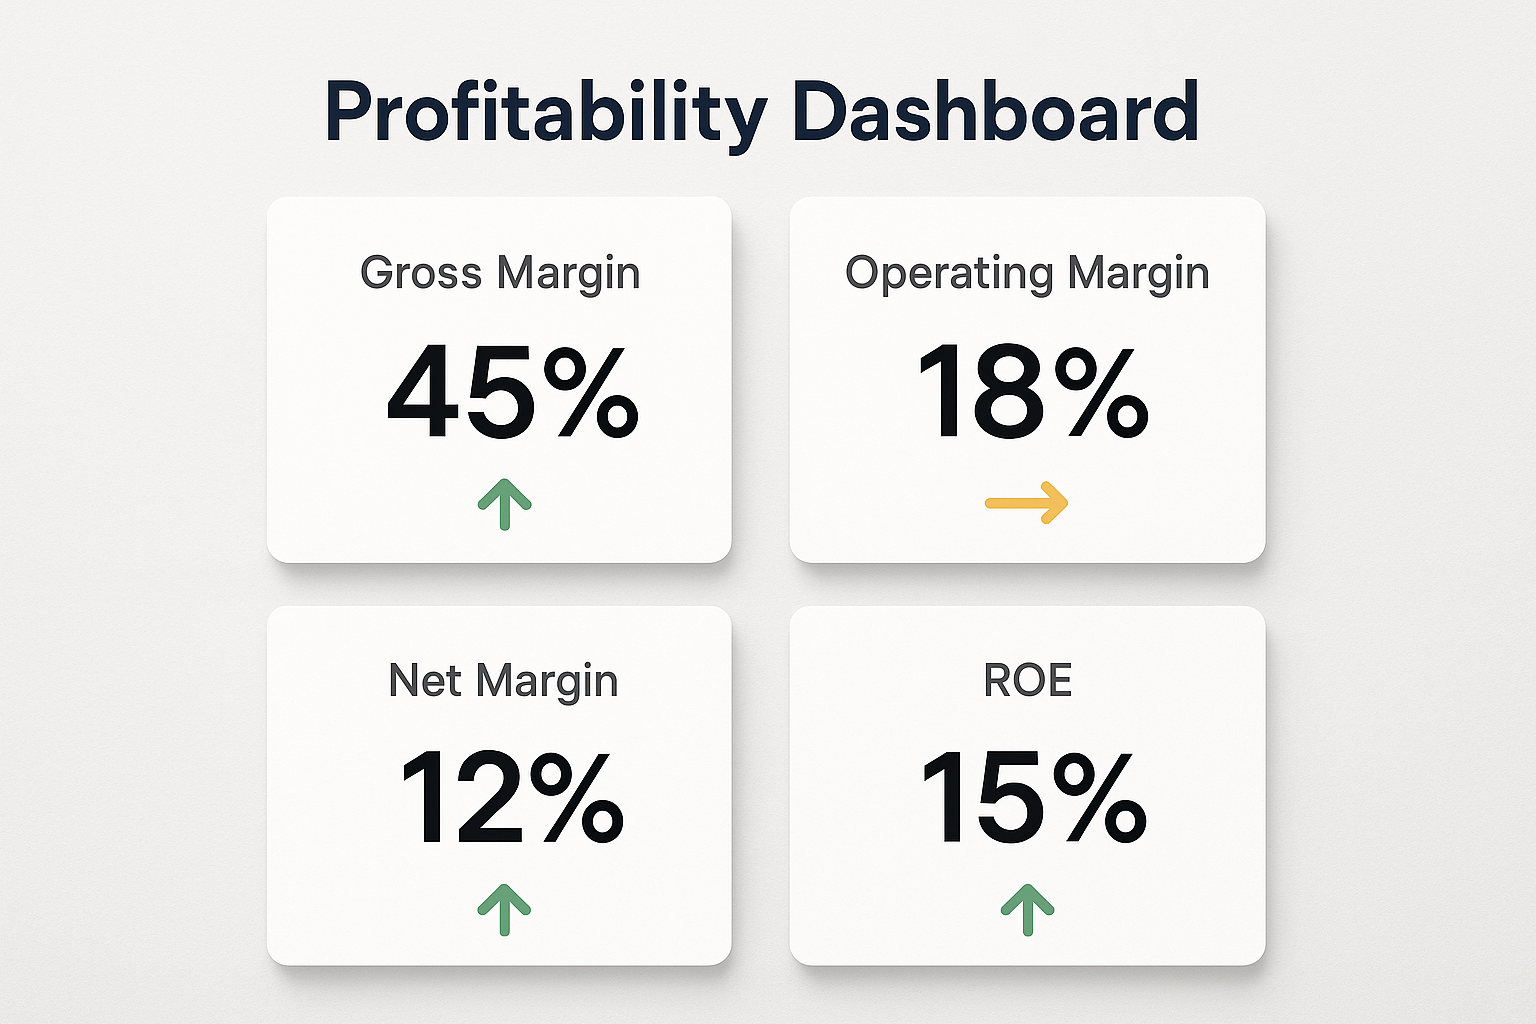
Creating a Profitability Dashboard
For ongoing monitoring, create a simple dashboard tracking:
- Monthly revenue (with year-over-year comparison)
- Gross profit margin (trending)
- Operating profit margin (trending)
- Net profit margin (trending)
- Absolute profit dollars (not just percentages)
- Key expense categories as % of revenue
- Comparison to budget (variance analysis)
- Industry benchmark comparison
Update this monthly for businesses, quarterly for investment portfolios. Consistent monitoring catches problems early when they’re easier to fix.
For business owners: Monthly for internal management, quarterly for detailed strategic review. For investors: Quarterly, when companies report earnings, with annual deep dives.
It depends entirely on industry, business model, and growth stage. A mature grocery chain with 2% net margins might be excellent, while a SaaS company with 10% margins might be concerning. Always benchmark against similar companies.
Yes! Profitability measures accounting profit, but businesses fail due to cash flow problems. A profitable company that can’t collect receivables or has too much capital tied up in inventory can run out of cash despite showing profits on paper.
It depends on the strategy. Some startups prioritize growth over profitability, intentionally operating at a loss to gain market share. However, they need a clear path to eventual profitability and sufficient capital to sustain losses until they get there.
Four main levers: (1) Increase prices, (2) Reduce COGS, (3) Decrease operating expenses, or (4) Improve product mix toward higher-margin offerings. The best approach depends on your specific situation.
Profitability Analysis Checklist
Use this checklist for your next analysis:
Data Collection:
- [ ] Gather 3-5 years of financial statements
- [ ] Verify data accuracy and completeness
- [ ] Identify any one-time or unusual items
- [ ] Collect competitor data for benchmarking
Calculations:
- [ ] Calculate gross profit margin (all periods)
- [ ] Calculate operating profit margin (all periods)
- [ ] Calculate net profit margin (all periods)
- [ ] Calculate ROA and ROE (if applicable)
- [ ] Create trend charts for visual analysis
Analysis:
- [ ] Identify trends (improving, declining, stable)
- [ ] Compare to industry benchmarks
- [ ] Compare to competitors
- [ ] Investigate significant changes
- [ ] Assess the sustainability of current margins
Action:
- [ ] Document key findings
- [ ] Identify specific concerns or opportunities
- [ ] Develop an action plan with specific steps
- [ ] Set timeline for implementation
- [ ] Schedule follow-up review
Making smart moves in business and investing requires this systematic approach rather than gut feelings or guesswork.
📊 Profitability Analysis Calculator
Calculate your key profitability metrics instantly
Your Profitability Analysis
💡 Interpretation
Conclusion: Your Profitability Analysis Action Plan
Profitability analysis transforms financial statements from confusing documents into actionable intelligence. Whether you're running a business, evaluating investments, or making career decisions, understanding profitability separates informed decisions from expensive guesses.
Here's your action plan to implement what you've learned:
This Week:
- Gather your financial data (business financials or investment portfolio statements)
- Calculate the three core margins (gross, operating, and net)
- Create a simple spreadsheet to track these metrics over time
This Month:
- Research industry benchmarks for your business or investment sectors
- Identify your top three profitability concerns based on the analysis
- Develop specific action items to address each concern
This Quarter:
- Implement changes based on your analysis
- Re-calculate metrics to measure improvement
- Refine your approach based on results
Ongoing:
- Review profitability monthly (business owners) or quarterly (investors)
- Stay informed about industry trends affecting profitability
- Adjust strategies as market conditions change
Remember: profitability analysis isn't a one-time exercise. It's an ongoing discipline that compounds in value over time. The businesses and investors who consistently analyze profitability make better decisions, avoid costly mistakes, and build sustainable wealth.
The difference between financial success and failure often comes down to one simple question: "Are we actually making money?" Now you have the tools to answer that question with confidence and precision.
Start your analysis today, and watch how this single skill transforms your financial decision-making forever.
Disclaimer
This article is for educational and informational purposes only and should not be construed as financial, investment, or professional advice. Profitability analysis is one tool among many for evaluating businesses and investments. Always conduct thorough due diligence, consider your individual circumstances, and consult with qualified financial, accounting, or legal professionals before making significant business or investment decisions. Past performance and profitability metrics do not guarantee future results. The examples and case studies presented are hypothetical or simplified for educational purposes and may not reflect real-world complexity.
About the Author
Max Fonji is a financial educator and investment analyst with over 15 years of experience helping individuals understand complex financial concepts. Through TheRichGuyMath.com, Max breaks down sophisticated investing and business strategies into actionable insights for beginners and experienced practitioners alike. His mission is to democratize financial education and empower readers to make informed decisions about their money. When he's not analyzing financial statements, Max enjoys teaching his children about money management and building generational wealth.
Related posts:
 What Is SmartPass? Raptor Digital Hall Pass Explained for K-12 Schools
 What Is the 3x Rent Rule & How to Calculate It (With Examples)
 Portfolio Income: Definition, Examples, Tax Rules, and Strategies
 Bookkeeping vs Accounting: What’s the Difference & Which Do You Need?
 Return on Assets (ROA): Definition, Formula & How to Improve It
 How to Save Money Fast: A Smart Savings Plan That Actually Works