Imagine you’re at a carnival, and you’ve got two lemonade stands side by side. Both sell the same number of cups, but one owner walks away with $50 in profit while the other barely clears $10. What’s the difference? It’s not just about how much lemonade they sold; it’s about how efficiently they turned sales into actual profit. This is exactly what profitability ratios reveal about businesses, and understanding them can transform how you evaluate investments in the stock market.
Whether you’re analyzing companies to build a portfolio of high dividend stocks or simply trying to understand which businesses are truly making money, profitability ratios are your financial X-ray vision. They cut through the revenue hype and show you what really matters: how much profit a company keeps from every dollar it earns.
In this comprehensive guide, we’ll break down everything you need to know about profitability ratios, what they are, why they matter, the key formulas you need to memorize, and how to interpret them like a seasoned investor. By the end, you’ll be able to spot a genuinely profitable company from a mile away! Investopedia
Key Takeaways
- Profitability ratios measure how efficiently a company converts revenue into profit, revealing the true health of a business beyond just sales numbers.
- The four essential profitability ratios are: Gross Profit Margin, Operating Profit Margin, Net Profit Margin, and Return on Equity (ROE)
- Higher ratios generally indicate better performance, but context matters; always compare companies within the same industry.y
- Profitability ratios help investors identify sustainable businesses that can generate consistent returns and support dividend investing strategies
- Trends matter more than single snapshots; watch how these ratios change over time to spot improving or declining business fundamentals.
What Are Profitability Ratios?
Profitability ratios are financial metrics that measure a company’s ability to generate profit relative to its revenue, assets, or equity. Think of them as report cards for business efficiency; they tell you how well a company is doing at the fundamental job of making money.
Unlike revenue figures that simply show how much a company sells, profitability ratios reveal the quality of those sales. A company might have $1 billion in revenue, but if it costs them $999 million to generate that revenue, they’re barely scraping by. Profitability ratios expose this reality.
Why Profitability Ratios Matter for Investors
Understanding why you should invest starts with knowing how to separate truly profitable companies from those just generating noise. Here’s why profitability ratios are essential:
They reveal operational efficiency – How well does management control costs?
They predict sustainability – Can the company maintain its business long-term?
They enable comparison – Which competitor in an industry performs better?
They signal dividend safety – Companies with strong profitability can better support passive income through dividends
They identify value – High profitability at a reasonable price often signals a great investment
According to research from Morningstar, companies with consistently high profitability ratios tend to outperform their peers over 10-year periods by an average of 3-5% annually. That’s the power of focusing on profit quality!
The Four Essential Profitability Ratios
Let’s dive into the four profitability ratios every investor should know. Each one tells a different part of the profit story.
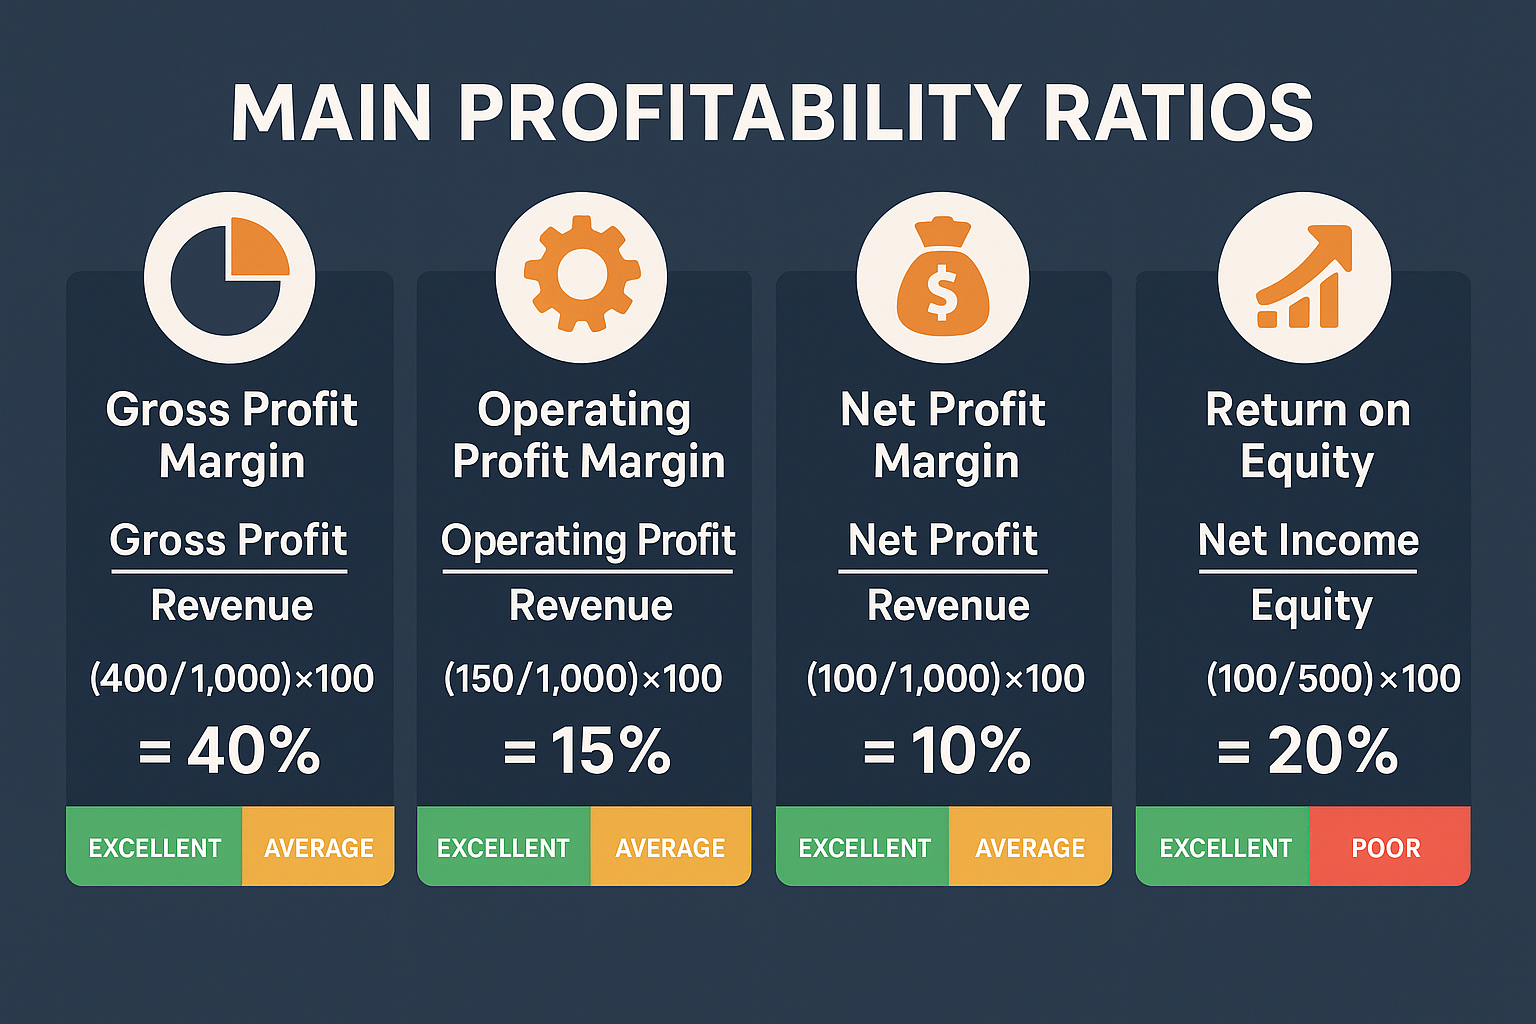
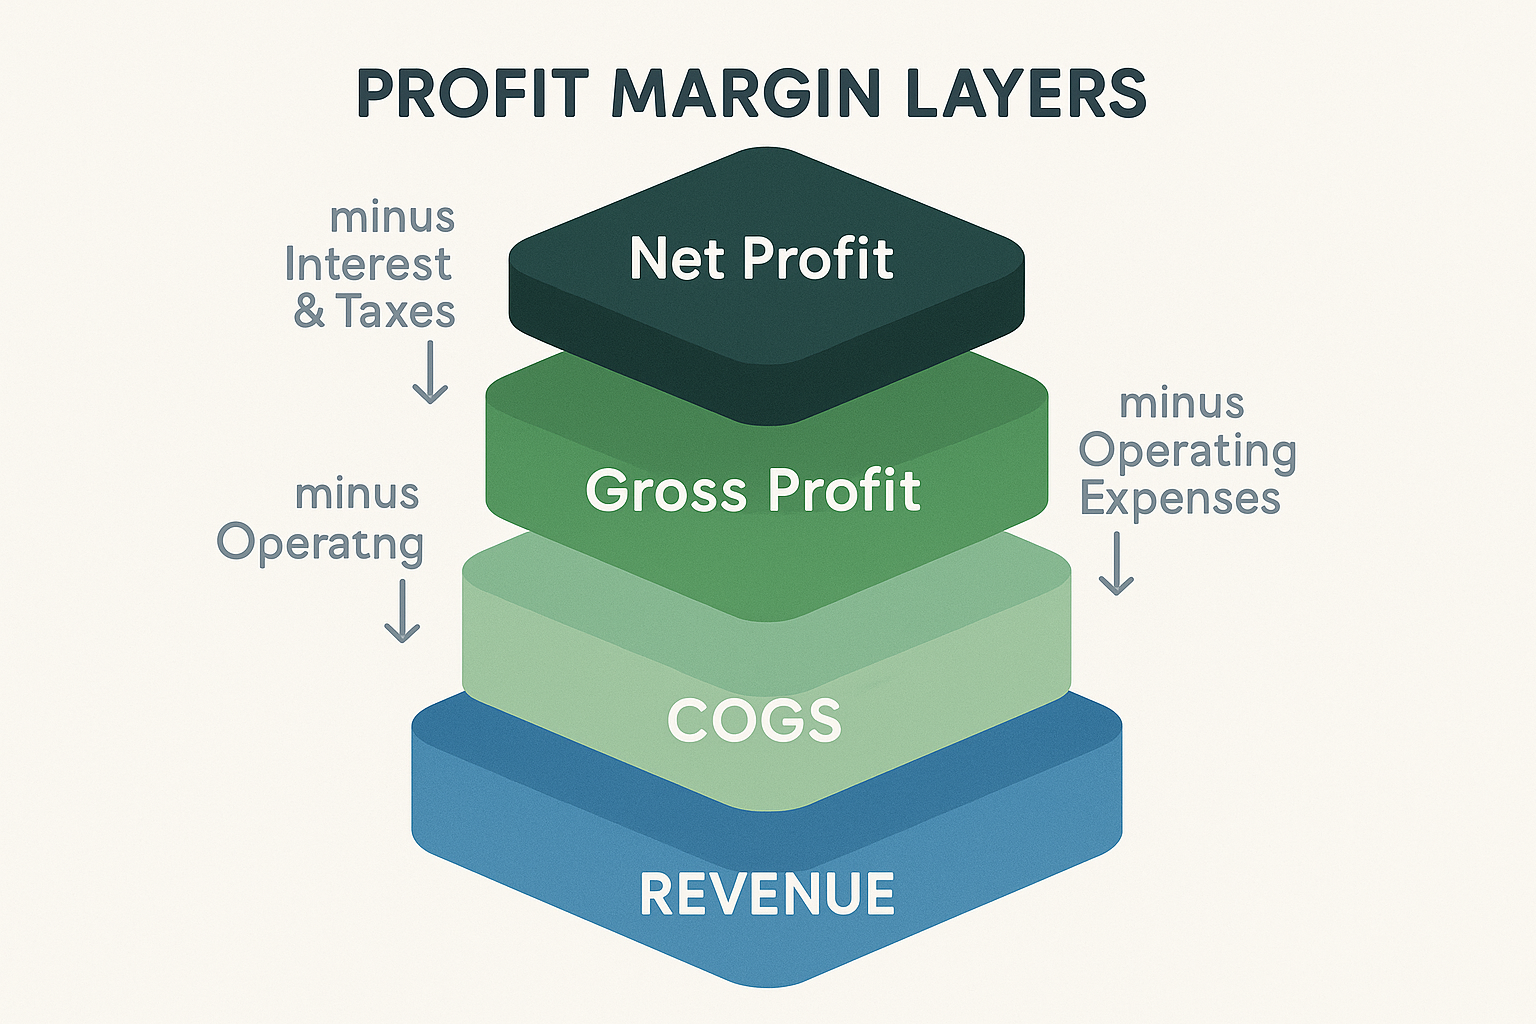
1. Gross Profit Margin
What it measures: How much profit a company makes after deducting the direct costs of producing its goods or services.
The Formula:
Gross Profit Margin = (Gross Profit ÷ Revenue) × 100Or alternatively:
Gross Profit Margin = ((Revenue - Cost of Goods Sold) ÷ Revenue) × 100Example: If a company has $1,000,000 in revenue and $600,000 in cost of goods sold (COGS):
- Gross Profit = $1,000,000 – $600,000 = $400,000
- Gross Profit Margin = ($400,000 ÷ $1,000,000) × 100 = 40%
What it means: For every dollar of sales, the company keeps 40 cents after covering direct production costs.
Interpretation:
- Higher is better – More cushion to cover operating expenses
- Industry-specific – Software companies often have 80%+ margins, while grocery stores might have 20-30%
- Pricing power indicator – Companies with strong brands can often maintain higher gross margins
See our full guide on Gross Profit Margin
2. Operating Profit Margin (Operating Margin)
What it measures: Profit after accounting for both production costs AND operating expenses (like salaries, rent, marketing, and R&D), but before interest and taxes.
The Formula:
Operating Profit Margin = (Operating Income ÷ Revenue) × 100Example: Using our previous company with $1,000,000 revenue and $400,000 gross profit, if operating expenses are $200,000:
- Operating Income = $400,000 – $200,000 = $200,000
- Operating Profit Margin = ($200,000 ÷ $1,000,000) × 100 = 20%
What it means: After covering all costs of running the business operations, the company keeps 20 cents from every dollar of sales.
Interpretation:
- Shows operational efficiency – How well management controls day-to-day costs
- More realistic than gross margin – Includes actual business expenses
- Useful for comparing competitors – Reveals which company runs tighter operations
- Watch for trends – Declining operating margins may signal rising costs or pricing pressure
See our full guide on Operating Profit Margin
3. Net Profit Margin (Bottom Line Margin)
What it measures: The percentage of revenue that becomes actual profit after ALL expenses, including interest, taxes, and one-time charges.
The Formula:
Net Profit Margin = (Net Income ÷ Revenue) × 100Example: Continuing with our company, if they pay $30,000 in interest and $50,000 in taxes:
- Net Income = $200,000 – $30,000 – $50,000 = $120,000
- Net Profit Margin = ($120,000 ÷ $1,000,000) × 100 = 12%
What it means: At the end of the day, after everyone gets paid and all bills are settled, the company keeps 12 cents of pure profit from every dollar earned.
Interpretation:
- The ultimate profitability measure – This is what shareholders actually get
- Lower than operating margin – The gap shows the impact of financing and taxes
- 10%+ is generally strong – Though this varies widely by industry
- Critical for dividend sustainability – Companies need healthy net margins to pay and grow dividends
Real-World Example: Apple Inc. consistently maintains net profit margins above 20%, which is exceptional for a hardware company. This high profitability allows Apple to return billions to shareholders through dividends and buybacks while still investing heavily in research and development.
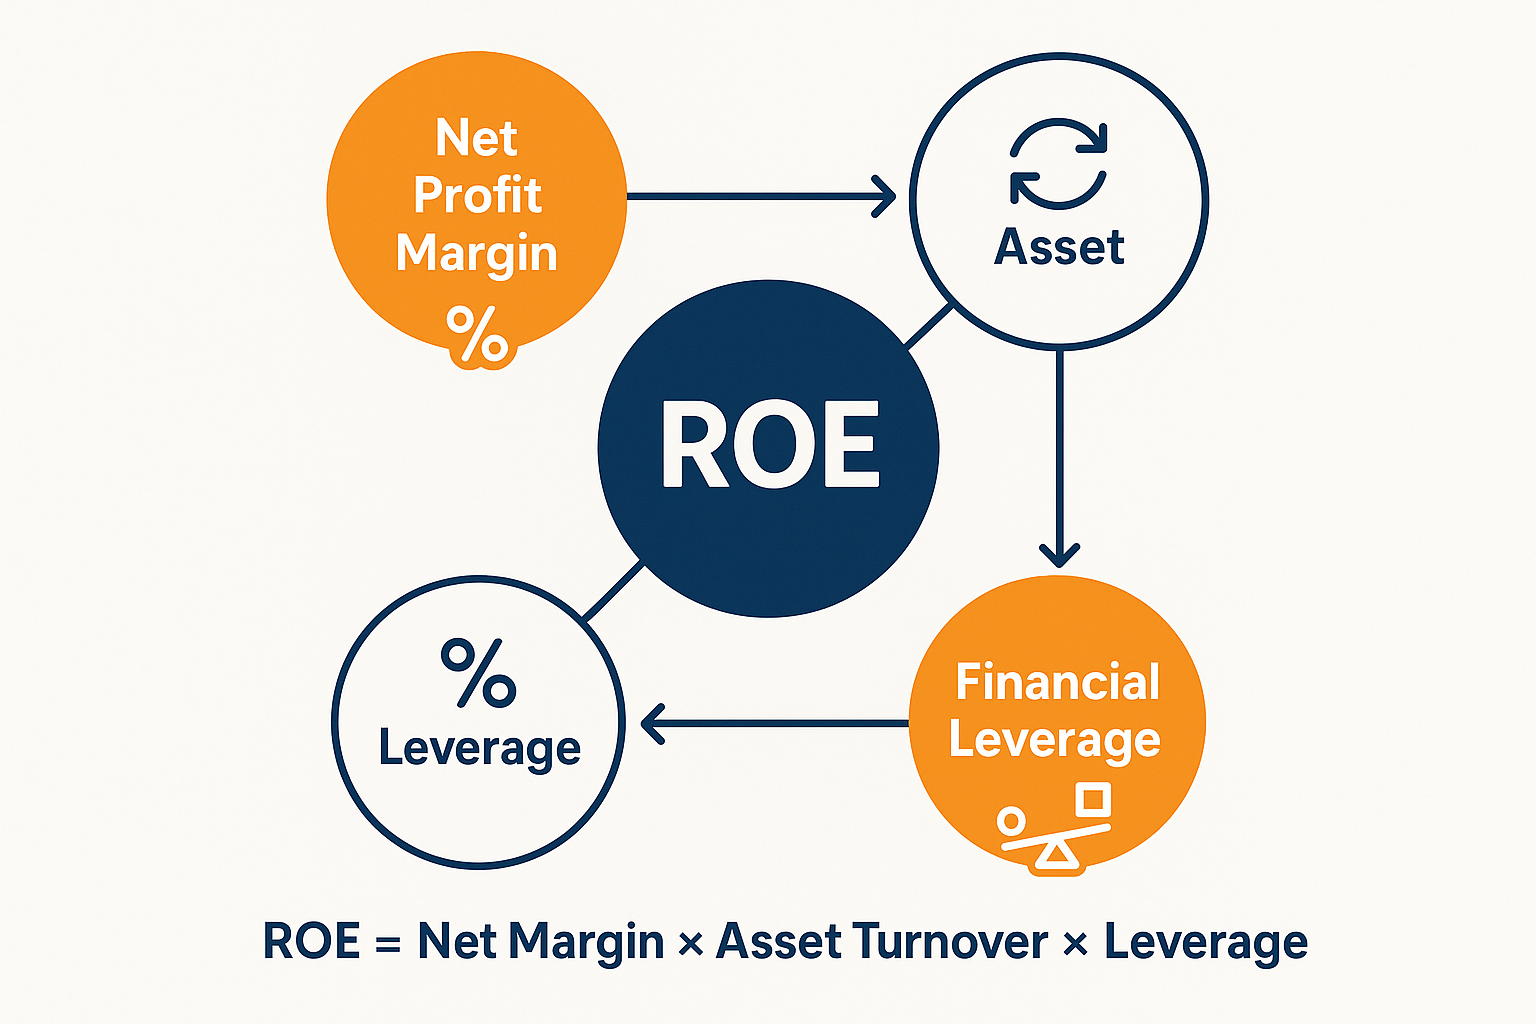
4. Return on Equity (ROE)
What it measures: How much profit a company generates with the money shareholders have invested.
The Formula:
Return on Equity = (Net Income ÷ Shareholders' Equity) × 100Example: If our company has net income of $120,000 and shareholders’ equity of $800,000:
- ROE = ($120,000 ÷ $800,000) × 100 = 15%
What it means: For every dollar shareholders have invested in the company, the business generates 15 cents in annual profit.
Interpretation:
- Efficiency of capital deployment – How well the company uses investor money
- 15%+ is generally excellent – Warren Buffett often looks for ROE above 15%
- Compare to alternatives – If ROE is 8% but bonds pay 5%, stocks might still be attractive
- Watch for excessive debt – Very high ROE can sometimes indicate risky leverage
According to the Federal Reserve’s data on corporate performance, the median ROE for S&P 500 companies hovers around 12-15%, making this a good benchmark for evaluating performance.
How to Interpret Profitability Ratios Like a Pro
Knowing the formulas is just the beginning. Here’s how to actually use profitability ratios to make smarter investment decisions:
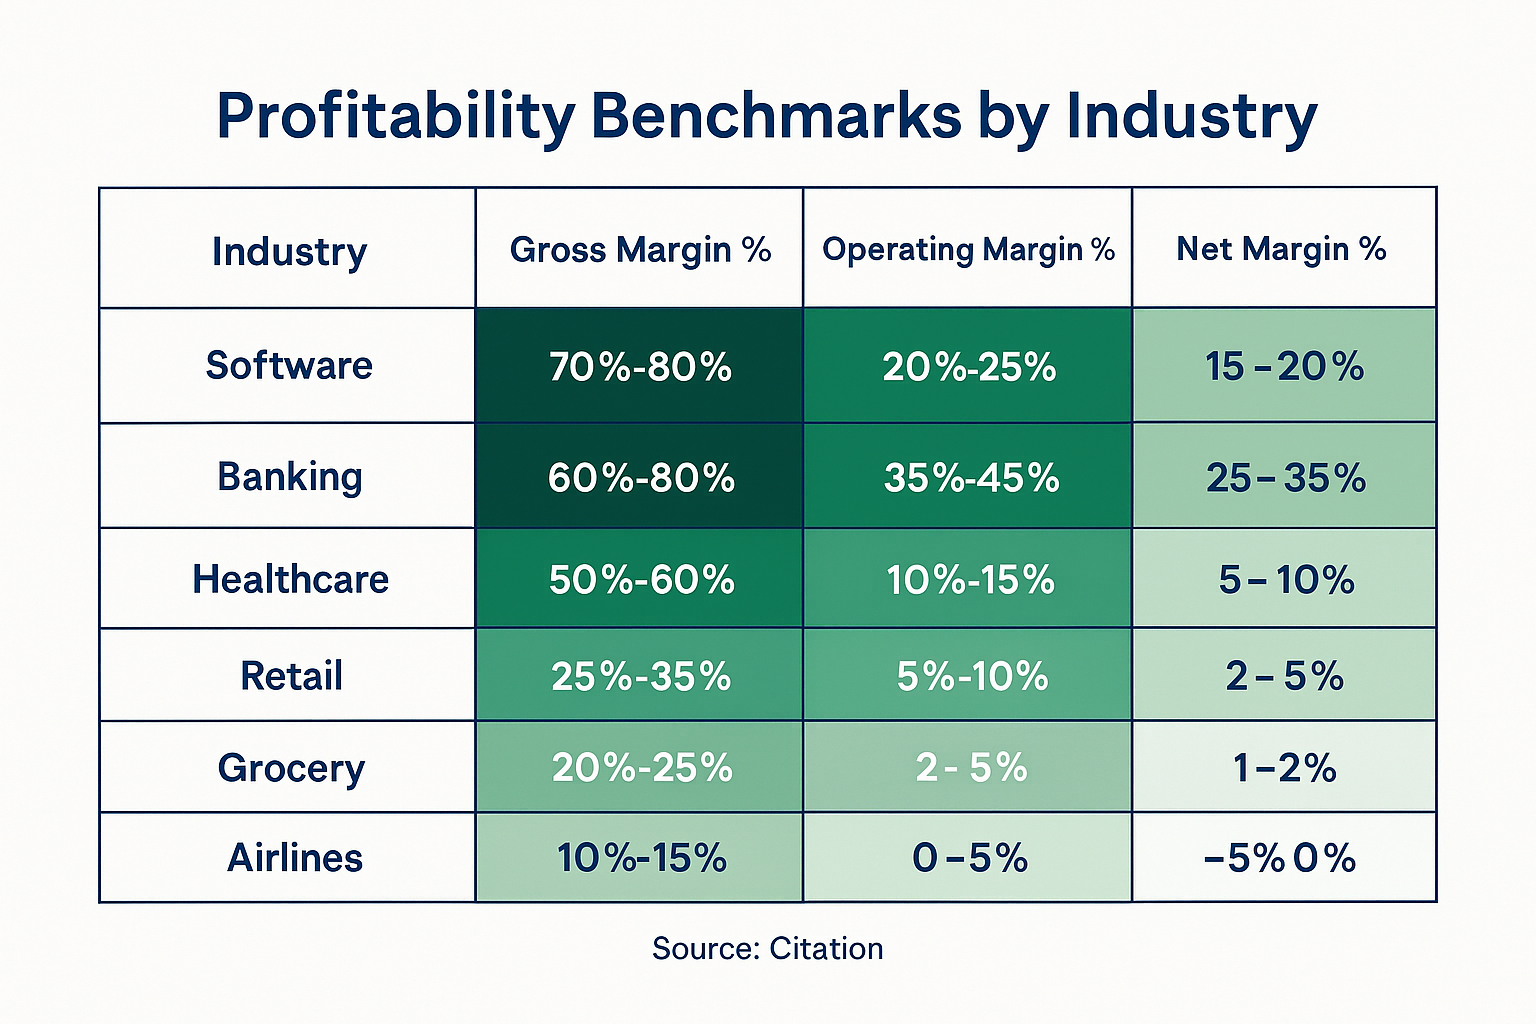
Compare Within Industries, Not Across Them
A 5% net profit margin might be excellent for a grocery chain but terrible for a software company. Different industries have different cost structures:
| Industry | Typical Net Profit Margin |
|---|---|
| Software & Technology | 15-25% |
| Banking & Finance | 15-20% |
| Healthcare | 8-15% |
| Retail | 2-5% |
| Grocery Stores | 1-3% |
| Airlines | 5-10% |
Source: NYU Stern School of Business Industry Margins Database
Look for Trends, Not Just Snapshots
A single quarter’s profitability ratio tells you very little. What you want to see is:
Improving margins over time – Signals growing efficiency and competitive strength
Declining margins – May indicate rising costs, pricing pressure, or losing competitive advantage
Stable margins – Shows consistent execution and predictable business
Understanding market cycles helps you interpret whether temporary margin compression is a buying opportunity or a red flag.
Use Multiple Ratios Together
Each profitability ratio tells part of the story. Here’s what different combinations reveal:
High gross margin + Low net margin = High operating or interest costs
- May indicate inefficient operations or a heavy debt burden
- Look deeper into operating expenses and debt levels
Declining gross margin + Stable net margin = Effective cost cutting
- The company is facing pricing pressure, but managing costs well
- May not be sustainable long-term
High ROE + Low profit margins = High leverage
- The company might be using lots of debt to boost returns
- Check the debt-to-equity ratio to assess risk
Compare Against Competitors
The most powerful use of profitability ratios is competitive comparison. Let’s say you’re choosing between two restaurant chains:
Company A:
- Gross Margin: 60%
- Operating Margin: 18%
- Net Margin: 12%
- ROE: 22%
Company B:
- Gross Margin: 55%
- Operating Margin: 12%
- Net Margin: 7%
- ROE: 14%
Company A shows superior performance across all metrics, suggesting better pricing power, operational efficiency, and capital deployment. This is likely the stronger investment, assuming valuations are comparable. Xero
Common Mistakes When Using Profitability Ratios
Even experienced investors sometimes misinterpret these metrics. Avoid these pitfalls:
Mistake #1: Ignoring One-Time Items
A company might report a low net margin one quarter due to a one-time restructuring charge or legal settlement. Always check for non-recurring items that distort the true operational picture.
Mistake #2: Forgetting About the Growth Stage
Young, high-growth companies often have lower or even negative net margins because they’re investing heavily in expansion. Amazon famously operated with razor-thin margins for years while building its empire. Context matters!
Mistake #3: Not Adjusting for Industry Norms
As mentioned earlier, a 3% margin in grocery retail is solid, but the same margin in software would be disastrous. Always benchmark against industry peers, not absolute numbers.
Mistake #4: Overlooking the Quality of Earnings
Some companies boost short-term profitability through accounting tricks, cutting essential R&D, or delaying necessary maintenance. Look at cash flow statements alongside profitability ratios to verify earnings quality.
This is one reason why people lose money in the stock market; they focus on surface-level metrics without digging deeper.
Profitability Ratios in Action: A Case Study
Let’s look at a real-world scenario to see how profitability ratios guide investment decisions.
The Situation: You’re considering investing in two competing beverage companies for your dividend portfolio.
Company X (Established Brand):
- Revenue: $50 billion
- Gross Profit Margin: 60%
- Operating Margin: 25%
- Net Margin: 18%
- ROE: 35%
- Dividend Yield: 3.2%
Company Y (Growing Competitor):
- Revenue: $15 billion
- Gross Profit Margin: 52%
- Operating Margin: 15%
- Net Margin: 9%
- ROE: 18%
- Dividend Yield: 1.8%
Analysis:
Company X shows superior profitability across every metric:
- A higher gross margin suggests stronger brand pricing power
- A better operating margin indicates more efficient operations
- Significantly higher net margin means more profit flows to shareholders
- Exceptional ROE of 35% shows excellent capital efficiency
- A higher dividend yield provides better immediate income
Company Y is growing faster (revenue up 25% vs. 5% for Company X), but its lower margins suggest it’s buying growth through aggressive pricing or higher marketing costs.
The Decision: For a conservative dividend investor seeking stable income, Company X is the clear choice. Its superior profitability ratios indicate a sustainable competitive advantage and safer dividend. However, a growth investor might accept Company Y’s lower current profitability in exchange for higher revenue growth potential.
This example shows why understanding profitability ratios is essential for making smart investment moves.
How Profitability Ratios Connect to Stock Performance
You might wonder: Do profitability ratios actually predict stock returns? The research says yes, with important nuances.
A comprehensive study by the CFA Institute found that companies in the top quartile of profitability ratios outperformed those in the bottom quartile by an average of 4.3% annually over 20-year periods. However, this outperformance wasn’t linear; it came in bursts during market downturns when investors fled to quality.
This connects to understanding why the stock market goes up over time, profitable companies compound earnings, reinvest in growth, and reward shareholders through dividends and buybacks.
Key insights from academic research:
- Profitability predicts long-term returns – But not necessarily short-term price movements
- Quality matters more in downturns – High-profitability companies fall less during bear markets
- Margin expansion drives stock prices – Improving profitability often leads to multiple expansion
- ROE is particularly predictive – Companies with sustained high ROE tend to outperform
Using Profitability Ratios to Build Your Portfolio
Now that you understand profitability ratios, here’s how to integrate them into your investment process:
Step 1: Screen for Quality
Start by filtering for companies with:
- Net profit margin above industry median
- ROE consistently above 12-15%
- Stable or improving margins over 5 years
This creates a shortlist of fundamentally strong businesses.
Step 2: Compare Competitors
Within each industry you’re interested in, rank companies by profitability metrics. Focus on the top 2-3 performers; these likely have competitive advantages.
Step 3: Check for Sustainability
Look at 5-10 year trends:
- Are margins stable or improving?
- Has the company maintained profitability through economic cycles?
- Do profit margins support the current dividend payout?
Step 4: Consider Valuation
High profitability often commands premium valuations. Compare the price-to-earnings (P/E) ratio to profitability:
- A P/E of 25 might be reasonable for a company with 20% net margins and 25% ROE
- The same P/E would be expensive for a company with 5% margins and 10% ROE
Step 5: Monitor Regularly
Add profitability ratios to your quarterly review checklist. Deteriorating margins are often early warning signs of competitive threats or operational problems.
For those building passive income streams, focusing on companies with strong, stable profitability ratios significantly increases the likelihood of sustainable dividend growth.
Advanced Tips for Profitability Analysis
Once you’ve mastered the basics, consider these advanced techniques:
Analyze Margin Composition
Break down where profits come from:
- Geographic margins – Which regions are most profitable?
- Product margins – Which product lines drive profits?
- Customer segment margins – Which customers are most valuable?
Public companies often disclose this in their 10-K annual reports filed with the SEC.
Calculate Normalized Profitability
Adjust for cyclical effects by averaging profitability ratios over a full economic cycle (typically 7-10 years). This reveals “normal” profitability and helps avoid buying at peak margins.
Use the DuPont Analysis
Break down ROE into three components:
ROE = (Net Margin) × (Asset Turnover) × (Financial Leverage)This reveals whether high ROE comes from operational excellence, efficient asset use, or simply high debt.
Watch for Margin Inflection Points
The most explosive stock returns often occur when profitability metrics inflect from declining to improving. Companies that successfully turn around operations can deliver multi-year outperformance.
Profitability Ratios Across Different Investment Strategies
Different investing approaches emphasize different profitability metrics:
Value Investing:
- Focus on companies with solid profitability trading below intrinsic value
- Look for temporarily depressed margins that could recover
- Warren Buffett emphasizes a consistent ROE above 15%
Growth Investing:
- Accept lower current margins if revenue is growing rapidly
- Watch for margin expansion as companies scale
- Focus on gross margins more than net margins (operating leverage potential)
Dividend Investing:
- Prioritize stable, high net profit margins
- Ensure margins comfortably support dividend payout ratios
- Look for companies with 10+ years of stable profitability
Income Investing:
- High current net margins indicate dividend safety
- ROE above dividend yield suggests sustainable payouts
- Prefer mature companies with predictable profitability
No matter your strategy, understanding profitability ratios helps you make more informed decisions. Check out our guide on smart financial moves for more investment wisdom.
Tools and Resources for Finding Profitability Ratios
You don’t need expensive software to access profitability ratios. Here are reliable free resources:
Free Sources:
- Yahoo Finance – Provides key profitability metrics under the “Statistics” tab
- Morningstar.com – Offers 10 years of margin history for free
- SEC EDGAR Database – Access official company filings (10-K, 10-Q)
- FRED (Federal Reserve) – Industry-wide profitability data and trends
- Company investor relations pages – Often include financial highlights
What to Look For:
- Income statements (for calculating margins)
- Balance sheets (for ROE calculation)
- 5-10 year historical trends
- Industry comparison data
- Management discussion of margin trends
Pro Tip: Most brokerage accounts (Fidelity, Schwab, TD Ameritrade, etc.) provide comprehensive profitability metrics for free once you open an account.
Conclusion: Making Profitability Ratios Work for You
Understanding profitability ratios transforms you from a speculator into an informed investor. Instead of chasing hot tips or following the crowd, you can systematically identify companies that actually make money, and do so efficiently.
Remember these key principles:
Use all four ratios together – Each tells part of the profitability story
Context is everything – Compare within industries and consider business stage
Trends matter more than snapshots – Watch how ratios change over time
Combine with other metrics – Profitability ratios are powerful but not sufficient alone
Focus on sustainability – Consistent profitability beats flashy one-time results
Your Next Steps:
- Pick 3-5 companies you’re interested in and calculate their profitability ratios using free tools like Yahoo Finance or Morningstar
- Compare them to competitors in the same industry to see which demonstrates superior profitability
- Review your current portfolio and identify any holdings with deteriorating profitability metrics that might warrant further investigation..
- Set up quarterly reminders to review profitability ratios when companies report earnings..
- Build a watchlist of high-profitability companies trading at reasonable valuations for future investment opportunities.
The most successful investors aren’t necessarily the smartest; they’re the most disciplined about focusing on fundamentals. Profitability ratios give you a systematic way to identify quality businesses, avoid value traps, and build a portfolio that can weather market storms while delivering long-term returns.
Whether you’re building wealth through dividend investing, seeking growth opportunities, or simply trying to understand what makes the stock market tick, mastering profitability ratios is one of the most valuable skills you can develop.
Start applying these concepts today, and you’ll be amazed at how quickly you develop the ability to spot truly profitable companies that deserve a place in your portfolio!
Interactive Profitability Ratio Calculator
📊 Profitability Ratio Calculator
Calculate key profitability metrics for any company
Your Profitability Analysis
FAQ
It depends entirely on the industry. Software companies should target 15%+, while grocery stores might only achieve 2-3%. Compare to industry peers rather than using absolute benchmarks.
Yes. Unprofitable companies have negative net margins and ROE. This isn’t always bad. Amazon was unprofitable for years while investing in growth. However, sustained losses are concerning.
There’s no single “best” ratio. ROE is often considered the most comprehensive, but use all four together for a complete picture. Net margin is crucial for dividend investors, while gross margin matters more for evaluating competitive positioning.
Review them quarterly when companies report earnings. However, focus on trends over 3-5 years rather than quarter-to-quarter fluctuations.
They’re most useful for mature, established companies. For startups, early-stage growth companies, or businesses in turnaround situations, traditional profitability metrics may be less meaningful. Focus more on revenue growth and the path to profitability.
DISCLAIMER
The information provided in this article is for educational and informational purposes only and should not be construed as financial, investment, or professional advice. Profitability ratios are analytical tools that should be used as part of a comprehensive investment research process. Past performance and historical profitability metrics do not guarantee future results. All investments carry risk, including the potential loss of principal. Before making any investment decisions, please consult with a qualified financial advisor who understands your individual circumstances, risk tolerance, and financial goals. The author and TheRichGuyMath.com are not responsible for any financial decisions made based on the information presented in this article.
About the Author
Max Fonji is a financial educator and investment analyst with over a decade of experience helping everyday investors understand complex financial concepts. With a background in corporate finance and a passion for making investing accessible, Max has guided thousands of readers toward smarter financial decisions through clear, actionable content. When not analyzing financial statements, Max enjoys hiking, reading investment classics, and experimenting with dividend portfolio strategies. Connect with Max and explore more investing insights at TheRichGuyMath.com.