
Imagine celebrating a 10% return on your investment portfolio, only to realize that after inflation, you’ve actually lost money. Sounds impossible? It’s not. This is the harsh reality many investors face when they confuse nominal returns with real returns, and it’s costing them thousands of dollars in purchasing power without even knowing it.
Understanding the difference between what your investments earn on paper versus what they earn in actual buying power is one of the most critical, yet overlooked, concepts in investing. Whether you’re building wealth through dividend investing or navigating the ups and downs of the stock market, knowing your real return is the only way to measure true financial progress. Investopedia
Key Takeaways
- Real return measures your investment gains after accounting for inflation, showing your actual increase in purchasing power.
- Nominal return is the percentage gain you see on your account statement before adjusting for inflation.
- Calculate real return using this simple formula: Real Return ≈ Nominal Return – Inflation Rate.
- A positive nominal return doesn’t guarantee wealth growth; if inflation exceeds your returns, you’re losing purchasing power.
- Smart investors focus on real returns when making long-term investment decisions and comparing different asset classes.
What Is Real Return? The Foundation of True Wealth Building
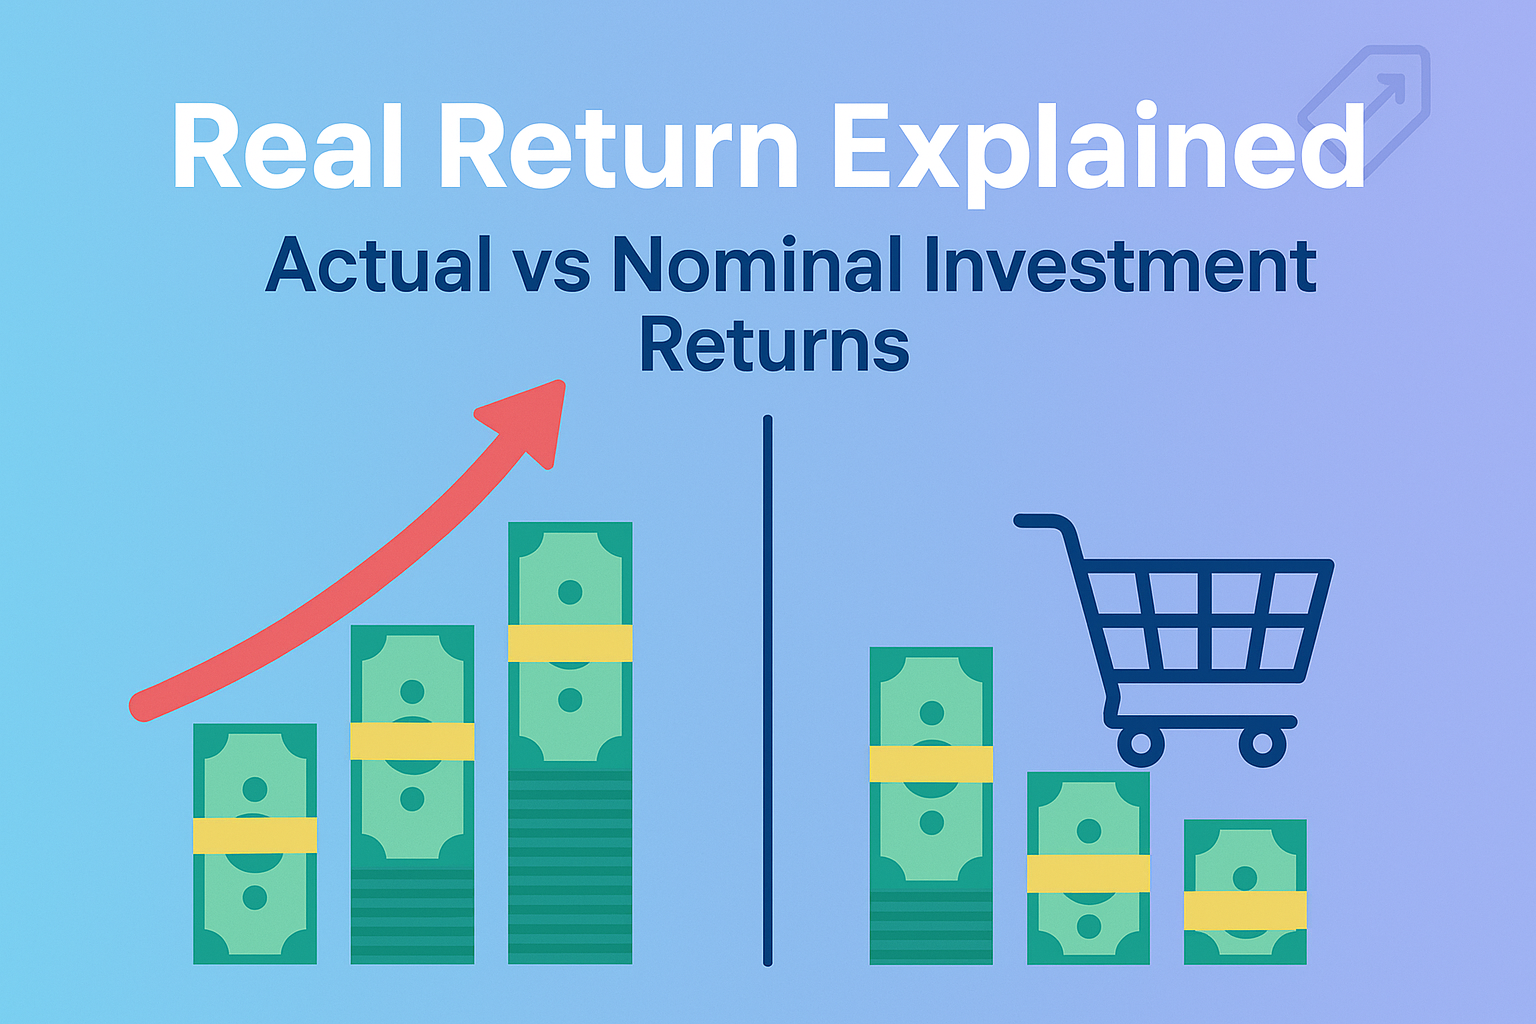
Real return is the actual profit you earn on an investment after adjusting for inflation. It represents the true increase in your purchasing power, the amount by which your money can buy more goods and services in the future compared to today. Investor.gov
Think of it this way: If you earned a 7% return on your investment last year, but inflation was 3%, your real return was only 4%. That 4% represents the actual growth in what your money can buy.
Why Real Return Matters More Than You Think
Here’s a story that illustrates this perfectly:
Sarah invested $10,000 in a bond fund in 2020 that promised a 5% annual return. By 2025, her investment had grown to $12,763, a solid 27.63% total return over five years. She felt great about her investment decision.
Meanwhile, her friend Marcus invested the same amount in a diversified stock portfolio that averaged 9% annually. By 2025, Marcus had $15,386.
But here’s the twist: During those five years, inflation averaged 4% per year. When accounting for inflation’s erosion of purchasing power:
- Sarah’s real return: Approximately 1% per year (5% nominal – 4% inflation)
- Marcus’s real return: Approximately 5% per year (9% nominal – 4% inflation)
The difference? Sarah’s $12,763 could buy roughly what $10,510 could buy in 2020. Marcus’s $15,386 could buy what $12,653 could buy in 2020. Marcus’s investment actually grew his wealth; Sarah’s barely kept pace with inflation.
This is why understanding why the stock market goes up in the long term, and often outpaces inflation, is crucial for building real wealth.
Nominal Return Explained: What You See on Your Statement
Nominal return is the percentage change in your investment’s value without adjusting for inflation. It’s the number you see on your brokerage statement, the figure financial advisors often highlight, and the return most people celebrate.
The Nominal Return Formula
Calculating nominal return is straightforward:
Nominal Return = [(Ending Value – Beginning Value) / Beginning Value] × 100
Example:
- You invest $5,000 in a stock
- One year later, it’s worth $5,400
- Nominal Return = [($5,400 – $5,000) / $5,000] × 100 = 8%
Why Nominal Returns Can Be Deceiving
Nominal returns tell an incomplete story. They don’t account for:
- Inflation eroding purchasing power
- Taxes reduce your actual gains
- Fees are eating into returns
- Currency fluctuations (for international investments)
A 12% nominal return sounds impressive until you realize inflation was 6%, taxes took another 2%, and fees consumed 0.5%. Your actual benefit? Much smaller than the headline number suggests.
The Real Return Formula: Calculating What Actually Matters
The real return formula adjusts your nominal return for inflation, giving you a true picture of wealth growth.
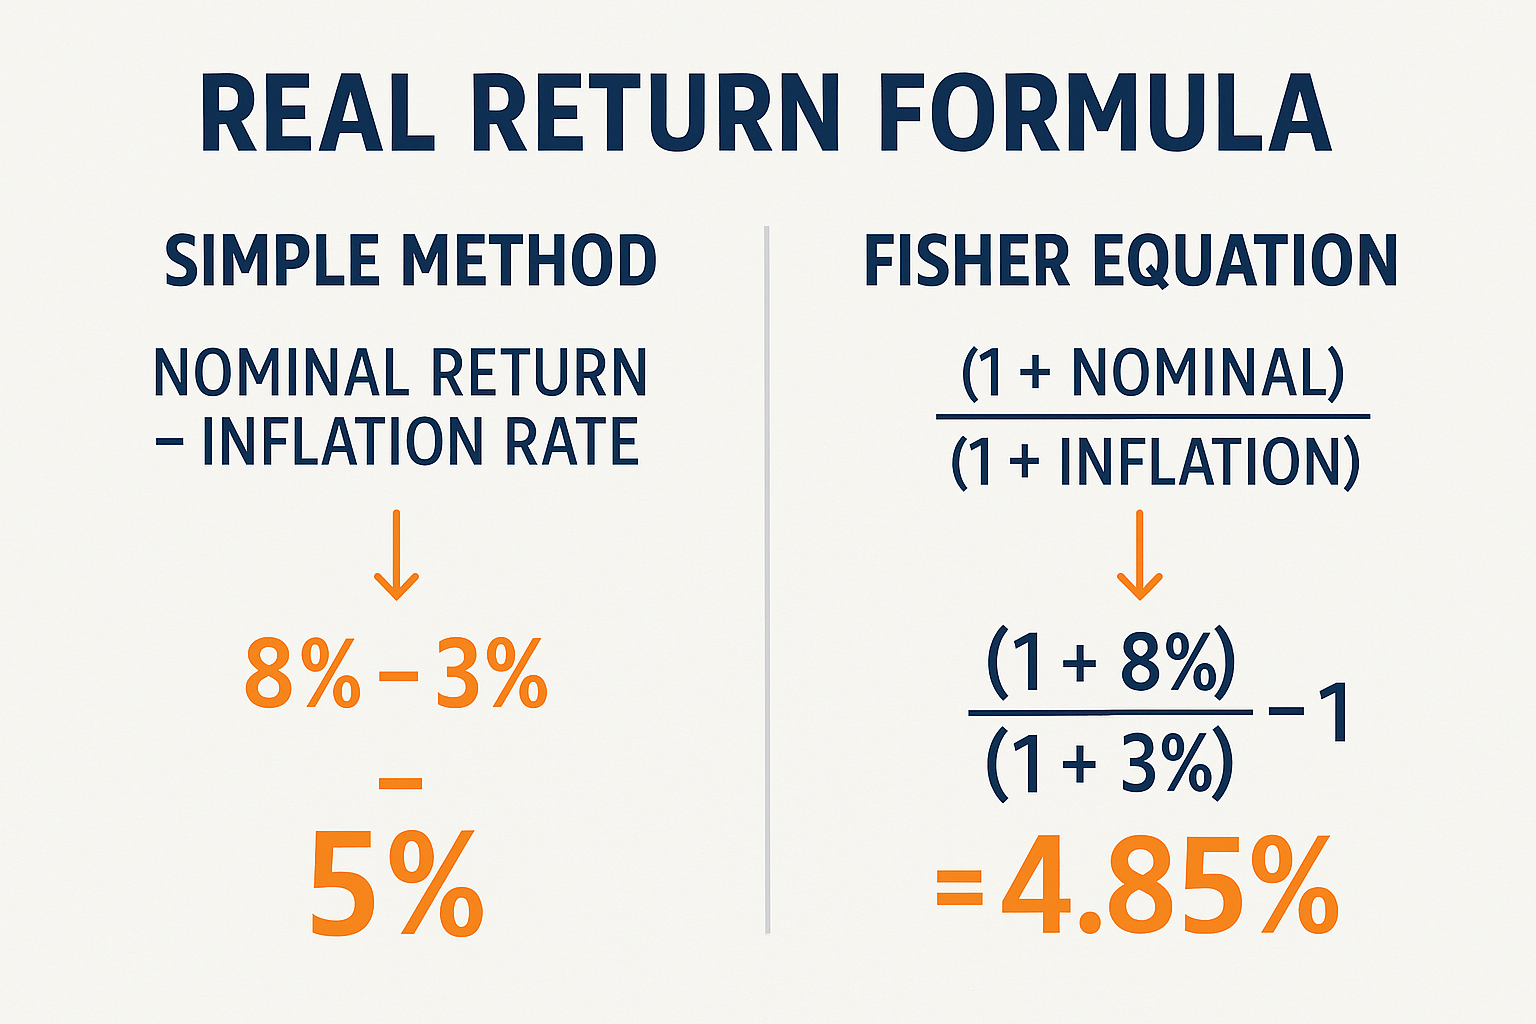
Simple Real Return Formula
For quick estimates, use:
Real Return ≈ Nominal Return – Inflation Rate
Example:
- Nominal return: 8%
- Inflation rate: 3%
- Real return: 8% – 3% = 5%
Precise Real Return Formula (Fisher Equation)
For exact calculations, economists use the Fisher equation:
Real Return = [(1 + Nominal Return) / (1 + Inflation Rate)] – 1
Example:
- Nominal return: 8% (0.08)
- Inflation rate: 3% (0.03)
- Real return = [(1.08) / (1.03)] – 1 = 1.0485 – 1 = 0.0485 or 4.85%
The difference between the simple and precise formulas is usually small for typical investment returns, but the Fisher equation becomes more important when dealing with higher inflation rates or longer time periods.
Real Return vs Nominal Return: A Side-by-Side Comparison
| Aspect | Nominal Return | Real Return |
|---|---|---|
| Definition | Percentage gain without inflation adjustment | Percentage gain after inflation adjustment |
| What it shows | Dollar growth of investment | Purchasing power growth |
| Calculation | (End Value – Start Value) / Start Value | Nominal Return – Inflation Rate |
| Use case | Comparing performance year-over-year | Measuring actual wealth increase |
| Investor focus | Short-term traders, performance tracking | Long-term investors, retirement planning |
| Accounts for inflation | No | Yes |
| Shows true profit | No | Yes |
| Typically higher | Yes | No |
How Inflation Destroys Nominal Returns
Inflation is the silent wealth killer. It’s the reason your grandparents could buy a house for $20,000 while you need $400,000 for a similar property today.
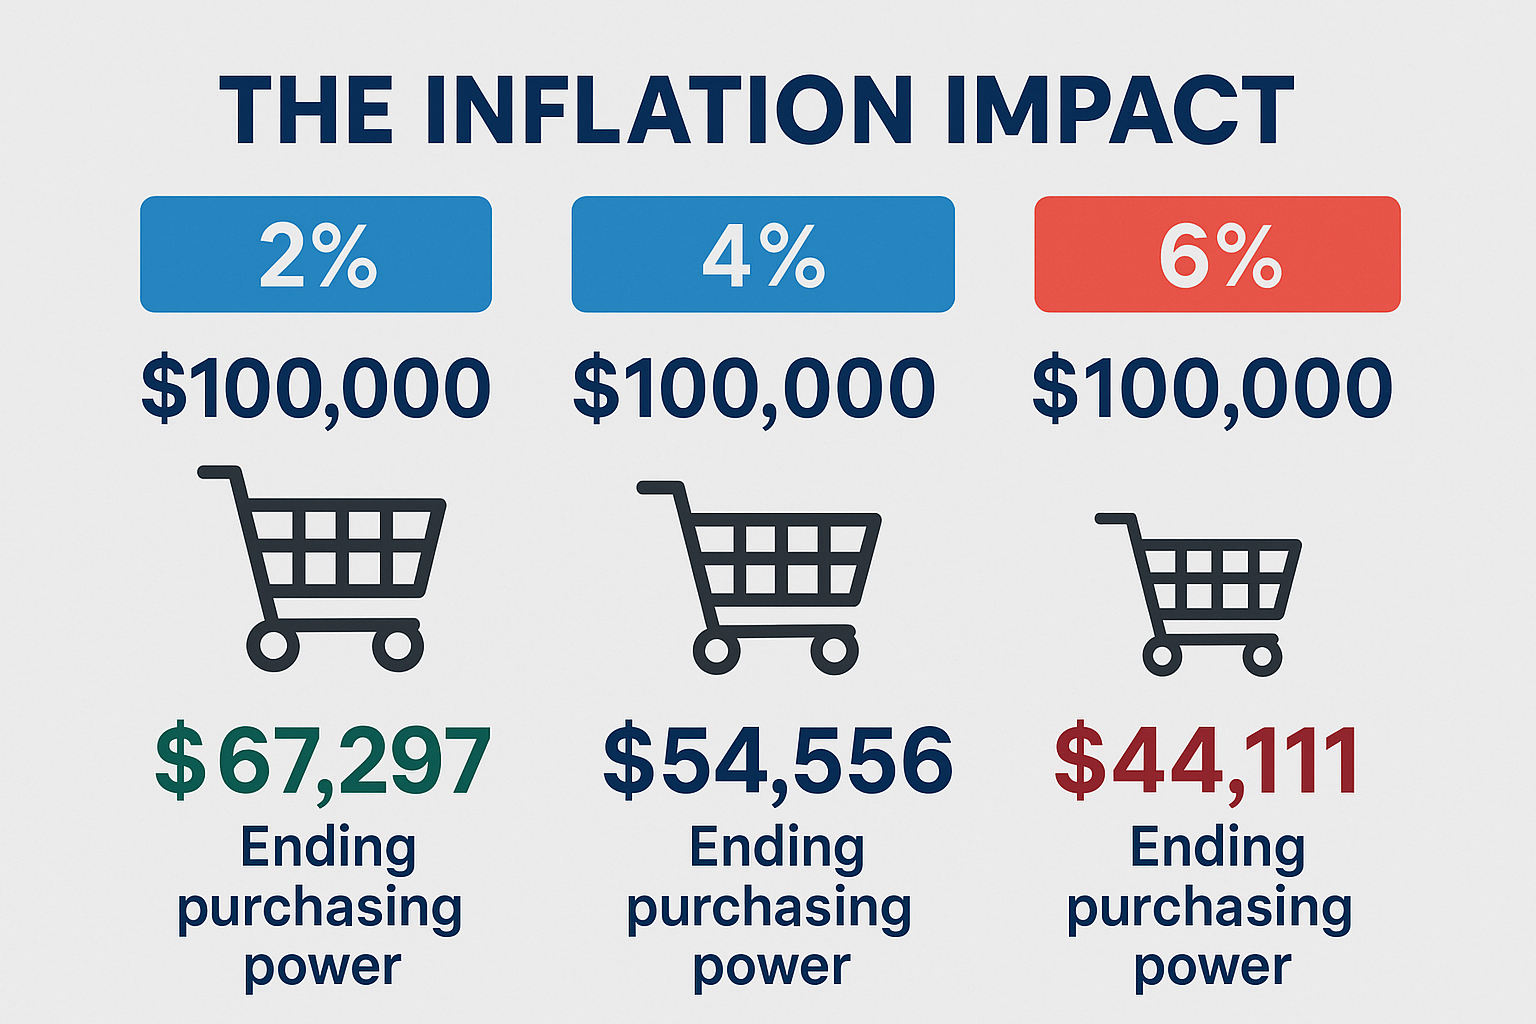
The Inflation Impact Over Time
Let’s examine how inflation compounds and erodes purchasing power:
$100,000 investment scenario over 10 years:
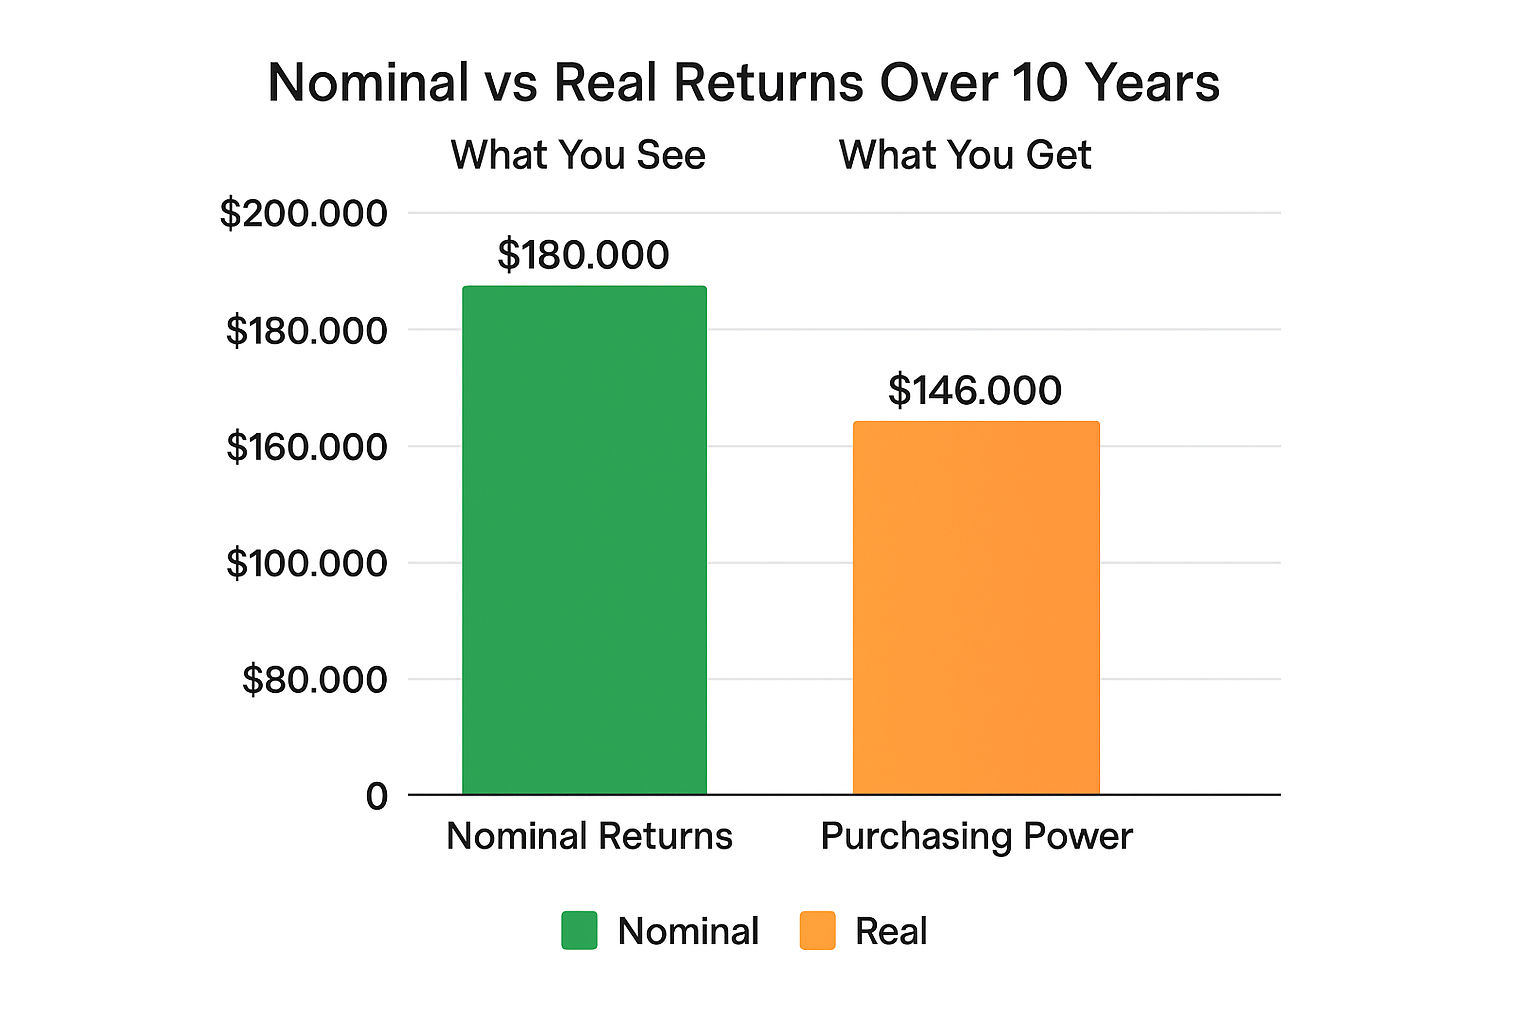
| Nominal Return | Inflation Rate | Real Return | Ending Nominal Value | Purchasing Power (Today’s Dollars) |
|---|---|---|---|---|
| 6% | 2% | 3.92% | $179,085 | $146,419 |
| 6% | 4% | 1.92% | $179,085 | $120,904 |
| 6% | 6% | 0% | $179,085 | $100,000 |
| 6% | 8% | -1.85% | $179,085 | $82,926 |
Notice that with 6% inflation, a 6% nominal return leaves you with the same purchasing power you started with; you’ve made zero real progress despite your account balance looking 79% higher!
Historical Inflation Rates
Understanding historical inflation helps contextualize real returns:
- 2020-2025 average: Approximately 4.2% (with spikes to 8-9% in 2022)
- 2010-2019 average: Approximately 1.8%
- 2000-2009 average: Approximately 2.6%
- 1980s average: Approximately 5.1%
- 1970s average: Approximately 7.4%
During the 1970s, many “safe” bonds and savings accounts actually delivered negative real returns, causing savers to lose purchasing power despite positive nominal gains.
Real-World Examples: Real Return in Action
Example 1: The Savings Account Trap
2023 Scenario:
- Bank savings account: 0.5% nominal return
- Inflation rate: 4%
- Real return: 0.5% – 4% = -3.5%
Your money is literally shrinking in purchasing power. If you had $10,000 in savings earning 0.5% annually while inflation runs at 4%, after one year, you’d have $10,050 nominally, but it would only buy what $9,650 could buy the year before.
This is why smart passive income strategies focus on investments that outpace inflation.
Example 2: The Stock Market Winner
Historical S&P 500 (1980-2020):
- Average nominal return: ~10-11% annually
- Average inflation: ~3% annually
- Average real return: ~7-8% annually
This substantial real return is why the stock market has been the primary wealth-building vehicle for millions of investors, despite short-term volatility and the cycle of market emotions.
Example 3: The High-Dividend Stock Dilemma
Company XYZ:
- Stock price: $50
- Annual dividend: $4 per share
- Nominal dividend yield: 8%
- Inflation rate: 5%
- Real dividend yield: ~3%
While 8% sounds attractive, if the company doesn’t grow its dividend faster than inflation, your real income purchasing power remains relatively flat. This is why evaluating high dividend stocks requires looking beyond just the yield percentage.
Example 4: The Real Estate Reality
Property Investment:
- Purchase price: $300,000
- Sale price (10 years later): $450,000
- Nominal return: 50% or ~4.14% annually
- Average inflation over the period: 3%
- Real return: ~1.14% annually
The property “made” $150,000 nominally, but after accounting for inflation, the real gain in purchasing power was much smaller. Add in property taxes, maintenance, and transaction costs, and the real return might be close to zero or even negative.
Why Most Investors Ignore Real Returns (And Why You Shouldn’t)
The Psychological Trap of Nominal Thinking
Humans are wired to think in nominal terms. We see a 10% gain and feel wealthy. Our brains struggle with the abstract concept of purchasing power erosion.
This cognitive bias leads to several dangerous investment behaviors:
- Accepting low-yield “safe” investments that guarantee purchasing power loss
- Celebrating nominal gains without checking if they beat inflation
- Underestimating the need for growth in retirement portfolios
- Misunderstanding investment risk by focusing only on volatility, not inflation risk
Understanding why people lose money in the stock market often comes down to not understanding real returns and making emotional decisions based on nominal figures.
The Media’s Nominal Bias
Financial media typically reports nominal returns because:
- They’re simpler to understand
- They sound more impressive
- They don’t require inflation assumptions
- They’re easier to compare year-over-year
Headlines scream “S&P 500 up 15% this year!” but rarely mention “Real returns after 4% inflation: 11%.”
Using Real Return to Make Smarter Investment Decisions
1. Set Realistic Return Expectations
When planning for retirement or other long-term goals, always think in real return terms.
Retirement Planning Example:
- Goal: $2 million in 30 years
- Starting amount: $100,000
- Required nominal return at 3% inflation: ~10.6% annually
- Required nominal return at 5% inflation: ~12.9% annually
The inflation assumption dramatically changes what you need to achieve.
2. Compare Investment Options Fairly
Don’t compare apples to oranges. Adjust all returns for inflation before comparing.
Investment Comparison (All numbers are real returns after inflation):
- Treasury bonds: 0.5% to 2%
- Corporate bonds: 2% to 4%
- Real estate: 2% to 5%
- Stock market index: 6% to 8%
- Individual stocks: Highly variable (-100% to +20%+)
This is why making smart moves in investing requires understanding real returns across asset classes.
3. Rebalance Based on Real Performance
Don’t just rebalance based on nominal allocation percentages. Consider which assets are actually growing purchasing power.
4. Protect Against Inflation
Investments specifically designed to maintain purchasing power:
- TIPS (Treasury Inflation-Protected Securities): Principal adjusts with CPI
- I Bonds: Interest rate adjusts for inflation
- Real estate: Often appreciates with inflation
- Commodities: Prices typically rise with inflation
- Stocks: Companies can raise prices, protecting profit margins
Real Return and Retirement: The Critical Connection
For retirees, real return isn’t just academic; it’s survival.
The 4% Rule Reconsidered
The famous “4% withdrawal rule” assumes your portfolio generates returns that outpace inflation. If real returns fall short, the rule breaks down.
Example:
- Retirement portfolio: $1,000,000
- Annual withdrawal: $40,000 (4%)
- Nominal return: 6%
- Inflation: 4%
- Real return: ~2%
With only a 2% real return, withdrawing 4% means you’re drawing down principal in real terms. Your portfolio might last 25-30 years instead of indefinitely.
Sequence of Returns Risk
The order in which you experience returns matters enormously in retirement, especially when considering real returns.
Poor real returns early in retirement (due to high inflation or market crashes) can devastate a portfolio even if nominal returns look acceptable later.
Tax Considerations: After-Tax Real Return
The most accurate measure of investment success is after-tax real return—what you actually keep after taxes and inflation.
The Formula
After-Tax Real Return = [(Nominal Return × (1 – Tax Rate)) – Inflation Rate]
Example:
- Nominal return: 10%
- Tax rate: 25%
- Inflation: 3%
- After-tax nominal return: 10% × 0.75 = 7.5%
- After-tax real return: 7.5% – 3% = 4.5%
Tax-Advantaged Accounts
This is why retirement accounts (401(k), IRA, Roth IRA) are so powerful—they eliminate or defer the tax drag, improving your after-tax real return significantly.
Traditional 401(k) vs Taxable Account (30-year horizon):
- Investment: $10,000 annually
- Nominal return: 8%
- Tax rate: 25%
- Inflation: 3%
The 401(k) could end up with 40-60% more purchasing power due to tax deferral, even accounting for taxes on withdrawal.
Tools and Resources for Tracking Real Returns
Online Calculators
Several reliable calculators help you compute real returns:
- BLS Inflation Calculator: Official U.S. government tool for historical inflation
- Morningstar: Provides real return data for mutual funds
- Portfolio Visualizer: Backtesting tool showing real returns
- FRED (Federal Reserve Economic Data): Economic data, including inflation metrics
Tracking Inflation
Stay informed about current inflation using:
- Consumer Price Index (CPI): Most common inflation measure
- Personal Consumption Expenditures (PCE): Federal Reserve’s preferred metric
- Core inflation: Excludes volatile food and energy prices
Building Your Own Tracker
Create a simple spreadsheet with:
- Date
- Portfolio value
- Nominal return (%)
- Current inflation rate
- Real return calculation
- After-tax real return
Update quarterly or annually to stay aware of your true wealth trajectory.
Common Mistakes When Calculating Real Return
Mistake #1: Using the Wrong Inflation Measure
Not all inflation affects you equally. If you spend heavily on healthcare, the general CPI might understate your personal inflation rate.
Solution: Consider calculating personal inflation based on your actual spending categories.
Mistake #2: Ignoring Compounding Effects
The simple formula (Nominal – Inflation) works for single periods but understates the compounding impact over multiple years.
Solution: Use the Fisher equation for multi-year calculations or compound each year separately.
Mistake #3: Forgetting Taxes
Celebrating a 10% real return before taxes when you’re in a 35% tax bracket means your actual real return is much lower.
Solution: Always calculate after-tax real returns for taxable accounts.
Mistake #4: Using Average Instead of Actual Returns
Averaging returns can be misleading due to volatility.
Example:
- Year 1: +20%
- Year 2: -10%
- Average: 5%
- Actual compound return: ~3.9%
Solution: Use compound annual growth rate (CAGR) for multi-year periods.
Real Return Across Different Asset Classes
Understanding typical real returns helps set realistic expectations:
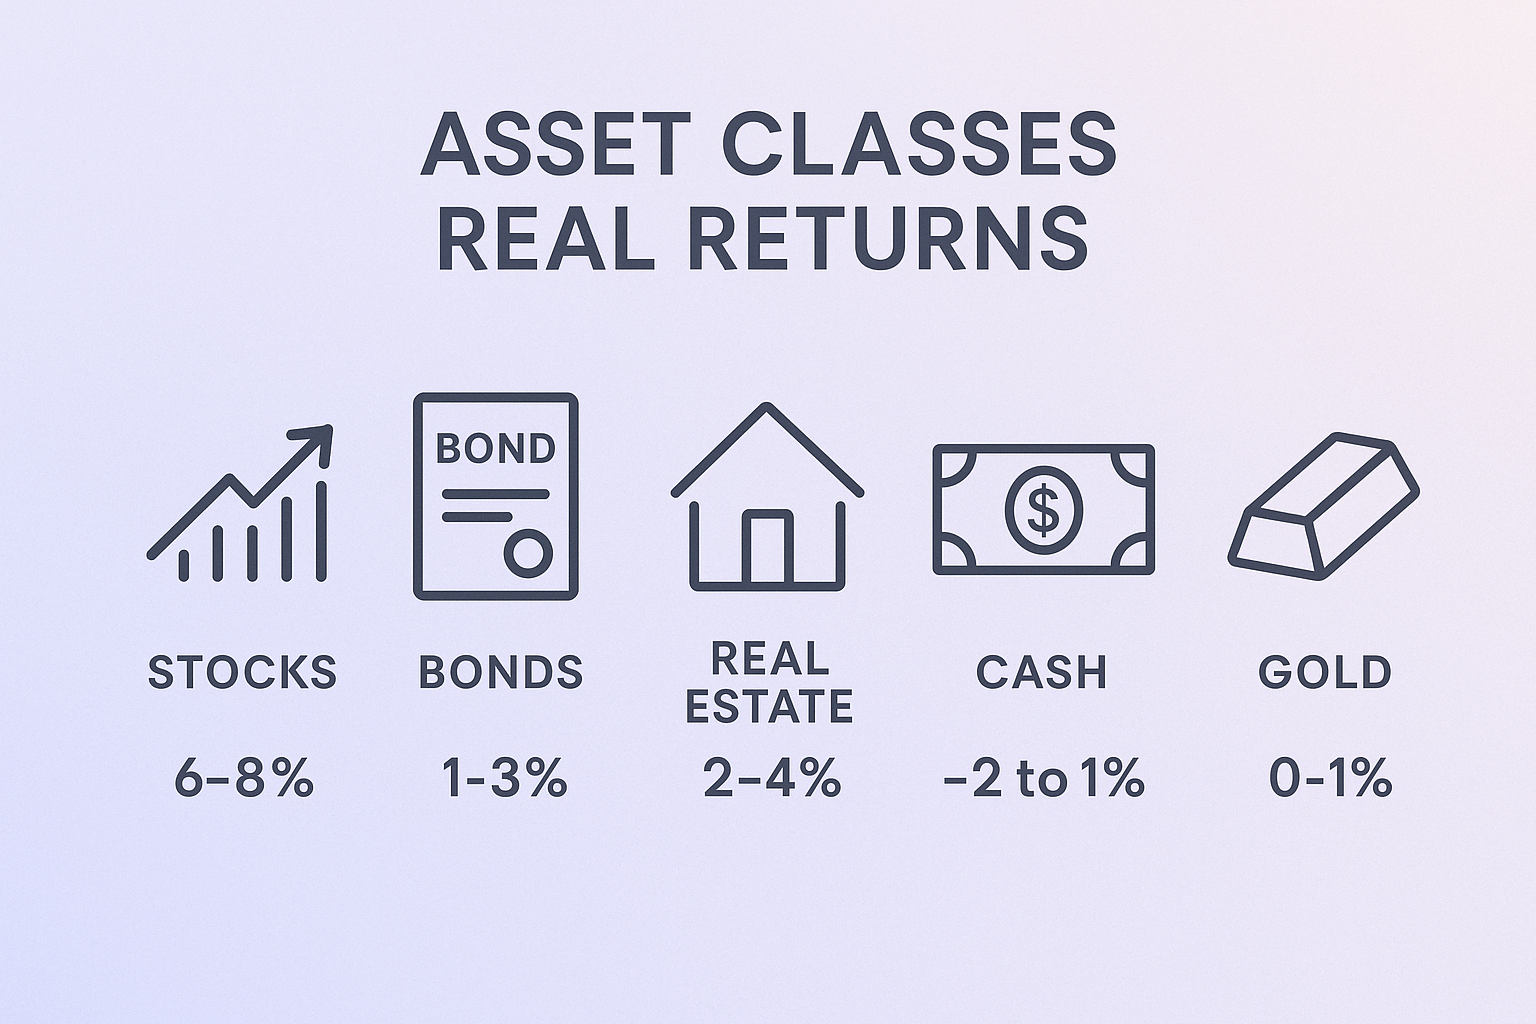
Stocks
- Historical real return: 6-8% annually
- Volatility: High (can swing 30% to +40% in a year)
- Inflation protection: Good (companies raise prices)
- Best for: Long-term growth
Bonds
- Historical real return: 1-3% annually
- Volatility: Low to moderate
- Inflation protection: Poor (fixed payments lose value)
- Best for: Income and stability
Real Estate
- Historical real return: 2-4% annually (excluding rental income)
- Volatility: Moderate
- Inflation protection: Good (rents and values rise with inflation)
- Best for: Diversification and income
Cash/Savings
- Historical real return: -2% to +1% annually (often negative)
- Volatility: None
- Inflation protection: None
- Best for: Emergency funds and short-term needs
Gold
- Historical real return: ~0-1% annually (highly variable)
- Volatility: Moderate to high
- Inflation protection: Excellent (hedge against currency devaluation)
- Best for: Portfolio insurance
This diversity is why building wealth through multiple streams often involves combining asset classes with different real return profiles. SmartAsset
Teaching Kids About Real Returns
If you’re focused on making your kid a millionaire, teaching the difference between nominal and real returns early creates a foundation for smart financial decisions.
Simple Lesson for Young Children (Ages 8-12)
The Ice Cream Example:
“If you have $10 today and ice cream costs $5, you can buy 2 ice creams. Next year, you still have $10, but ice cream now costs $6. Now you can only buy 1 ice cream and have $4 left over. Your money didn’t change, but what it can buy did change. That’s inflation!”
“If your money grows to $11 (10% return) but ice cream now costs $6 (20% price increase), you’re worse off than before even though you have more money.”
Lesson for Teenagers (Ages 13-18)
Show them real calculations with their savings or investment accounts. Help them track:
- Beginning balance
- Ending balance
- Nominal return
- Inflation rate for the period
- Real return
Make it tangible: “Your $500 grew to $535 (7% nominal return), but inflation was 4%, so your real return was only 3%. That means your money can buy 3% more stuff than it could last year, not 7% more.”
Advanced Concepts: Real Return in Portfolio Construction
Risk-Adjusted Real Returns
The Sharpe Ratio can be adapted to use real returns:
Real Sharpe Ratio = (Real Return – Risk-Free Real Rate) / Standard Deviation
This helps compare investments on a risk-adjusted basis after accounting for inflation.
Monte Carlo Simulation with Real Returns
When planning retirement, running Monte Carlo simulations with real returns (rather than nominal) provides more accurate probability of success estimates.
Key considerations:
- Model inflation as a variable, not a constant
- Use real withdrawal rates
- Adjust Social Security and pensions for inflation
- Consider the sequence of returns risk in real terms
Geographic Diversification and Real Returns
Different countries experience different inflation rates. International investing can provide real return diversification.
Example:
- U.S. stocks: 8% nominal, 3% inflation = 5% real
- Emerging market stocks: 12% nominal, 6% inflation = 6% real
- European stocks: 6% nominal, 2% inflation = 4% real
Currency fluctuations add another layer of complexity to real returns on international investments.
The Future of Real Returns: What to Expect in 2025 and Beyond
Current Economic Environment (2025)
As we navigate 2025, several factors influence real returns:
- Interest rates: Central bank policies affecting nominal returns
- Inflation trends: Post-pandemic inflation normalization
- Technological disruption: Deflationary pressure on some goods, inflationary on others
- Demographic shifts: Aging populations affecting economic growth
- Climate change: Potential inflationary impact on food and energy
Expert Projections
Most financial institutions project lower real returns going forward compared to historical averages:
- Stocks: 4-6% real returns (vs. 6-8% historical)
- Bonds: 0-2% real returns (vs. 2-3% historical)
- Real estate: 2-3% real returns (similar to historical)
Why lower? Higher valuations, lower economic growth, and potentially higher inflation create headwinds.
Positioning for Lower Real Returns
Strategies for a lower real return environment:
- Save more: If returns are lower, contributions matter more
- Extend time horizon: Give investments more time to compound
- Reduce fees: Every 0.5% in fees matters more when real returns are 4% vs. 8%
- Consider alternative investments: Private equity, real assets, infrastructure
- Stay diversified: Don’t chase high nominal returns in risky assets
Conclusion: Real Return Is the Only Return That Matters
The difference between nominal and real returns isn’t just an academic exercise—it’s the difference between building genuine wealth and running in place financially.
Remember these core principles:
✅ Always think in real terms when planning long-term financial goals
✅ Don’t be fooled by impressive nominal returns if inflation is eating them away
✅ Focus on after-tax real returns for the most accurate picture of wealth building
✅ Choose investments that historically beat inflation for long-term holdings
✅ Monitor inflation trends and adjust your strategy accordingly
Your Action Steps
- Calculate your current real return: Pull up last year’s investment statements and adjust for inflation.
- Set real return goals: Determine what real return you need to achieve your financial objective.s
- Review your portfolio allocation: Ensure you’re positioned to beat inflation over your investment horizon.
- Consider inflation-protected securities: Add TIPS or I Bonds if appropriate for your situation.
- Educate yourself continuously: Stay informed about inflation trends and economic conditions.s
The investors who build lasting wealth aren’t those who chase the highest nominal returns; they’re the ones who understand that real return is the only scorecard that truly matters. Start measuring your success in purchasing power, not just account balances, and you’ll make fundamentally better financial decisions.
Remember: A dollar tomorrow is only valuable if it can buy more than a dollar can buy today. That’s the essence of real return, and that’s the path to genuine financial freedom.
About the Author
Max Fonji is a financial educator and investment strategist with over 15 years of experience helping everyday investors build wealth through evidence-based strategies. He specializes in breaking down complex financial concepts into actionable insights that anyone can understand and implement. Max holds a degree in Economics and is passionate about financial literacy education. When he’s not analyzing markets or writing about investing, he enjoys hiking and teaching his own kids about money management.
Disclaimer
This article is for educational and informational purposes only and should not be construed as financial, investment, tax, or legal advice. The information provided is based on general market principles and historical data, which may not reflect future performance. Investment returns, inflation rates, and tax situations vary by individual circumstances. Past performance does not guarantee future results. Before making any investment decisions, please consult with a qualified financial advisor, tax professional, or legal expert who can assess your specific situation. All investment involves risk, including the potential loss of principal. The author and publisher are not responsible for any financial decisions made based on the information in this article.
💰 Real Return Calculator
Calculate your actual investment returns after inflation