Imagine Sarah, a 28-year-old teacher, who invested $1,000 in a stock last year and received $1,200 back today. She’s thrilled but confused – what exactly is her return, and how should she calculate it? Understanding returns is the cornerstone of successful investing, yet many beginners struggle with this fundamental concept that determines whether their financial goals become reality or remain distant dreams.
Key Takeaways
- Return measures the gain or loss on an investment over a specific period, expressed as a percentage or dollar amount
- Multiple types of returns exist, including nominal, real, absolute, and annualized returns, each serving different analytical purposes
- Basic return formula: (Ending Value – Beginning Value) / Beginning Value × 100
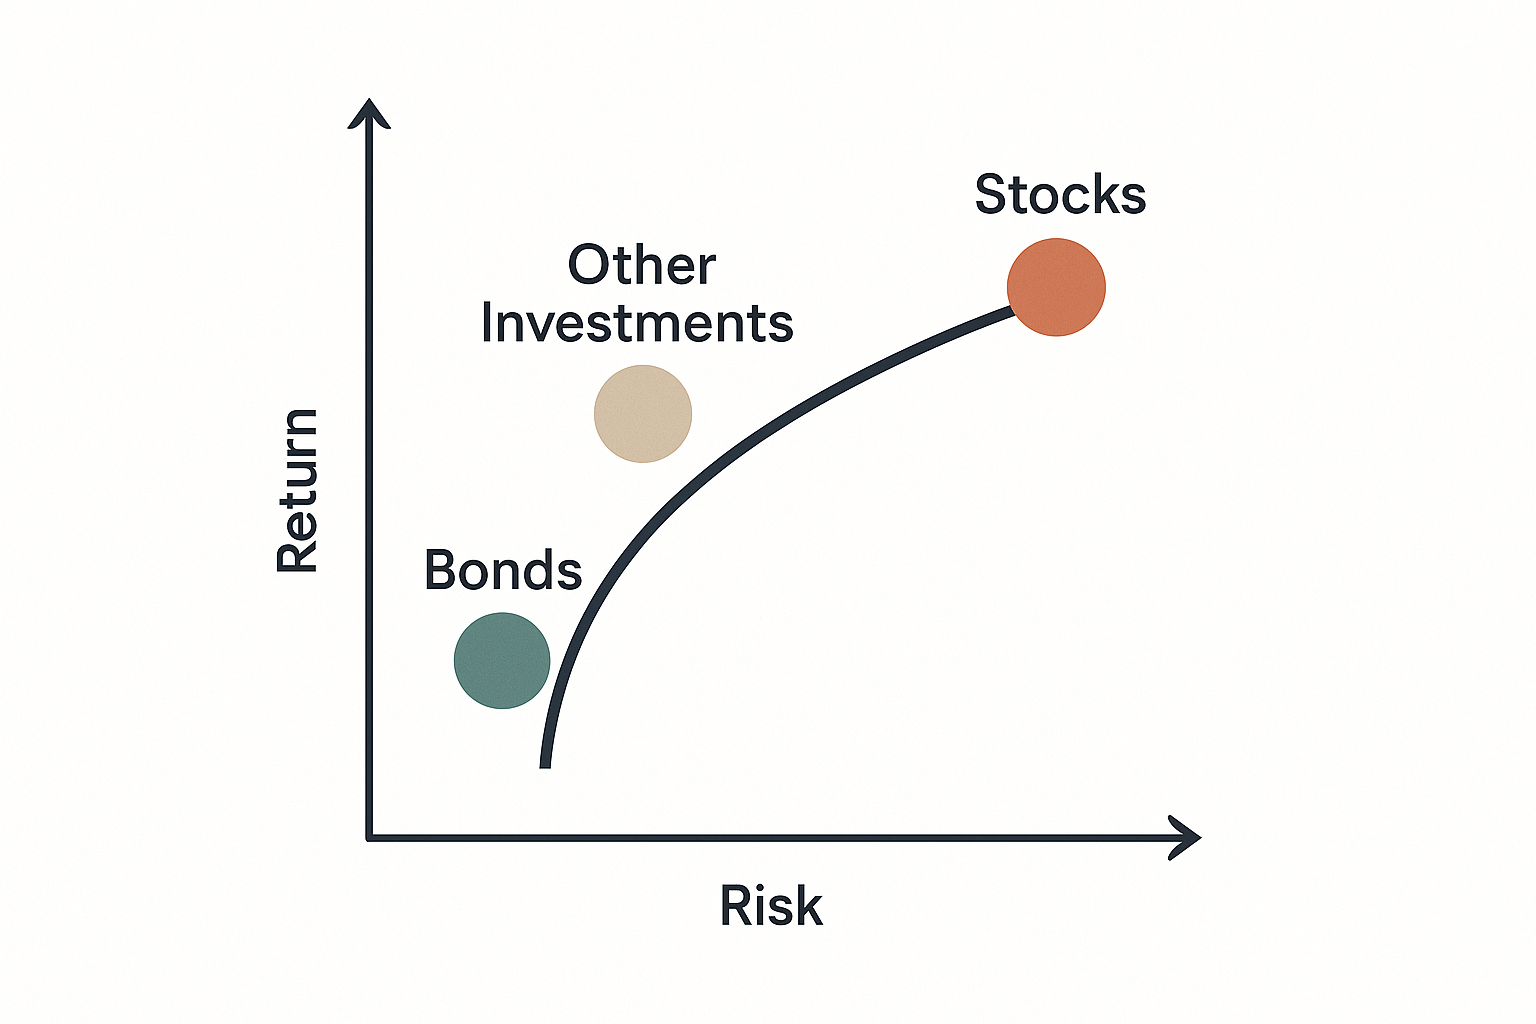
- Risk and return are interconnected – higher potential returns typically come with increased risk
- Understanding returns helps investors make informed decisions and compare investment opportunities effectively
Understanding the Basics: What is Return?
Return represents the money gained or lost on an investment over a specific time period. Think of it as the report card for your investment decisions – it tells you whether your money worked hard for you or took an extended vacation.
In simple terms, return answers the question: “How much did my investment grow (or shrink) compared to what I initially put in?”
Why Returns Matter More Than You Think
Returns serve as the universal language of investing. Whether you’re comparing:
- Different stocks
- Mutual funds
- Real estate investments
- Savings accounts
Returns provide a standardized method for evaluating performance. Without understanding returns, you’re essentially driving blindfolded on the investment highway.
Types of Returns: The Complete Breakdown
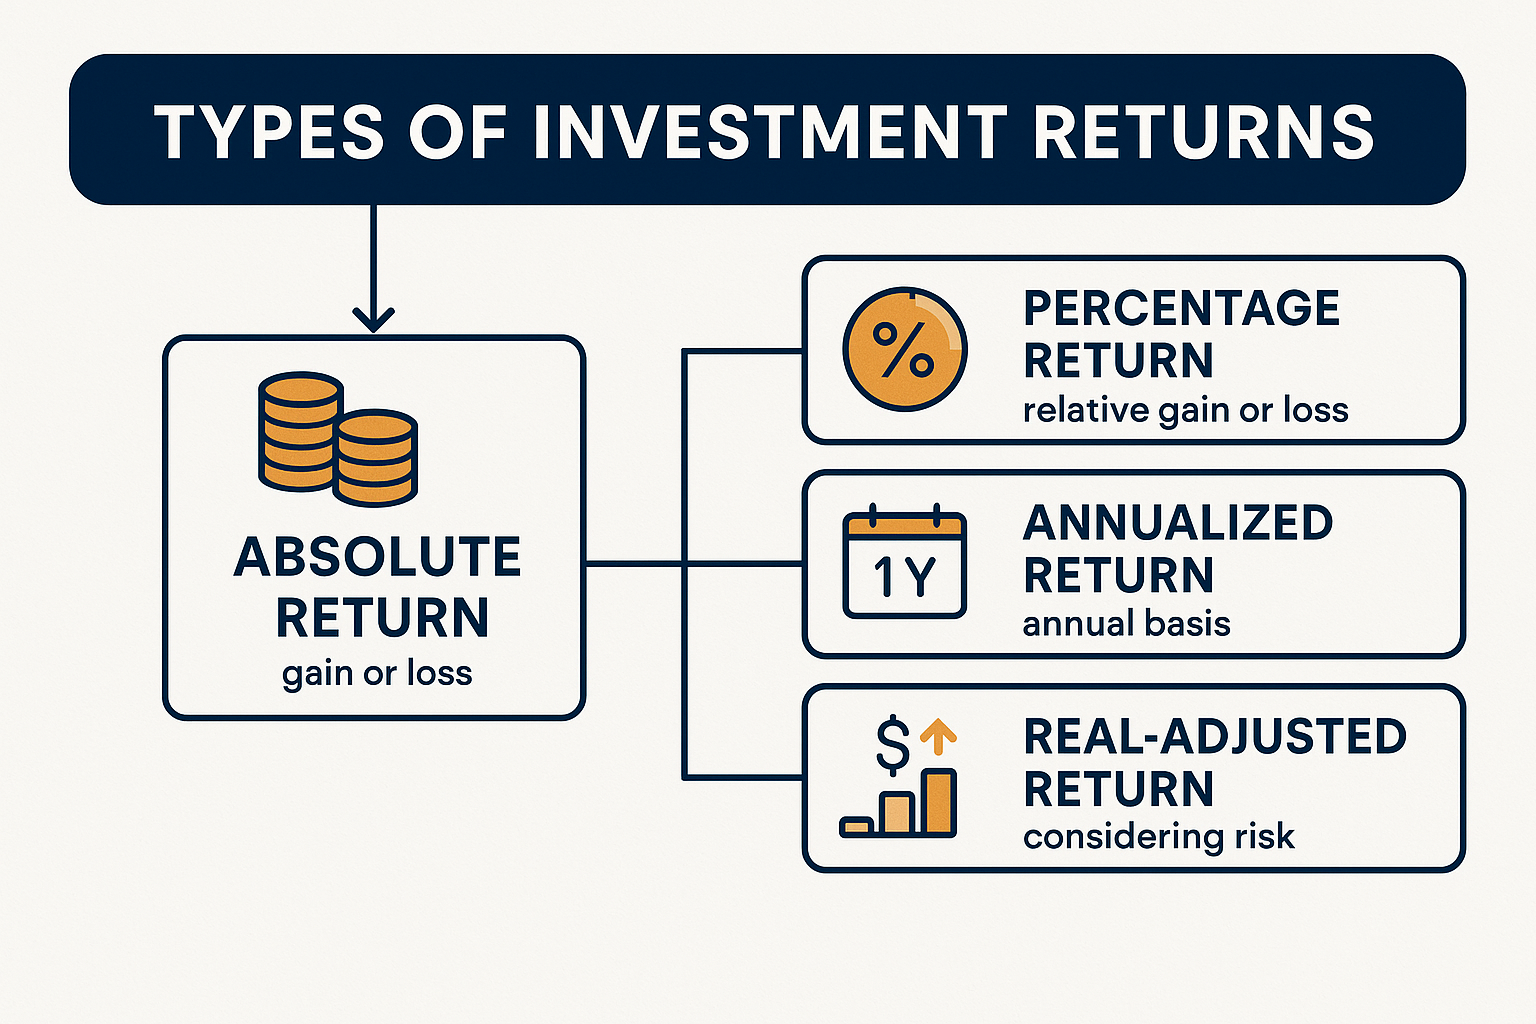
1. Absolute Return
Absolute return measures the total percentage gain or loss regardless of the time period. Hedge funds often use this measure.
See the full guide: Absolute Return.
Formula: Ending Value – Beginning Value
Example: If you invest $500 and get back $600, your absolute return is $100.
2. Percentage Return
Expresses return as a percentage of the original investment, making it easier to compare different investments.
Formula: (Ending Value – Beginning Value) / Beginning Value × 100
Example: Using the same numbers above: ($600 – $500) / $500 × 100 = 20%
3. Annualized Return
Annualized return expresses the average yearly gain or loss over multiple years, making it easier to compare investments of different durations.
See the full calculation in Annualized Return.
Formula: [(Ending Value / Beginning Value)^(1/number of years)] – 1
4. Real Return
Adjusts for inflation to show the actual purchasing power gained or lost.
Formula: [(1 + Nominal Return) / (1 + Inflation Rate)] – 1
5. Risk-Adjusted Return
Risk-adjusted return measures how much return an investment generates relative to the amount of risk taken. It’s essential for comparing portfolios or fund managers. Learn more in Risk-Adjusted Return.
6. Nominal vs Real Return
Nominal return doesn’t consider inflation. Real return adjusts for inflation, showing the true increase in purchasing power.
If inflation is 3% and your nominal return is 8%, your real return is 5%. See full guide: Nominal vs Real return
7. Total Return
Total return includes all sources of profit: price appreciation, dividends, and interest. It provides the most complete picture of an investment’s performance over time. See our full guide on Total Return.
Essential Return Formulas Every Investor Should Know
Basic Return Formula
Return (%) = (Current Value - Initial Investment) / Initial Investment × 100Imagine you invest $10,000 in a mutual fund. After one year, your investment is worth $10,800. Using the formula.
Return = (10,800 – 10,000) / 10,000 × 100 = 8%
This means your investment earned an 8% return for that year
Compound Annual Growth Rate (CAGR)
CAGR = (Ending Value / Beginning Value)^(1/n) - 1Where n = number of years
Total Return Including Dividends
Total Return = (Price Change + Dividends) / Initial Price × 100Including Dividends and Interest
For stocks or funds that pay dividends, or bonds that pay interest, you need to include those payments in the total return calculation.
If your stock rose from $100 to $110 and also paid $2 in dividends, your total return would be:
(110 – 100 + 2) / 100 × 100 = 12%
You can explore a detailed breakdown of this concept in our Total Return Guide
Real-World Return Calculations: Step-by-Step Examples
Example 1: Stock Investment
Scenario: Marcus bought 100 shares of XYZ Corp at $50 per share. One year later, the stock trades at $58, and he received $2 per share in dividends.
Calculation:
- Initial Investment: 100 × $50 = $5,000
- Current Value: 100 × $58 = $5,800
- Dividends Received: 100 × $2 = $200
- Total Return: ($5,800 + $200 – $5,000) / $5,000 × 100 = 20%
Example 2: Mutual Fund Investment
Scenario: Lisa invested $10,000 in a mutual fund. After 3 years, her investment is worth $13,500.
Simple Return: ($13,500 – $10,000) / $10,000 × 100 = 35%
Annualized Return: ($13,500 / $10,000)^(1/3) – 1 = 10.5% per year
The Risk-Return Relationship: What Every Beginner Must Understand
“The fundamental law of investing: higher potential returns come with higher potential risks.”
Understanding this relationship enables investors to make informed decisions about their risk tolerance and investment objectives.
Risk Categories and Expected Returns
| Risk Level | Investment Type | Expected Annual Return |
|---|---|---|
| Low | Government Bonds | 2-4% |
| Moderate | Blue-chip Stocks | 6-8% |
| High | Growth Stocks | 8-12% |
| Very High | Cryptocurrency | Highly Variable |
In this example, stocks produce higher returns but with more volatility. Bonds yield less but provide stability. Depending on your goals and tolerance for risk, either could be appropriate.
Case Study: The Power of Compounding Returns
Let’s say you invest $10,000 at an 8% annual return, compounded annually. Over 10 years:
| Year | Investment Value |
|---|---|
| 1 | $10,800 |
| 3 | $12,597 |
| 5 | $14,693 |
| 10 | $21,589 |
This example shows how consistent returns compound into substantial growth over time. That’s why long-term investing often outperforms short-term speculation. The U.S. SEC’s Return Calculator
Common Return Calculation Mistakes to Avoid
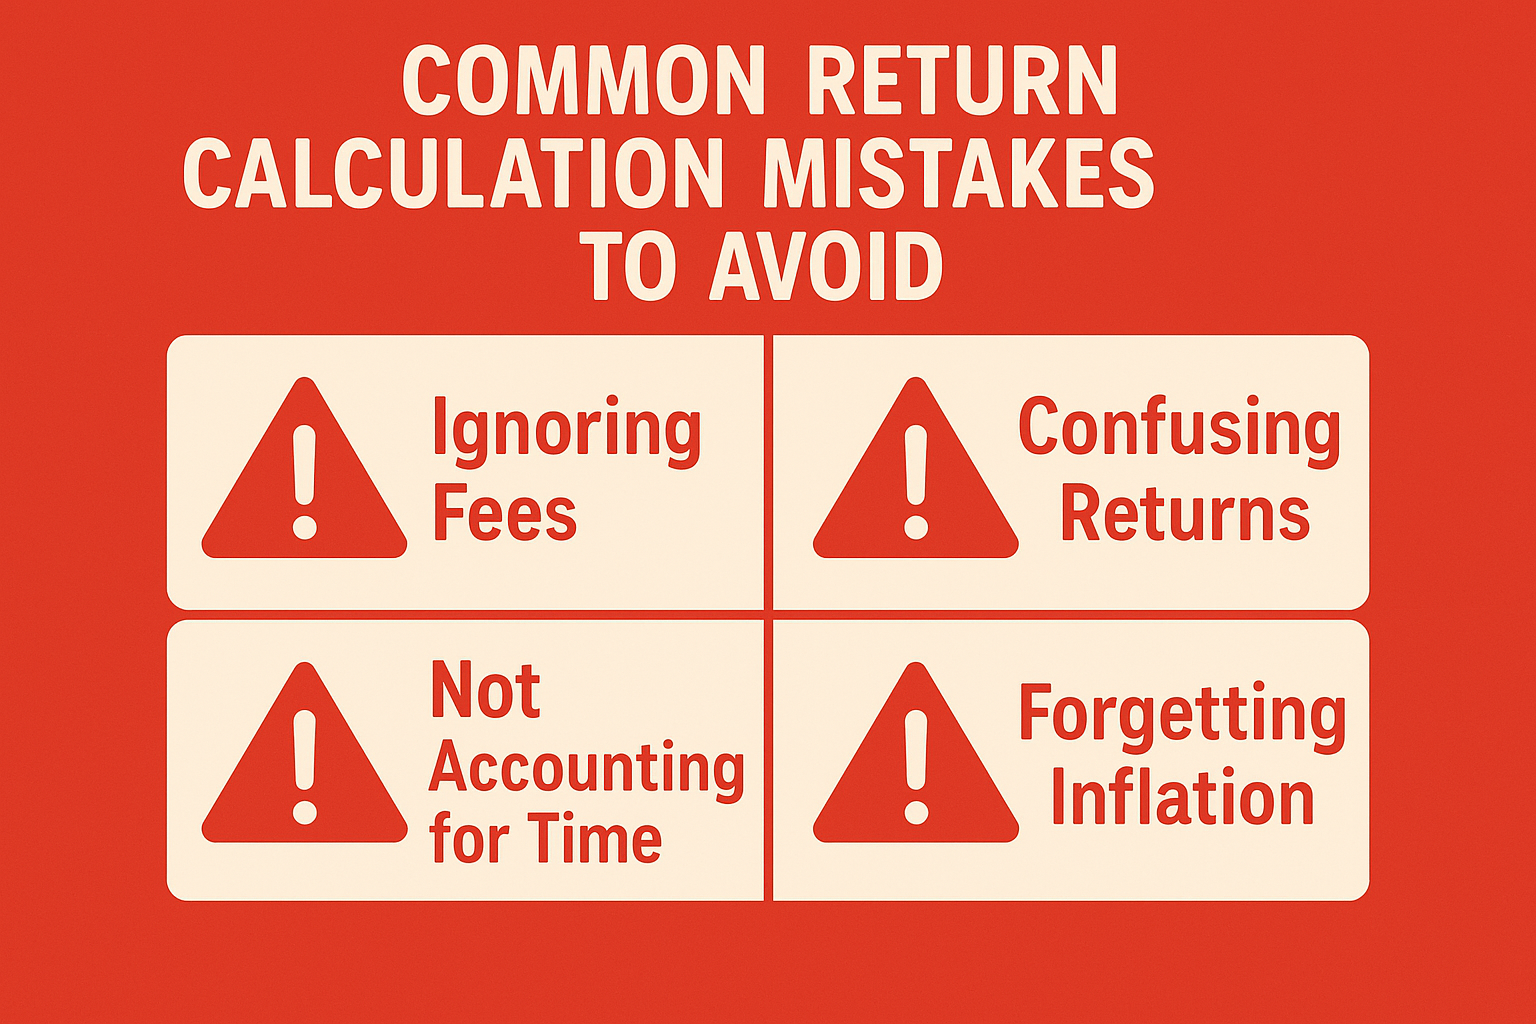
1. Ignoring Fees and Expenses
Many beginners forget to subtract management fees, transaction costs, and taxes from their return calculations.
2. Confusing Absolute and Percentage Returns
A $100 gain means different things if you invested $1,000 versus $10,000.
3. Not Accounting for Time
A 20% return over 5 years is very different from a 20% return over 1 year.
4. Forgetting About Inflation
A 3% return during a 4% inflation period actually represents a -1% real return.
Factors That Influence Investment Returns
Market Conditions
- Bull markets typically generate higher returns
- Bear markets often result in negative returns
- Economic cycles significantly impact return patterns
Investment Duration
- Short-term investments (under 1 year) face higher volatility
- Long-term investments (5+ years) benefit from compound growth
- Time horizon affects risk tolerance and return expectations
Diversification Impact
Spreading investments across different assets can:
- Reduce overall portfolio risk
- Smooth out return volatility
- Potentially improve risk-adjusted returns
Practical Tips for Maximizing Your Returns
1. Start Early
The power of compound interest means starting early can dramatically increase long-term returns, even with smaller initial investments.
2. Regular Monitoring
Review your investments quarterly, but avoid making emotional decisions based on short-term fluctuations.
3. Reinvest Dividends
Automatically reinvesting dividends can significantly boost long-term returns through compounding.
4. Consider Tax Implications
Understanding how different investments are taxed can help optimize after-tax returns.
Return Benchmarking: Measuring Your Success
Common Benchmarks
- S&P 500 Index: For U.S. stock investments
- Bond Indices: For fixed-income investments
- Inflation Rate: For real return calculations
- Risk-free Rate: Typically, 10-year Treasury bonds
How to Use Benchmarks
Compare your returns to relevant benchmarks to assess whether your investment strategy is working effectively.
📊 Investment Return Calculator
Morningstar’s investment calculator
Advanced Return Concepts for Growing Investors
Dollar-Cost Averaging Returns
When investing regular amounts over time, calculating returns becomes more complex. The Internal Rate of Return (IRR) method provides the most accurate assessment for these scenarios.
Sector-Specific Return Patterns
Different market sectors exhibit unique return characteristics:
- Technology stocks: Higher volatility, potential for significant returns
- Utility stocks: Lower volatility, steady dividend income
- Healthcare: Moderate growth with defensive characteristics
Building a Return-Focused Investment Strategy
Setting Realistic Return Expectations
Based on historical data and current market conditions, consider these guidelines:
- Conservative portfolios: 4-6% annual returns
- Moderate portfolios: 6-8% annual returns
- Aggressive portfolios: 8-12% annual returns
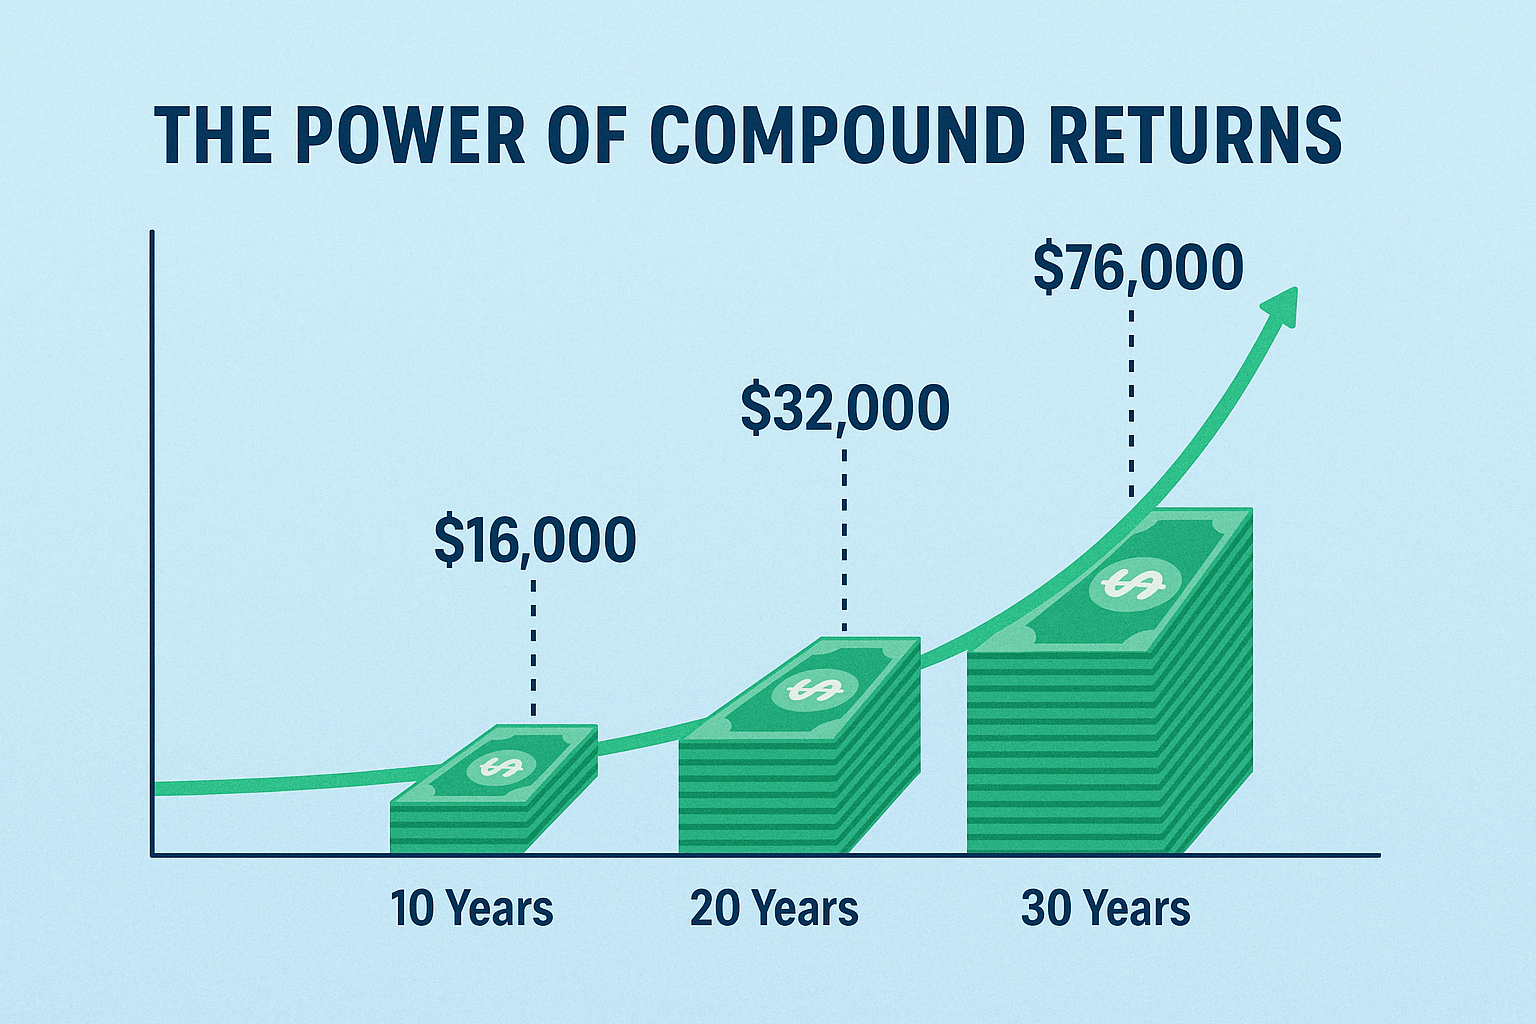
The Power of Compound Returns
Albert Einstein allegedly called compound interest "the eighth wonder of the world." Here's why:
Example: $10,000 invested at 7% annual return
- After 10 years: $19,672
- After 20 years: $38,697
- After 30 years: $76,123
Return Analysis Tools and Resources
Essential Metrics to Track
- Sharpe Ratio: Measures risk-adjusted returns
- Beta: Compares investment volatility to the market
- Alpha: Measures performance versus benchmark
- Standard Deviation: Indicates return volatility
Recommended Platforms
- Brokerage statements: Primary source for return data
- Portfolio tracking apps: For a consolidated view
- Financial websites: For benchmark comparisons
Tax Implications of Investment Returns
Understanding Tax Categories
- Short-term capital gains: Taxed as ordinary income
- Long-term capital gains: Preferential tax rates
- Dividend income: May qualify for lower tax rates
- Tax-deferred accounts: 401(k), IRA considerations
Strategies for Tax-Efficient Returns
- Hold investments longer than one year when possible
- Utilize tax-advantaged accounts
- Consider tax-loss harvesting
- Understand wash sale rules
Common Return Scenarios: What to Expect
Market Crash Recovery
Historical data indicate that markets typically recover from crashes within 2-3 years; however, individual stocks may take longer or may never recover.
Inflation Impact on Returns
During high inflation periods (like 2021-2022), nominal returns may look good while real returns disappoint.
Recession Effects
Economic downturns typically reduce returns across most asset classes, making diversification a crucial strategy.
Future Trends Affecting Investment Returns
Technology Disruption
Artificial intelligence, blockchain, and other emerging technologies are creating new investment opportunities with potentially higher returns.
ESG Investing
Environmental, Social, and Governance factors increasingly influence returns as investor preferences shift.
Global Market Integration
International diversification becomes more important as global markets become interconnected.
FAQ: Return
It depends on your goals and risk tolerance. Historically, the U.S. stock market has delivered about 10% annually, while bonds average around 5%.
Quarterly or annually is ideal. Frequent tracking can cause emotional decision-making.
A simple return only looks at the initial investment. Compound return includes reinvested earnings, which accelerate growth.
Yes. If inflation exceeds your nominal return, your purchasing power declines even if your account balance rises.
Because they show how much reward you get per unit of risk taken—important for comparing funds or portfolios.
Even a 1% annual fee can significantly reduce long-term gains. Always review expense ratios before investing.
Conclusion: Your Return Journey Starts Now
Understanding what return is, its types, formulas, and calculations forms the foundation of successful investing. From Sarah's simple stock gain to complex portfolio analysis, returns provide the compass for navigating investment decisions.
Key actions to take immediately:
- Calculate returns on your current investments using the formulas provided
- Set realistic return expectations based on your risk tolerance and time horizon
- Use the interactive calculator above to experiment with different scenarios
- Start tracking your returns regularly to identify patterns and opportunities
- Consider consulting with a financial advisor for personalized guidance
Remember, successful investing isn't about achieving the highest returns possible - it's about achieving consistent, risk-appropriate returns that help you reach your financial goals. Start small, stay consistent, and let the power of compound returns work in your favor.
The journey to financial success begins with understanding returns. Now that you have the knowledge and tools, the question isn't whether you can succeed - it's when you'll start applying what you've learned to build your financial future.
Disclaimer
This article is for educational and informational purposes only and should not be construed as financial, investment, or legal advice. The strategies discussed may not be suitable for all investors, and past performance does not guarantee future results. Before making any investment decisions, consult with a qualified financial advisor who understands your individual circumstances, goals, and risk tolerance. All investments carry risk, including the potential loss of principal.
About the Author
Max Fonji is a financial educator and senior content strategist with over 30 years of experience in personal finance, investing, and wealth building. He specializes in making complex financial concepts accessible to everyday investors and has helped thousands of people take control of their financial futures. Max writes for TheRichGuyMath.com, where he shares practical strategies for building wealth, understanding markets, and achieving financial independence. When he's not writing about finance, Max enjoys teaching financial literacy to young adults and volunteering with community financial education programs.