Picture this: Two companies each have $1 million in assets. Company A generates $200,000 in profit, while Company B only makes $50,000. Which one is using its resources more efficiently? This is exactly what Return on Assets (ROA) reveals, and it’s one of the most powerful metrics for understanding whether a business is truly making the most of what it owns.
Whether you’re an investor evaluating stock market opportunities, a business owner trying to boost profitability, or simply someone curious about financial health, understanding ROA can transform how you assess companies. It’s like a report card that shows how well a business converts its assets, everything from cash and equipment to buildings and inventory, into actual profits. Investopedia
In this comprehensive guide, we’ll break down everything you need to know about Return on Assets in plain English. You’ll learn what it means, how to calculate it, what makes a “good” ROA, and most importantly, how companies can improve this critical metric. Let’s dive in!
Key Takeaway
- Return on Assets (ROA) measures how efficiently a company uses its assets to generate profit, calculated by dividing net income by total assets.
- A higher ROA indicates better asset efficiency, though “good” ROA varies significantly by industry (tech companies often have 15%+ while retail may be 5-8%)
- ROA helps investors compare companies within the same industry and identify which businesses are managing resources most effectively
- Companies can improve ROA by increasing profit margins, reducing unnecessary assets, or optimizing asset utilization.
- ROA should never be used in isolation; combine it with other metrics like ROE, profit margins, and debt ratios for a complete financial analysis
What Is Return on Assets (ROA)?
Return on Assets (ROA) is a profitability ratio that measures how effectively a company uses its assets to generate earnings. In simpler terms, it answers the question: “For every dollar of assets this company owns, how much profit does it create?”
Think of ROA as a productivity score for a company’s balance sheet. If you owned a pizza restaurant with $100,000 worth of ovens, furniture, and equipment, and you made $15,000 in profit last year, your ROA would tell you exactly how well those assets are working for you. Corporate Finance Institute
Why ROA Matters
ROA is crucial for several reasons:
For Investors: It helps identify companies that are capital-efficient and don’t need massive asset bases to generate returns. This is particularly valuable when comparing companies in the same industry or evaluating high dividend stocks that need sustainable profitability.
For Business Owners: It highlights whether you’re getting adequate returns from your investments in equipment, inventory, real estate, and other assets.
For Lenders: Banks and creditors use ROA to assess whether a company can generate enough profit to service its debt obligations.
For Strategic Planning: A declining ROA might signal that a company is accumulating assets without proportional profit growth, a red flag for future performance.
According to data from the Federal Reserve and financial research, companies with consistently high ROA tend to outperform their peers over the long term, making this metric a cornerstone of fundamental analysis.
The Return on Assets Formula Explained
The basic Return on Assets formula is beautifully simple:
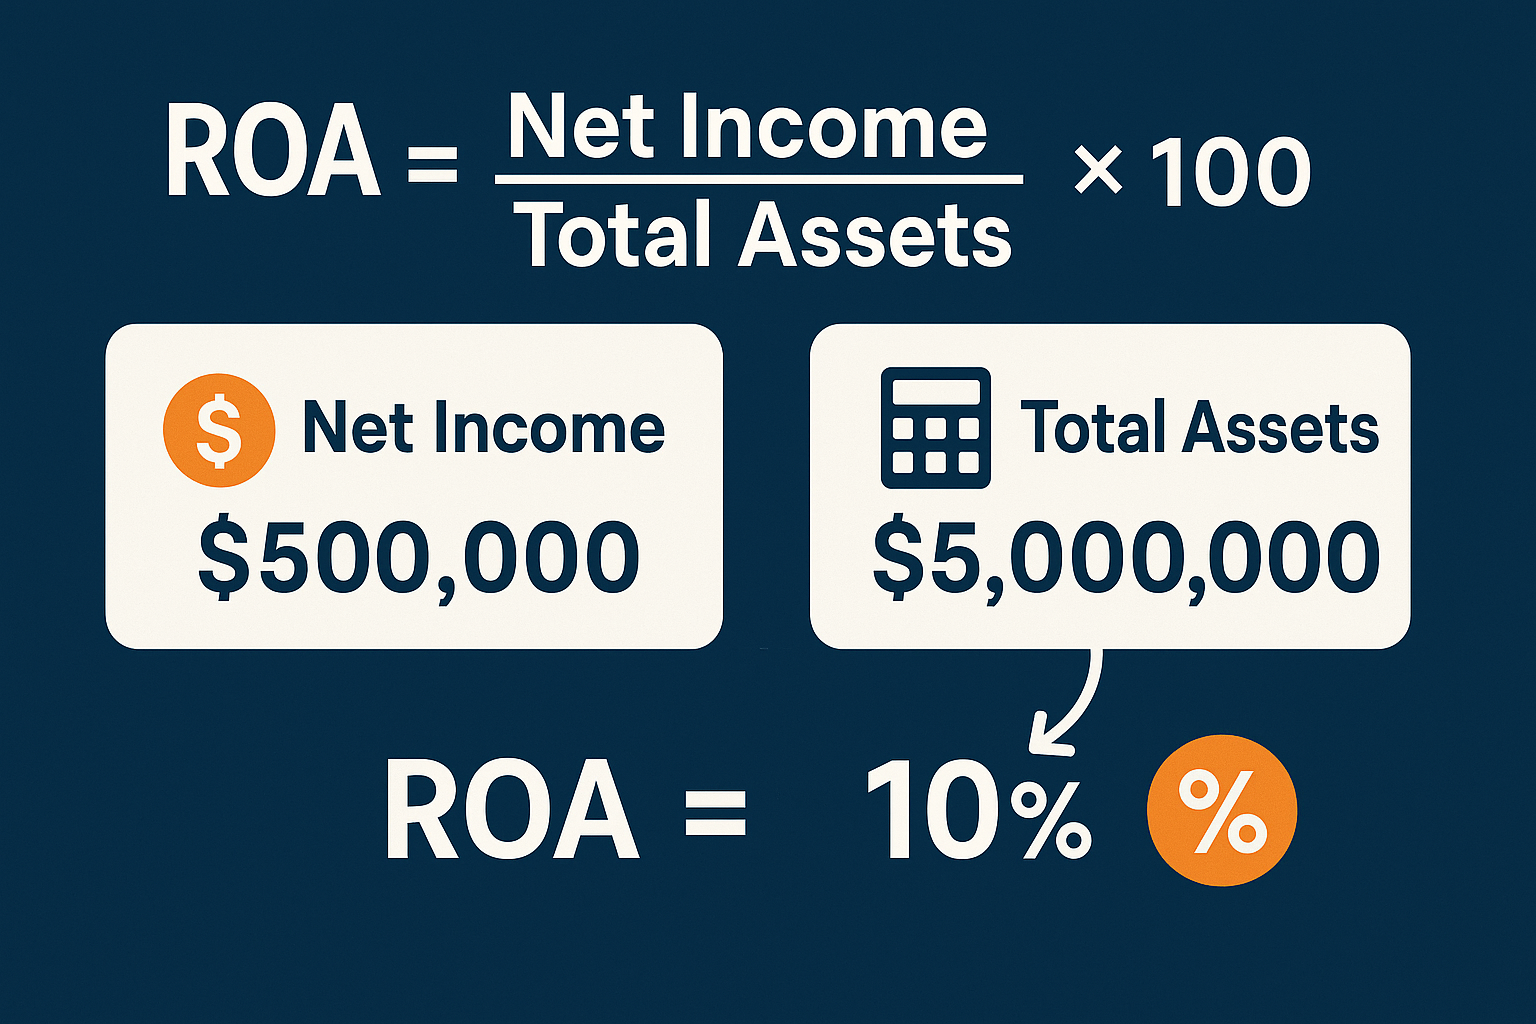
ROA = (Net Income / Total Assets) × 100
Let’s break down each component:
Net Income
This is the company’s profit after all expenses, taxes, and costs have been deducted. You’ll find this figure at the bottom of the income statement (hence the nickname “bottom line”). Net income represents what’s left over for shareholders after the company has paid everyone and everything else.
Total Assets
This encompasses everything the company owns that has economic value, cash, inventory, equipment, buildings, intellectual property, and more. Total assets appear on the balance sheet and include both current assets (cash, inventory) and long-term assets (property, equipment).
Example Calculation
Let’s say TechCorp reported:
- Net Income: $500,000
- Total Assets: $5,000,000
ROA = ($500,000 / $5,000,000) × 100 = 10%
This means TechCorp generates 10 cents of profit for every dollar of assets it owns. Not bad! Harvard Business
What’s a Good Return on Assets?
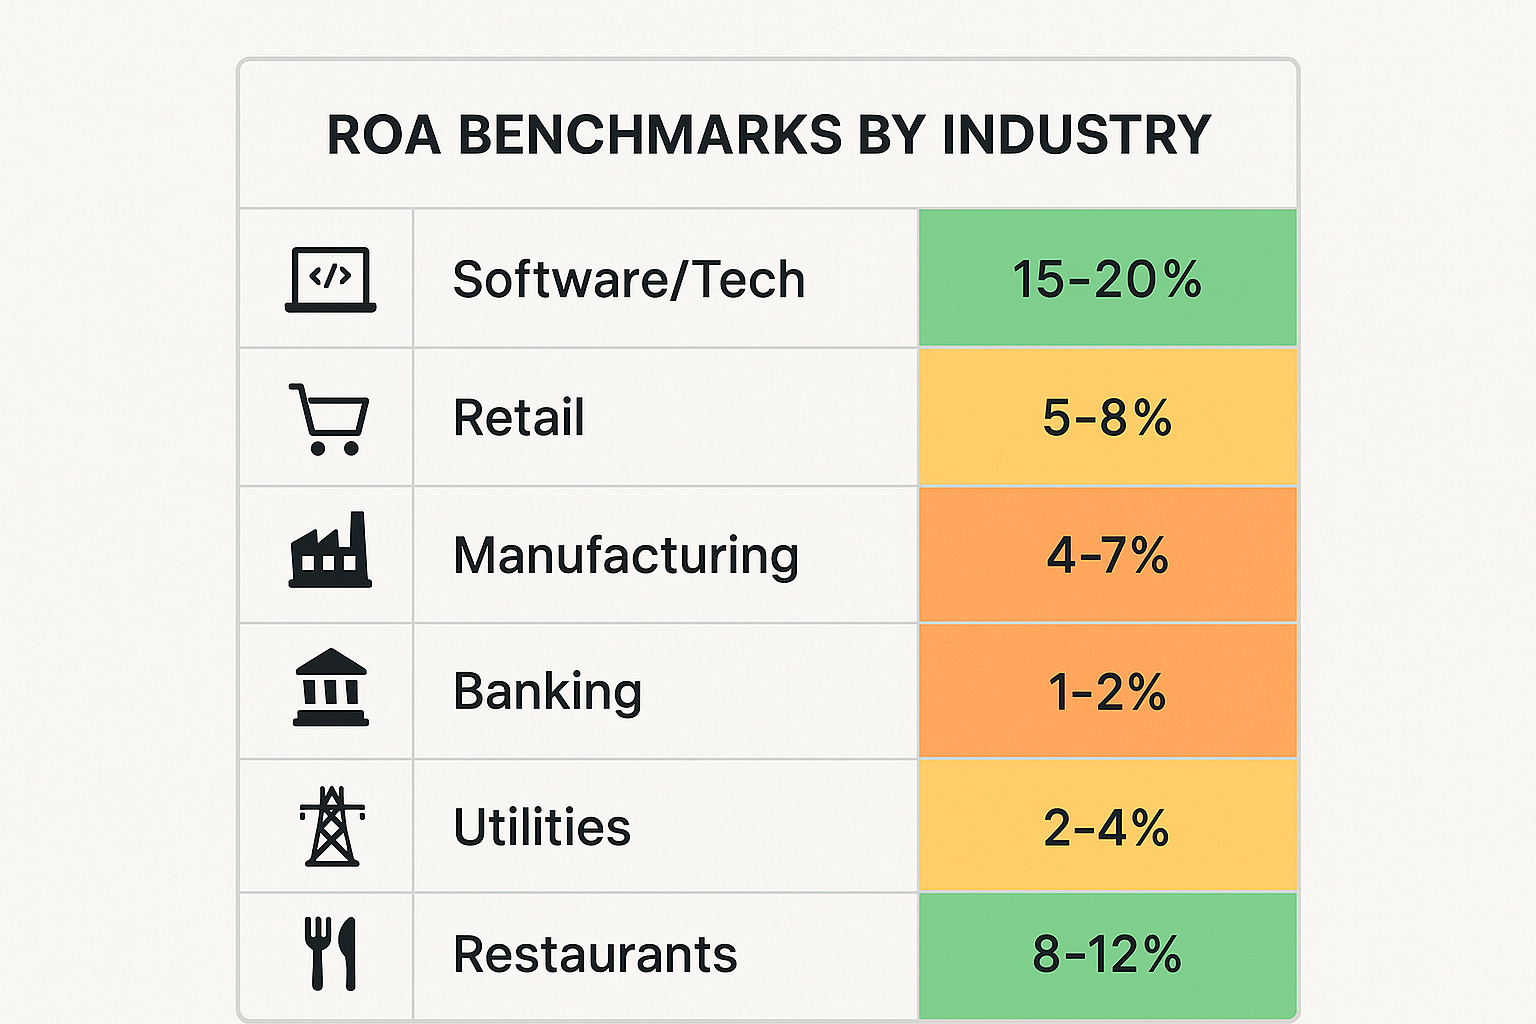
Here’s where things get interesting: there’s no universal “good” ROA. The benchmark varies dramatically by industry because different businesses require different asset levels to operate.
Industry Benchmarks
| Industry | Typical ROA Range | Why It Varies |
|---|---|---|
| Software/Tech | 15-20%+ | Low physical asset requirements, high margins |
| Retail | 5-8% | High inventory and real estate needs |
| Manufacturing | 4-7% | Heavy equipment and facility investments |
| Banking | 1-2% | Massive asset bases (loans are assets) |
| Utilities | 2-4% | Enormous infrastructure investments |
| Restaurants | 8-12% | Moderate asset base, variable efficiency |
Context Is Everything
A software company with 20% ROA might be average for its sector, while a manufacturing company with 8% ROA could be exceptional. This is why comparing ROA only makes sense within the same industry.
According to research from Morningstar and industry analysts, companies in the top quartile of ROA within their sector typically:
- Trade at premium valuations
- Show more consistent earnings growth
- Weather economic downturns better
- Provide superior long-term shareholder returns
The ROA Sweet Spot
As a general rule of thumb:
- ROA above 5% suggests decent asset efficiency
- ROA above 10% indicates strong performance
- ROA above 20% signals exceptional asset productivity (common in asset-light businesses)
- ROA below 0% means the company is losing money
However, always compare against industry peers and historical performance rather than using absolute numbers.
How to Calculate Return on Assets: Step-by-Step
Let’s walk through a real-world example using actual financial statement data.
Step 1: Locate Net Income
Open the company’s income statement (also called profit and loss statement). Scroll to the bottom line—that’s your net income. For this example, let’s say RetailCo shows:
- Revenue: $10,000,000
- Cost of Goods Sold: $6,000,000
- Operating Expenses: $2,500,000
- Interest and Taxes: $500,000
- Net Income: $1,000,000 ✓
Step 2: Find Total Assets
Now flip to the balance sheet. Total assets typically appear at the bottom of the asset section. For RetailCo:
- Current Assets: $3,000,000
- Property & Equipment: $4,000,000
- Other Long-term Assets: $1,000,000
- Total Assets: $8,000,000 ✓
Step 3: Apply the Formula
ROA = ($1,000,000 / $8,000,000) × 100 = 12.5%
RetailCo generates 12.5 cents of profit for every dollar of assets—quite strong for a retail business!
Step 4: Compare and Contextualize
Now compare this 12.5% against:
- RetailCo’s ROA from previous years (trending up or down?)
- Competitors in the retail sector
- Industry average (around 5-8% for retail)
RetailCo’s 12.5% ROA significantly exceeds the retail average, suggesting superior asset management. This might make it an attractive investment opportunity worth further investigation.
📊 Return on Assets Calculator
Your Return on Assets (ROA)
Formula: ROA = (Net Income / Total Assets) × 100
ROA vs ROE: What’s the Difference?
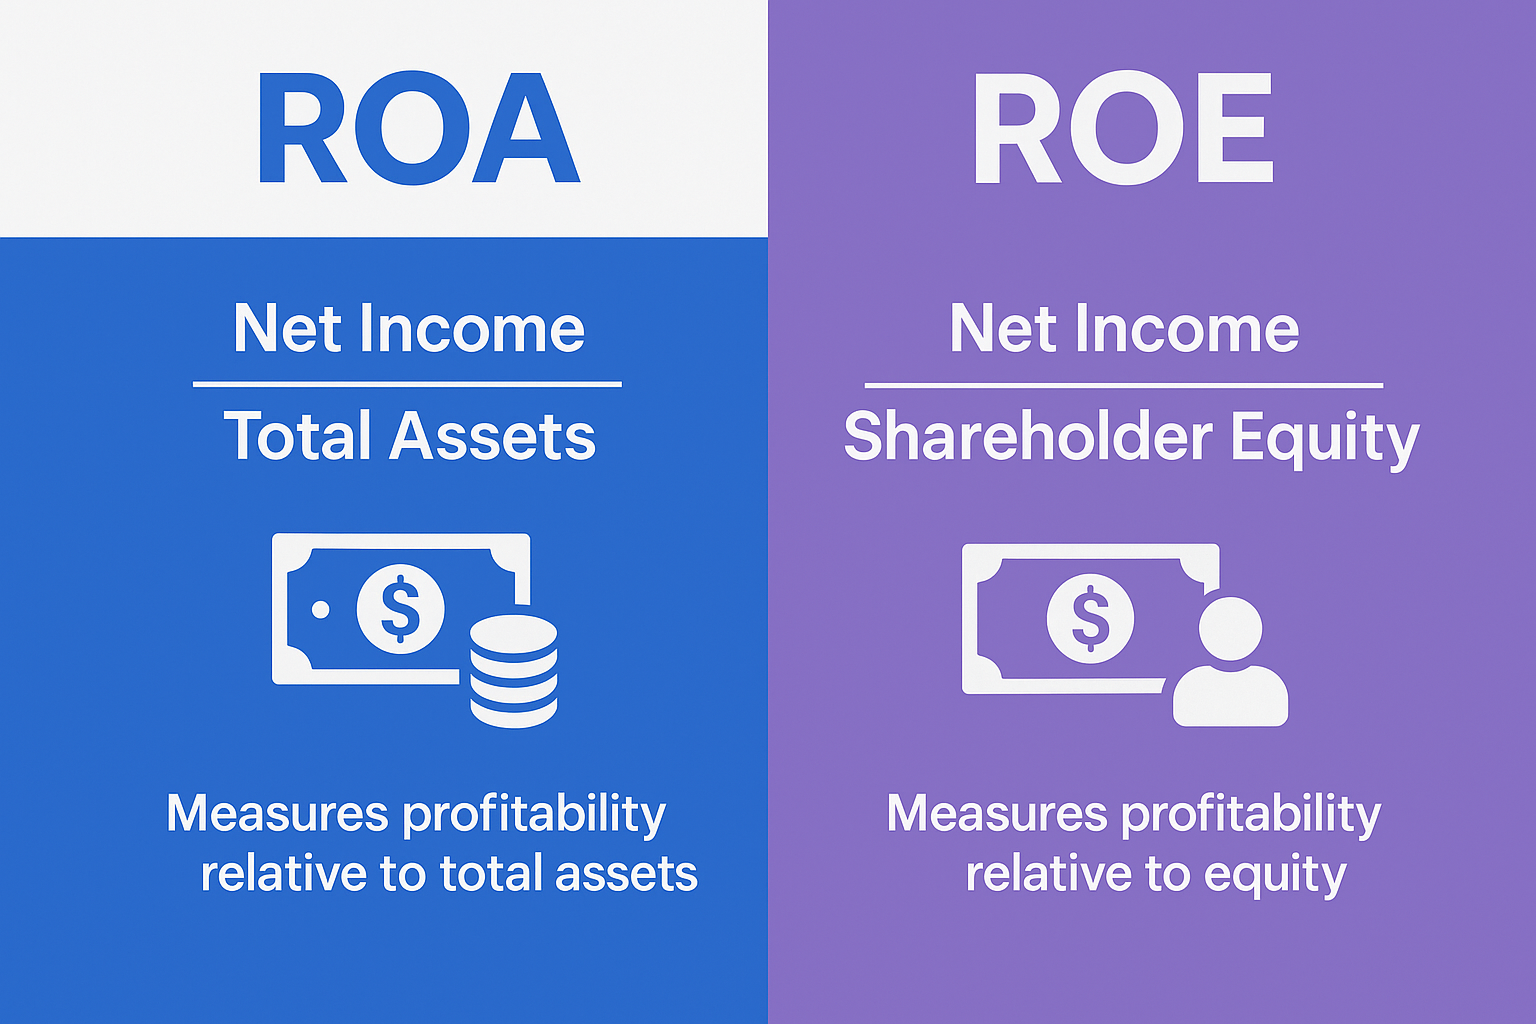
Many people confuse Return on Assets (ROA) with Return on Equity (ROE). While related, they measure different aspects of profitability.
Return on Assets (ROA)
- Formula: Net Income / Total Assets
- Measures: How efficiently a company uses ALL its assets (funded by both debt and equity)
- Perspective: Overall asset productivity
Return on Equity (ROE)
- Formula: Net Income / Shareholder Equity
- Measures: How much profit a company generates for shareholders, specifically
- Perspective: Shareholder return
A Real-World Comparison
Imagine Company X has:
- Net Income: $1,000,000
- Total Assets: $10,000,000
- Shareholder Equity: $4,000,000
ROA = ($1,000,000 / $10,000,000) × 100 = 10%
ROE = ($1,000,000 / $4,000,000) × 100 = 25%
Notice ROE is higher! This is because Company X uses $6,000,000 in debt (the difference between assets and equity). Debt amplifies returns to equity holders, for better or worse.
When to Use Which
Use ROA when:
- Comparing companies with different capital structures
- Evaluating overall operational efficiency
- Assessing management’s ability to generate returns from all available resources
Use ROE when:
- You’re a shareholder focused on your specific returns
- Evaluating how well management serves equity investors
- Comparing companies with similar debt levels
For a comprehensive view of why the stock market goes up over time, both metrics matter—companies with strong ROA and ROE tend to create long-term shareholder value.
Factors That Affect Return on Assets
Understanding what drives ROA helps both investors and business owners identify opportunities for improvement. Several key factors influence this crucial metric:
1. Profit Margins
Higher profit margins directly boost ROA. If a company can increase its net income while keeping assets constant, ROA rises automatically. This explains why:
- Software companies (70-80% gross margins) often have higher ROA
- Grocery stores (1-3% net margins) typically have lower ROA
2. Asset Intensity
Some businesses simply require more assets to operate:
- Asset-Heavy: Manufacturing, utilities, telecommunications (lots of equipment and infrastructure)
- Asset-Light: Consulting, software, professional services (minimal physical assets)
A consulting firm might achieve 25% ROA with minimal assets, while an equally profitable steel manufacturer might only reach 6% ROA due to massive equipment investments.
3. Asset Utilization
How actively are assets being used? Consider:
- A factory running at 95% capacity vs. 60% capacity
- Retail inventory that turns over 12 times yearly vs. 4 times
- Office space that’s fully utilized vs. half-empty
Better utilization means more revenue per dollar of assets, improving ROA.
4. Depreciation Methods
Accounting choices matter! Companies using accelerated depreciation show lower asset values sooner, which can artificially inflate ROA. Those using straight-line depreciation spread the reduction evenly, providing more stable ROA figures over time.
5. Asset Age
Older, fully-depreciated assets can inflate ROA because they’re carried on the balance sheet at low values. A company with $1 million in old equipment (book value: $100,000) will show higher ROA than one with $1 million in new equipment (book value: $1 million)—even if they generate identical profits.
This is why comparing ROA between companies with different asset ages requires caution.
6. Industry Dynamics
Different industries face unique challenges:
- Technology: Rapid obsolescence requires constant asset renewal
- Real Estate: Property values may appreciate, affecting asset bases
- Retail: Seasonal inventory fluctuations impact asset totals
- Banking: Regulatory requirements influence asset composition
Always benchmark ROA against industry peers, not across different sectors.
How to Improve Return on Assets
Whether you’re managing a business or evaluating investment opportunities, understanding how to improve ROA reveals the path to better financial performance. Here are proven strategies:
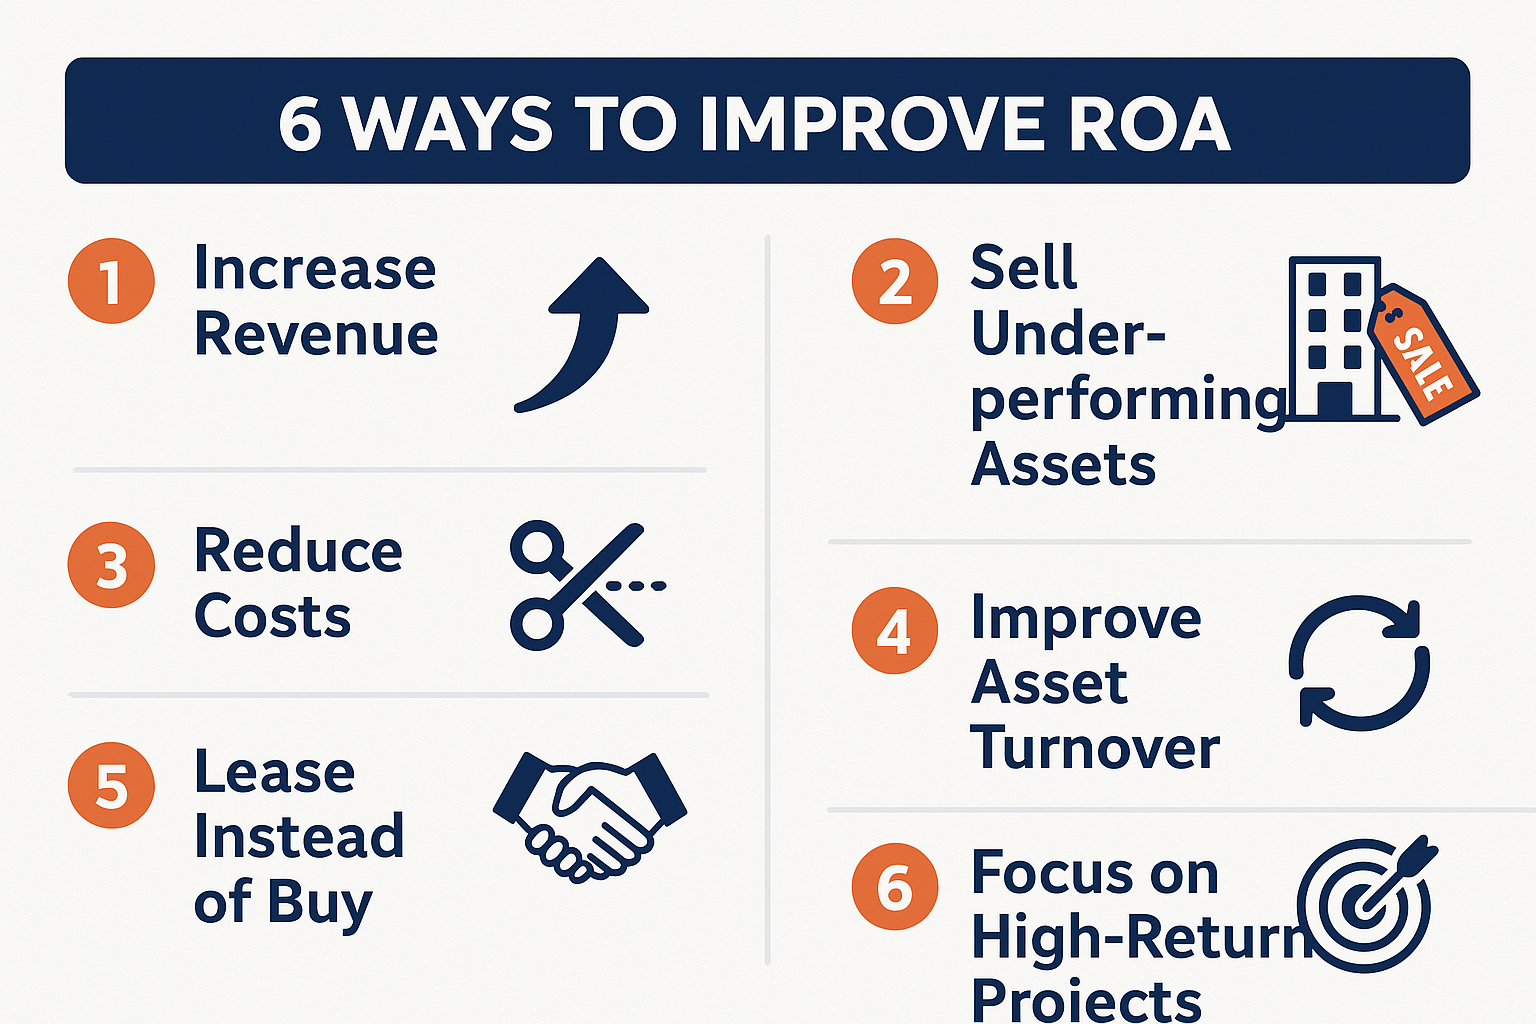
Strategy 1: Increase Revenue Without Adding Assets
The Goal: Generate more sales using existing resources.
How to Do It:
- Optimize pricing strategies to capture more value per sale
- Improve marketing efficiency to attract more customers without massive ad spending
- Enhance product mix by focusing on higher-margin offerings
- Expand into new markets using current infrastructure
Real Example: A software company that increases subscription prices by 15% (without losing customers) immediately improves ROA—same assets, more profit.
Strategy 2: Reduce Costs and Improve Margins
The Goal: Keep more of each revenue dollar as profit.
How to Do It:
- Negotiate better supplier terms to lower the cost of goods sold
- Streamline operations to reduce waste and inefficiency
- Automate repetitive processes to cut labor costs
- Reduce energy consumption and other overhead expenses
Real Example: A manufacturing company that reduces defect rates from 5% to 2% saves money on materials and rework, directly boosting net income and ROA.
Strategy 3: Sell Underperforming Assets
The Goal: Eliminate assets that aren’t pulling their weight.
How to Do It:
- Identify low-ROI assets (unused equipment, excess inventory, underutilized real estate)
- Sell or liquidate these assets
- Use proceeds to pay down debt or invest in higher-return opportunities
Real Example: A retail chain closes unprofitable locations, reducing total assets while maintaining (or even increasing) profitability—ROA improves.
Strategy 4: Improve Asset Turnover
The Goal: Generate more revenue from each dollar of assets.
How to Do It:
- Reduce inventory levels through just-in-time management
- Accelerate receivables collection to free up cash faster
- Increase equipment utilization (run factories longer, schedule better)
- Optimize warehouse space to reduce real estate needs
Real Example: A distributor that reduces average inventory from 90 days to 60 days lowers total assets while maintaining the same sales volume—ROA rises.
Strategy 5: Lease Instead of Buy
The Goal: Access necessary resources without inflating the asset base.
How to Do It:
- Lease equipment rather than purchasing it outright
- Rent warehouse space instead of buying facilities
- Use cloud services instead of owning servers
Important Note: While this improves ROA, it may increase operating expenses. Evaluate the total cost of ownership, not just the impact on ROA.
Strategy 6: Focus on High-Return Projects
The Goal: Invest only in assets that generate strong returns.
How to Do It:
- Establish minimum ROI thresholds for capital investments
- Conduct rigorous cost-benefit analysis before major purchases
- Prioritize projects that align with core competencies
- Avoid “vanity assets” that look good but don’t generate returns
This disciplined approach to capital allocation naturally improves ROA over time—a principle that applies equally to smart ways to make passive income as an individual investor.
Using ROA for Investment Decisions
For investors, Return on Assets serves as a powerful screening tool to identify well-managed, efficient companies. Here’s how to use it effectively:
Step 1: Screen for High ROA Within Industries
Start by filtering companies in your target sector by ROA. For example:
- In technology: Look for ROA above 15%
- In retail: Seek ROA above 8%
- In manufacturing: Target ROA above 6%
This immediately narrows your focus to companies demonstrating superior asset efficiency.
Step 2: Analyze ROA Trends Over Time
A single year’s ROA tells you where a company is; the trend tells you where it’s going.
Look for:
- ✅ Consistently high ROA (suggests sustainable competitive advantage)
- ✅ Improving ROA (indicates operational improvements or better asset management)
- ⚠️ Declining ROA (may signal deteriorating efficiency or increased competition)
- ⚠️ Volatile ROA (could indicate inconsistent management or cyclical challenges)
Plot ROA over 5-10 years to identify meaningful patterns beyond short-term fluctuations.
Step 3: Compare Against Competitors
Never evaluate ROA in isolation. Compare your target company against:
- Direct competitors
- Industry averages
- Market leaders
If Company A has 12% ROA while competitors average 8%, investigate what’s driving this outperformance. It might be:
- Superior management
- Better technology
- Stronger brand pricing power
- More efficient operations
These factors often translate into better investment returns, which is why understanding the cycle of market emotions helps you avoid overpaying even for high-ROA companies.
Step 4: Combine ROA with Other Metrics
ROA works best alongside complementary metrics:
| Metric | What It Reveals | Use Together Because |
|---|---|---|
| ROE | Shareholder-specific returns | Shows leverage impact |
| Profit Margin | Pricing power and cost control | Identifies profit drivers |
| Asset Turnover | Revenue efficiency | Separates margin from volume effects |
| Debt-to-Equity | Financial leverage | Explains ROE vs. ROA gap |
| P/E Ratio | Valuation | Ensures you’re not overpaying |
Step 5: Consider the Context
High ROA doesn’t always mean “buy.” Consider:
Growth Stage: Young, rapidly growing companies may have lower ROA as they invest heavily in future capacity. Mature companies should show higher, stable ROA.
Economic Cycle: ROA often declines during recessions as assets sit idle. Understanding why people lose money in the stock market often relates to ignoring cyclical impacts on metrics like ROA.
Accounting Quality: Companies can manipulate ROA through aggressive depreciation, asset write-downs, or other accounting choices. Always review footnotes and audit opinions.
Capital Intensity Changes: A company investing in major expansion may see ROA temporarily decline before the new assets become productive.
A Practical Investment Story
Meet Sarah, who was evaluating two restaurant chains for her portfolio:
Chain A: ROA of 15%, but trending down from 18% three years ago
Chain B: ROA of 11%, but trending up from 7% three years ago
On the surface, Chain A looked better. But deeper analysis revealed:
- Chain A was cutting maintenance spending (unsustainable)
- Chain B had invested in kitchen automation (now paying off)
Sarah chose Chain B, which continued improving and outperformed Chain A by 40% over the next three years. The ROA trend mattered more than the absolute number.
Common Mistakes When Analyzing ROA
Even experienced investors and business owners make these ROA-related errors:
Mistake 1: Comparing Across Industries
The Error: “Company X has 20% ROA while Company Y has 8%, so X is better!”
The Reality: If X is a software firm and Y is a grocery chain, they’re not comparable. Different industries have inherently different asset requirements.
The Fix: Only compare ROA within the same industry or sector.
Mistake 2: Ignoring Asset Quality
The Error: Taking balance sheet asset values at face value.
The Reality:
- Intangible assets (goodwill, patents) may be overvalued
- Physical assets may be obsolete despite book value
- Some assets (like brand value) aren’t even on the balance sheet
The Fix: Review asset composition and consider adjustments for intangibles or impaired assets.
Mistake 3: Overlooking Seasonal Variations
The Error: Calculating ROA at a single point in time.
The Reality: Retail companies have massive inventory before holidays; agricultural businesses have cyclical asset needs.
The Fix: Use average assets (beginning + ending assets / 2) or compare the same quarter year-over-year.
Mistake 4: Focusing Only on ROA
The Error: Making investment decisions based solely on ROA.
The Reality: A company might have high ROA, but:
- Crushing debt levels (check ROE and debt ratios)
- Declining market share (check revenue trends)
- Poor cash flow (check operating cash flow)
- Unsustainable practices (check sustainability reports)
The Fix: Use ROA as one tool in a comprehensive analysis toolkit.
Mistake 5: Misunderstanding Negative ROA
The Error: “Negative ROA always means avoid this company.”
The Reality: Startups and turnaround situations often show temporary negative ROA while building for the future. Amazon famously operated at a loss (negative ROA) for years while building infrastructure.
The Fix: Understand the business context and evaluate whether negative ROA is strategic and temporary or structural and permanent.
ROA in Different Business Scenarios
Let’s explore how ROA plays out in various real-world situations:
Scenario 1: The Startup Phase
Typical ROA: Often negative or very low
Why: Startups invest heavily in product development, market entry, and infrastructure before generating substantial revenue. Assets accumulate faster than profits.
What It Means: Low ROA is expected and acceptable if the business model is sound and the growth trajectory is strong.
Investor Perspective: Focus on revenue growth, customer acquisition costs, and path to profitability rather than current ROA.
Scenario 2: The Growth Phase
Typical ROA: Moderate and improving
Why: The company is generating profits but still investing in expansion. Assets and income grow in parallel.
What It Means: ROA should be trending upward as economies of scale kick in.
Investor Perspective: Look for accelerating ROA alongside revenue growth—this suggests scalable operations.
Scenario 3: The Mature Phase
Typical ROA: High and stable
Why: Growth has slowed, but the company has optimized operations and isn’t adding many new assets. Profit margins are strong.
What It Means: The company is efficiently extracting value from its asset base.
Investor Perspective: Excellent for dividend investing, as high ROA often supports sustainable dividend payments.
Scenario 4: The Decline Phase
Typical ROA: Declining or negative
Why: Revenue is falling faster than the company can reduce assets. Obsolete assets drag down efficiency.
What It Means: The business model may be failing or facing disruption.
Investor Perspective: Proceed with extreme caution. Even “value” prices may not compensate for fundamental deterioration.
Scenario 5: The Turnaround
Typical ROA: Low but improving
Why: New management is restructuring, selling underperforming assets, and focusing on core strengths.
What It Means: If successful, ROA improvement can signal a profitable investment opportunity.
Investor Perspective: Verify that ROA improvement comes from operational changes, not just accounting adjustments or asset sales.
Advanced ROA Concepts
For those ready to go deeper, these advanced concepts provide additional insight:
Adjusted ROA
Some analysts calculate adjusted ROA by:
- Removing goodwill and intangibles from total assets
- Adjusting for one-time gains or losses in net income
- Normalizing for unusual accounting events
Formula: Adjusted ROA = (Normalized Net Income / Tangible Assets) × 100
This provides a cleaner view of operational efficiency.
ROA and the DuPont Analysis
The DuPont framework breaks ROA into components:
ROA = Net Profit Margin × Asset Turnover
Where:
- Net Profit Margin = Net Income / Revenue
- Asset Turnover = Revenue / Total Assets
This reveals whether high ROA comes from:
- High margins (premium pricing, cost control)
- High turnover (efficient asset use, high volume)
Two companies with identical 10% ROA might achieve it very differently:
- Company A: 20% margin × 0.5 turnover = 10% ROA (luxury goods)
- Company B: 2% margin × 5 turnover = 10% ROA (discount retail)
Understanding this distinction helps predict how each company will perform under different economic conditions.
Pre-Tax ROA
Some analysts prefer pre-tax ROA to eliminate the impact of different tax situations:
Pre-Tax ROA = (Income Before Taxes / Total Assets) × 100
This is particularly useful when comparing companies across different countries or tax jurisdictions.
Industry-Adjusted ROA
Industry-adjusted ROA compares a company’s ROA to its sector average:
Industry-Adjusted ROA = Company ROA – Industry Average ROA
A positive number indicates above-average performance; a negative number suggests below-average.
ROA and Long-Term Wealth Building
Understanding and applying ROA principles extends beyond evaluating public companies—it’s a framework for building wealth more broadly.
For Business Owners
Think like an ROA optimizer:
- Before buying equipment, calculate the expected ROA
- Regularly audit assets for underperformance
- Focus on high-margin products and services
- Invest in training and systems that improve asset productivity
This mindset naturally leads to more profitable, sustainable businesses.
For Individual Investors
Apply ROA thinking to your portfolio:
- Your “assets” are your investment capital
- Your “returns” are dividends, interest, and capital gains
- Calculate your personal ROA: (Annual Investment Returns / Total Investment Capital) × 100
Ask yourself: “Am I getting adequate returns from my invested assets?” If not, consider:
- Diversifying into higher-return asset classes
- Reducing cash drag (excess uninvested cash)
- Eliminating underperforming investments
- Improving investment knowledge and skills
This approach aligns with smart moves that successful investors make consistently.
For Parents Building Generational Wealth
The principles behind ROA apply to how to make your kid a millionaire:
- Start with “assets” (initial investment) early
- Maximize “returns” (compound growth) through time
- Minimize “asset drag” (fees, taxes, poor investment choices)
- Optimize “asset allocation” for the time horizon
A child’s investment account that compounds at 10% annually demonstrates excellent “personal ROA” over decades.
Yes! Extremely high ROA (above 30-40%) might indicate:
The company is underinvesting in growth
Accounting irregularities
Unsustainable business practices
An asset-light model that could face new competition
Always investigate unusually high ROA to understand the source
Most investors calculate ROA:
Quarterly for active monitoring
Annually for long-term trends
Before major investment decisions
Companies typically report financials quarterly, providing regular ROA updates.
Yes and no. ROA includes assets financed by both debt and equity, so it reflects the total asset base regardless of funding source. However, it doesn’t directly show the cost of debt. That’s why comparing ROA with ROE (which isolates equity returns) reveals the impact of leverage.
This is rare but can occur when liabilities exceed assets (negative equity). In such cases, ROA becomes less meaningful, and the focus should shift to solvency and survival rather than efficiency metrics.
Inflation can distort ROA:
Historical cost accounting means older assets are understated, inflating ROA
Revenue and expenses reflect current prices
Real ROA (inflation-adjusted) provides a more accurate picture
During high inflation periods, be extra cautious when interpreting ROA.
Conclusion: Putting ROA to Work
Return on Assets is more than just a financial ratio—it’s a window into how effectively a company transforms resources into profits. Whether you’re evaluating stock market investments, running a business, or simply trying to understand financial statements, ROA provides invaluable insights into operational efficiency and management quality.
Key Takeaways to Remember:
✅ ROA measures profitability per dollar of assets using the simple formula: (Net Income / Total Assets) × 100
✅ “Good” ROA varies by industry—always compare within sectors, not across them
✅ ROA trends matter more than single-year snapshots—look for consistent or improving performance
✅ Combine ROA with other metrics like ROE, profit margins, and debt ratios for a complete analysis
✅ Companies can improve ROA by increasing margins, optimizing asset utilization, or reducing underperforming assets
Your Next Steps
If you’re an investor:
- Screen your watchlist or portfolio by ROA
- Identify companies with above-average ROA in their sectors
- Analyze ROA trends over 5+ years
- Investigate what drives superior ROA performance
- Verify that high ROA companies aren’t overvalued
If you’re a business owner:
- Calculate your current ROA
- Benchmark against industry competitors
- Identify your lowest-performing assets
- Develop a plan to improve margins or asset turnover
- Set ROA targets and track progress quarterly
If you’re building wealth:
- Apply ROA thinking to your personal finances
- Calculate returns on your investment capital
- Eliminate “assets” that aren’t generating adequate returns
- Focus on high-return opportunities aligned with your goals
- Review and rebalance regularly
Remember, financial success isn’t about having the most assets—it’s about getting the best returns from the assets you have. That’s the essence of Return on Assets, and that’s the path to sustainable wealth building.
Ready to dive deeper into financial metrics and investment strategies? Explore more beginner guides and resources to continue your financial education journey!
Disclaimer
The information provided in this article is for educational purposes only and should not be considered financial, investment, or professional advice. Return on Assets is one of many metrics used to evaluate companies and should not be the sole basis for investment decisions. Always conduct thorough research, consider your individual financial situation, and consult with qualified financial professionals before making investment decisions. Past performance does not guarantee future results, and all investments carry risk, including the potential loss of principal.
About the Author
Max Fonji is a financial educator and investment strategist with over 15 years of experience helping individuals understand complex financial concepts. Through TheRichGuyMath.com, Max breaks down investing, personal finance, and wealth-building strategies into actionable, easy-to-understand guidance. His mission is to democratize financial literacy and empower readers to make informed decisions about their money. When not writing about finance, Max enjoys analyzing market trends, mentoring young investors, and exploring the intersection of technology and investing
Related posts:
 What Is SmartPass? Raptor Digital Hall Pass Explained for K-12 Schools
 What Is the 3x Rent Rule & How to Calculate It (With Examples)
 Portfolio Income: Definition, Examples, Tax Rules, and Strategies
 Bookkeeping vs Accounting: What’s the Difference & Which Do You Need?
 What Is Profitability Analysis & How to Do It: Metrics, Example & Tips
 How to Save Money Fast: A Smart Savings Plan That Actually Works