Imagine you’re deciding between two lemonade stands to invest in. Stand A made $100 profit using $500 worth of equipment and supplies. Stand B made the same $100 profit but needed $1,000 worth of resources. Which one used its money more wisely?
That’s exactly what Return on Capital Employed (ROCE) helps investors figure out, but for real companies worth millions or billions of dollars. It’s one of the most powerful metrics for understanding how efficiently a business turns its capital into profits.
In simple terms, Return on Capital Employed means how much profit a company generates for every dollar of capital it uses.
Whether you’re just starting your investing journey or looking to sharpen your analysis skills, understanding ROCE can transform how you evaluate potential investments. This metric reveals which companies are capital-efficient machines and which ones are burning through resources without impressive returns.
TL;DR Summary
Return on Capital Employed (ROCE) measures how efficiently a company generates profit from its total capital (both equity and debt).
The formula for ROCE is: ROCE = EBIT ÷ Capital Employed × 100, where Capital Employed = Total Assets – Current Liabilities.
A higher ROCE usually indicates better capital efficiency and stronger competitive advantages—generally, anything above 15-20% is considered good.
Investors use ROCE to measure which companies deliver the best returns on the money they’ve invested in operations, making it ideal for comparing businesses within the same industry.
ROCE works best when tracked over time and compared against industry peers, helping identify companies with sustainable competitive moats.
What is Return on Capital Employed (ROCE)?
Return on Capital Employed is a profitability ratio that measures how effectively a company uses its capital to generate profits. Unlike simpler metrics that only look at equity, ROCE considers all the capital a business employs, both the money from shareholders and the money borrowed from lenders.
Think of it this way: if you and your friend pooled $10,000 together to start a business (equity) and borrowed another $5,000 from the bank (debt), you’re working with $15,000 in total capital. ROCE tells you how well you’re using that entire $15,000 to create profits.
The formula for Return on Capital Employed
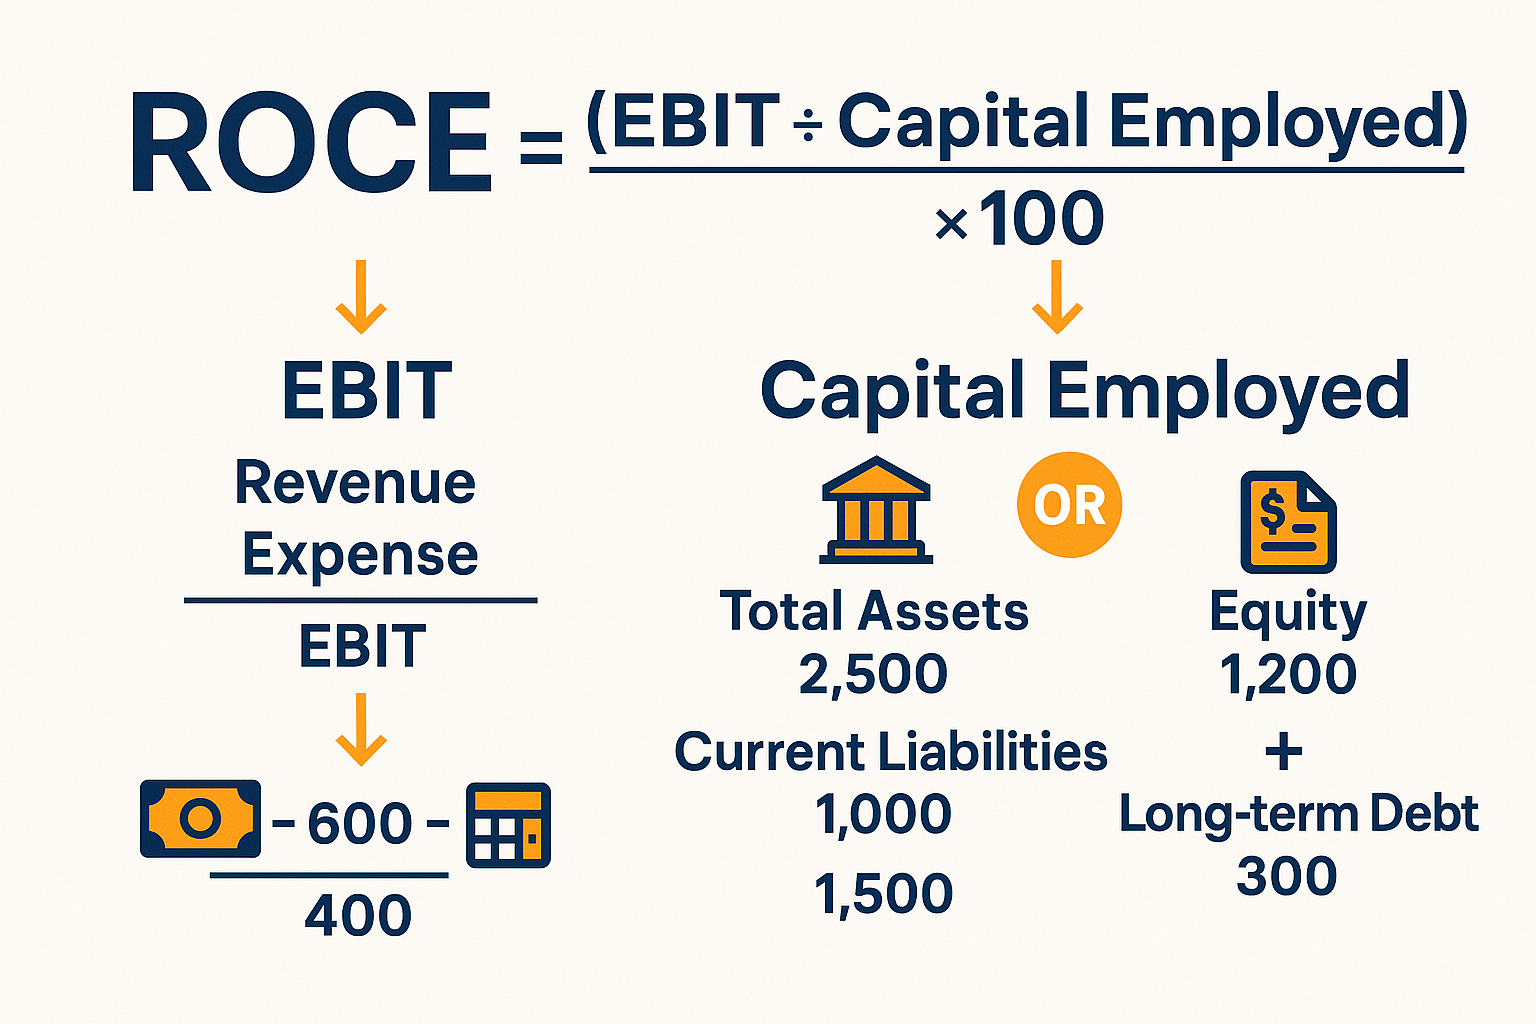
ROCE = (EBIT ÷ Capital Employed) × 100
Where:
- EBIT = Earnings Before Interest and Taxes
- Capital Employed = Total Assets – Current Liabilities
Alternatively, Capital Employed can be calculated as:
- Capital Employed = Shareholders’ Equity + Long-term Debt
Both formulas arrive at the same number—they’re just different paths to the same destination.
Why ROCE Matters for Investors
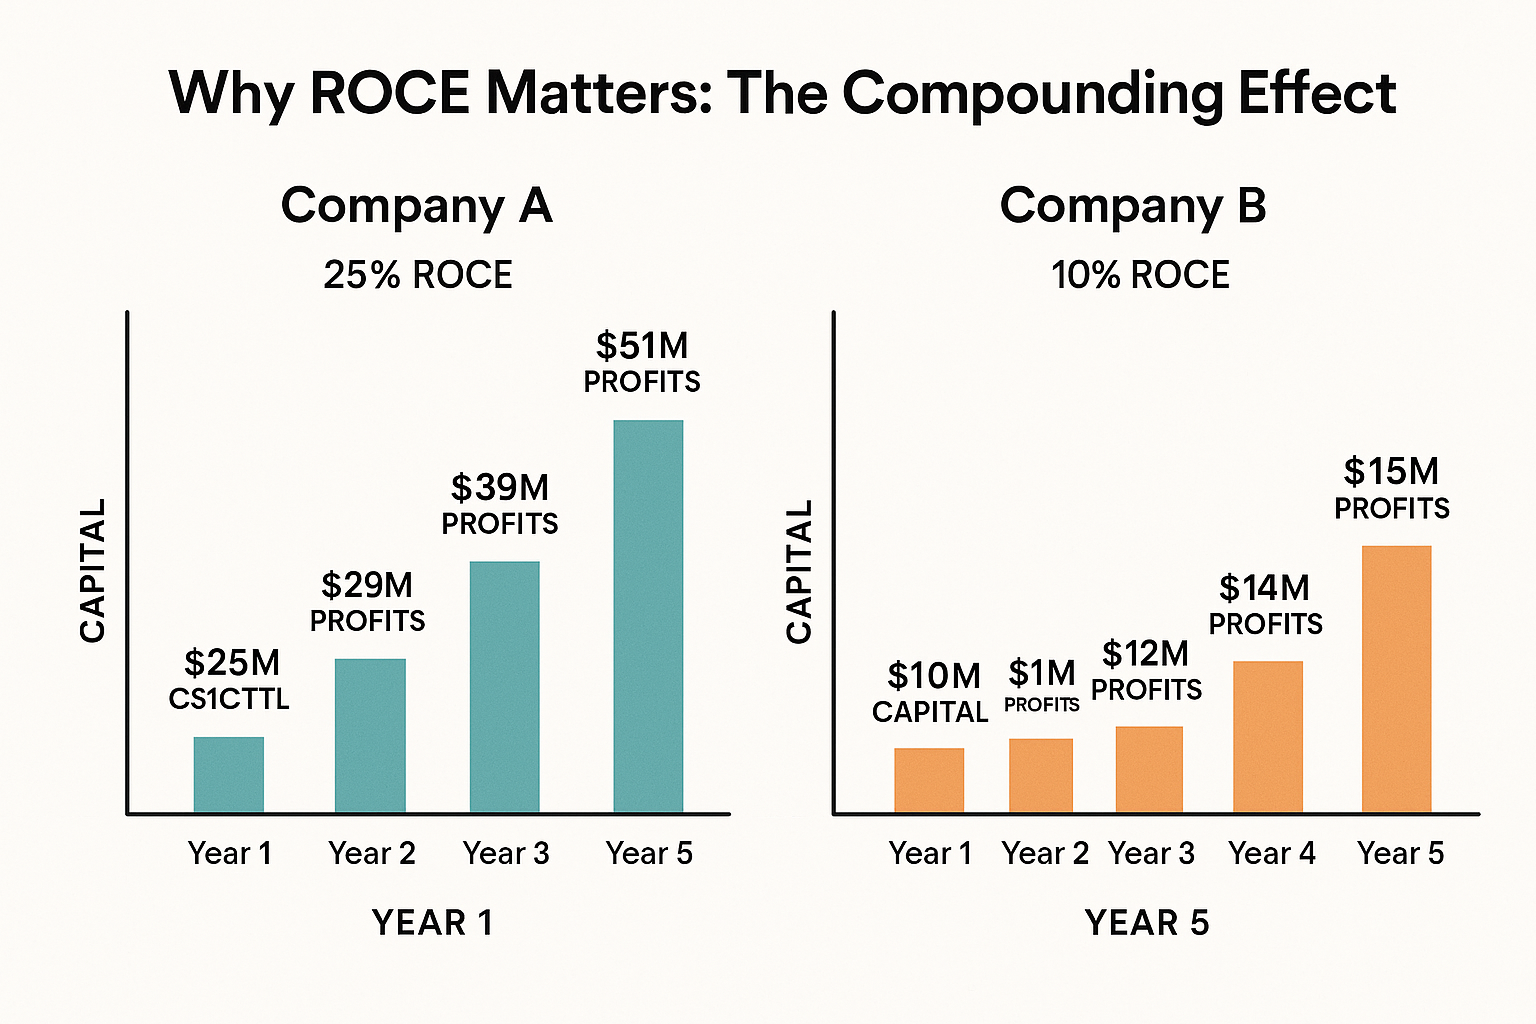
ROCE is particularly valuable because it:
Reveals capital efficiency – Shows which companies squeeze the most profit from their resources
Levels the playing field – Allows fair comparison between companies with different capital structures
Highlights competitive advantages – Companies with consistently high ROCE often have strong moats
Predicts future performance – Businesses that efficiently deploy capital tend to compound wealth better over time
Warren Buffett himself has emphasized the importance of return on capital metrics, often seeking businesses that can deploy capital at high rates of return year after year. As he’s noted, “It’s far better to buy a wonderful company at a fair price than a fair company at a wonderful price”—and ROCE helps identify those wonderful companies. Corporate Finance Institute (CFI) – “Return on Capital Employed (ROCE)
How to Calculate Return on Capital Employed
Let’s break down the calculation step-by-step with a real example.
Step 1: Find EBIT (Earnings Before Interest and Taxes)
EBIT represents the company’s operating profit before accounting for interest payments and taxes. You can find this on the income statement, or calculate it as:
EBIT = Revenue – Operating Expenses
Or:
EBIT = Net Income + Interest + Taxes
Step 2: Calculate Capital Employed
Capital Employed represents all the long-term funds used in the business. You can calculate it two ways:
Method 1: Capital Employed = Total Assets – Current Liabilities
Method 2: Capital Employed = Shareholders’ Equity + Long-term Debt
Both methods should give you the same result.
Step 3: Apply the ROCE Formula
Once you have both numbers:
ROCE = (EBIT ÷ Capital Employed) × 100
The result is expressed as a percentage.
Real-World Example: Calculating ROCE
Let’s calculate ROCE for a fictional company, TechGrowth Inc.:
From the Income Statement:
- Revenue: $500 million
- Operating Expenses: $350 million
- EBIT: $150 million
From the Balance Sheet:
- Total Assets: $800 million
- Current Liabilities: $200 million
- Shareholders’ Equity: $400 million
- Long-term Debt: $200 million
Calculating Capital Employed:
Method 1: $800M (Total Assets) – $200M (Current Liabilities) = $600M
Method 2: $400M (Equity) + $200M (Long-term Debt) = $600M ✓
Calculating ROCE:
ROCE = ($150M ÷ $600M) × 100 = 25%
This means TechGrowth Inc. generates $0.25 in operating profit for every dollar of capital employed. That’s a solid return!
📊 ROCE Calculator
Calculate Return on Capital Employed in seconds
What is a Good ROCE?
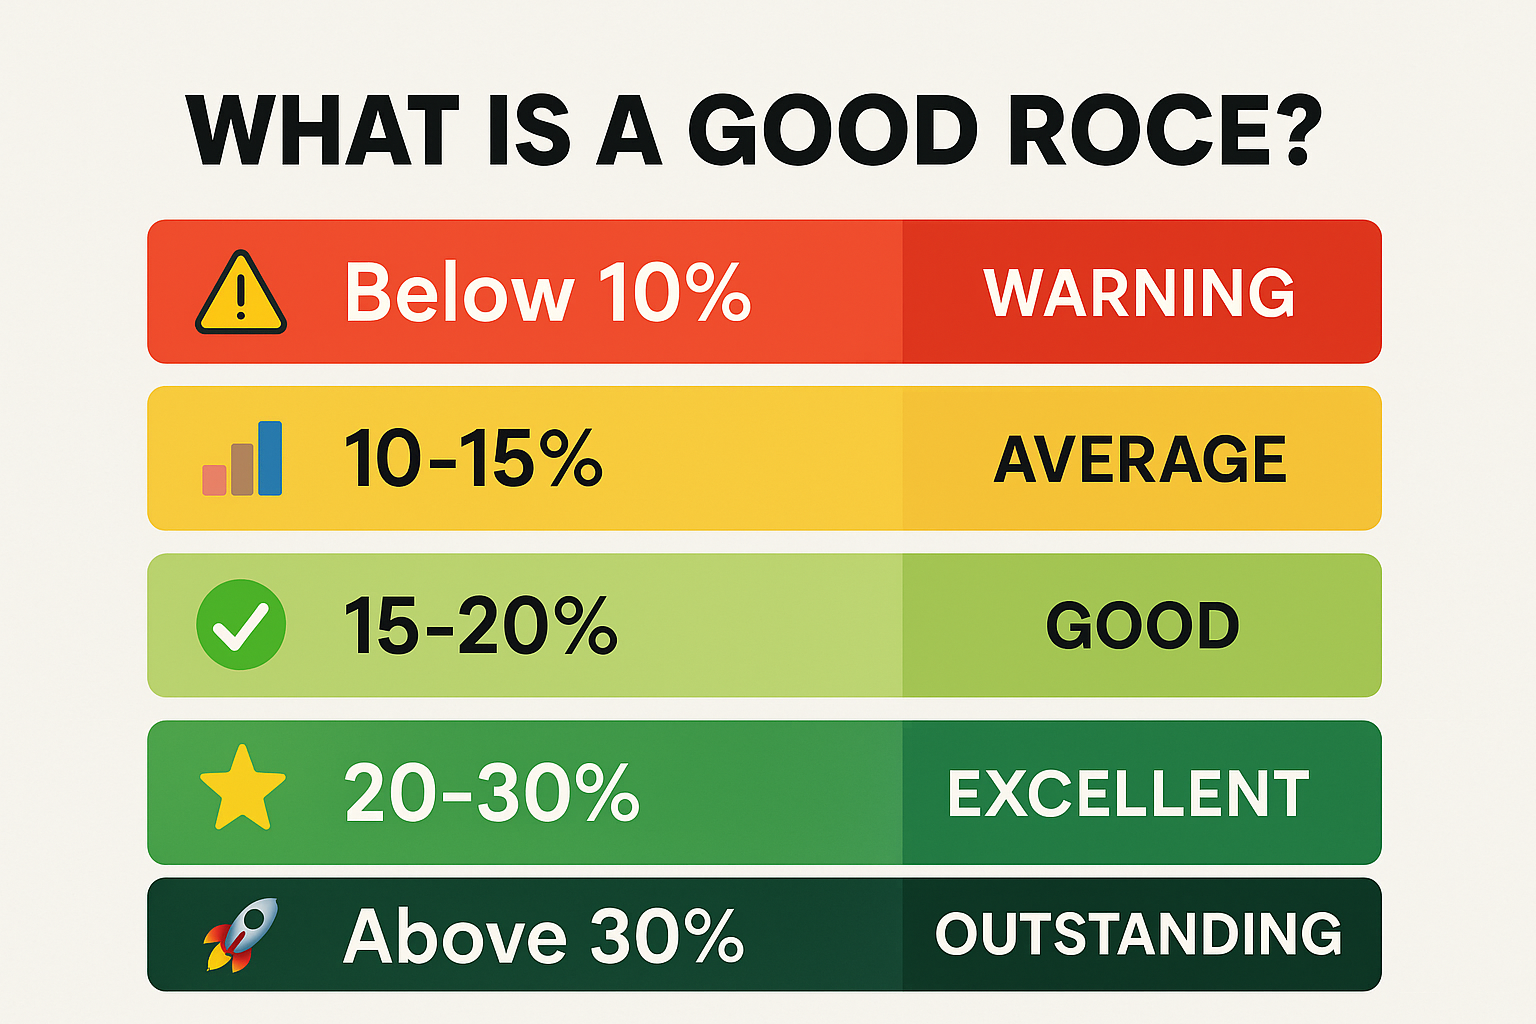
Now that you know how to calculate ROCE, the million-dollar question is: what’s considered a good Return on Capital Employed?
The answer isn’t one-size-fits-all, but here are some general benchmarks:
| ROCE Range | Interpretation | What It Means |
|---|---|---|
| Below 10% | Poor | Company struggles to generate adequate returns; capital may be better deployed elsewhere |
| 10-15% | Average | The company struggles to generate adequate returns; capital may be better deployed elsewhere |
| 15-20% | Good | Acceptable but unremarkable; the company meets basic profitability expectations |
| 20-30% | Excellent | Solid capital efficiency; the company likely has some competitive advantages |
| Above 30% | Strong performance; the company demonstrates superior capital allocation | Exceptional returns often indicate powerful competitive moats |
IG Glossary – “Return on capital employed | ROCE definition
Industry Matters
Context is everything. A ROCE of 12% might be excellent for a capital-intensive grocery chain but disappointing for a software company.
Capital-intensive industries (manufacturing, utilities, telecommunications) typically have lower ROCE because they require massive upfront investments in equipment and infrastructure. A ROCE of 12-15% might be quite respectable here.
Asset-light industries (software, consulting, media) generally post higher ROCE figures because they don’t need expensive machinery or inventory. Here, investors might expect an ROCE of 25% or higher.
The Trend is Your Friend
A single ROCE snapshot is useful, but tracking the trend over 5-10 years is even more revealing. Ask yourself:
Is ROCE improving? This suggests the company is getting better at deploying capital—a very positive sign.
Is ROCE stable and high? Consistency at high levels indicates sustainable competitive advantages.
Is ROCE declining? This could signal increasing competition, poor capital allocation, or deteriorating business fundamentals.
Companies that can maintain ROCE above 15-20% for a decade or more are rare gems. They’re the compounders that build long-term wealth for patient investors.
ROCE vs Other Profitability Metrics
ROCE doesn’t exist in isolation. Smart investors use it alongside other metrics to build a complete picture. Let’s compare ROCE with its cousins:
ROCE vs ROE (Return on Equity)
Return on Equity (ROE) only considers shareholders’ equity:
ROE = Net Income ÷ Shareholders’ Equity × 100
Key Difference: ROE ignores debt, while ROCE includes all capital (equity + debt).
When to use each:
- Use ROE when you want to know how well the company rewards shareholders, specifically
- Use ROCE when you want to understand overall capital efficiency, regardless of how it’s financed
Example: A company might have high ROE simply because it’s heavily leveraged (lots of debt), but its ROCE might reveal that the business itself isn’t particularly efficient.
ROCE vs ROA (Return on Assets)
Return on Assets (ROA) measures profit relative to total assets:
ROA = Net Income ÷ Total Assets × 100
Key Difference: ROA uses net income (after interest and taxes), while ROCE uses EBIT (before interest and taxes).
When to use each:
- Use ROA for asset-heavy businesses where efficient asset utilization is critical
- Use ROCE when you want to compare companies with different tax situations or capital structures
ROCE vs ROIC (Return on Invested Capital)
Return on Invested Capital (ROIC) is ROCE’s closest cousin:
ROIC = NOPAT ÷ Invested Capital × 100
Where NOPAT = Net Operating Profit After Taxes
Key Difference: ROIC accounts for taxes while ROCE doesn’t; ROIC is often considered slightly more precise.
When to use each:
- Use ROIC for more precise analysis when comparing companies across different tax jurisdictions
- Use ROCE for quicker analysis, and when comparing companies in the same tax environment
The bottom line? ROCE is particularly useful for comparing companies within the same industry while factoring in their entire capital structure.
Advantages of Using ROCE
Why do professional investors and analysts love ROCE? Here are the compelling benefits:
Comprehensive Capital View
Unlike ROE, which only looks at equity, ROCE considers all the capital a business uses—both borrowed and owned. This gives you the full picture of how efficiently the company operates.
Levels the Playing Field
ROCE allows fair comparison between companies with different capital structures. Whether a company is debt-heavy or equity-heavy, ROCE shows how well it’s using its total resources.
Highlights Quality Businesses
Companies that consistently maintain high ROCE (20%+) over many years often possess durable competitive advantages, which Warren Buffett calls “economic moats.” These might include:
- Strong brand power
- Network effects
- Cost advantages
- Switching costs
- Regulatory protection
Predicts Future Returns
Academic research has shown that companies with high ROCE tend to deliver better stock market returns over the long term. Why? Because they can reinvest their profits at high rates, creating a compounding effect.
Easy to Calculate
You don’t need advanced financial modeling skills. With basic information from financial statements, anyone can calculate ROCE in minutes using our calculator above!
Industry-Agnostic Comparisons
While you should always compare companies within the same industry, ROCE’s standardized percentage format makes cross-industry analysis possible when needed.
Limitations and Common Mistakes
Despite its usefulness, ROCE isn’t perfect. Here are the limitations every investor should understand:
Doesn’t Account for Growth Opportunities
A company might have low ROCE today because it’s investing heavily in future growth. Think of Amazon in its early years—it sacrificed current returns for massive future potential.
The Fix: Always consider ROCE alongside the company’s growth stage and strategy.
Can Be Manipulated
Companies can temporarily boost ROCE through:
- Reducing capital employed (selling assets)
- Cutting necessary investments
- Aggressive accounting practices
The Fix: Track ROCE over multiple years and read the footnotes in financial statements.
Ignores Risk
Two companies might have the same ROCE, but one might be taking on significantly more risk to achieve it.
The Fix: Combine ROCE analysis with risk metrics like debt-to-equity ratios and interest coverage.
Historical, Not Predictive
ROCE tells you what happened in the past, not what will happen in the future.
The Fix: Use ROCE as one input in a broader analysis that includes competitive positioning, industry trends, and management quality.
Industry Differences
As mentioned earlier, capital-intensive industries naturally have lower ROCE. Comparing a steel manufacturer’s ROCE to a software company’s ROCE is like comparing apples to oranges.
The Fix: Always benchmark against industry peers, not the entire market.
Common Mistakes to Avoid
1: Focusing on a single year’s ROCE instead of the trend
2: Ignoring why ROCE is high or low (is it sustainable?)
3: Not adjusting for one-time events or accounting changes
4: Comparing companies across vastly different industries
5: Using ROCE in isolation without other financial metrics
How to Interpret and Use ROCE in Investment Decisions
Now for the practical part—how do you actually use ROCE to make smarter investment choices?
Step 1: Calculate ROCE for Your Target Company
Use the calculator above or the formula to determine the company’s current ROCE. Make sure you’re using the most recent annual financial data.
Step 2: Compare Against Industry Peers
Pull up 3-5 direct competitors and calculate their ROCE. This creates your benchmark. Ask:
- Is your target company above or below the industry average?
- Who has the highest ROCE, and why?
- Are there outliers that skew the average?
Step 3: Analyze the Historical Trend
Go back 5-10 years and plot ROCE over time. Look for:
Consistent improvement – Suggests improving efficiency and competitive position
Stable high performance – Indicates sustainable competitive advantages
Declining trend – Red flag requiring deeper investigation
Volatile pattern – May indicate cyclical business or inconsistent management
Step 4: Investigate the “Why”
Don’t just accept the number—understand what’s driving it:
- High ROCE: Does the company have pricing power? Operational excellence? Low capital needs?
- Low ROCE: Is the company over-invested in assets? Facing pricing pressure? In a capital-intensive industry?
Step 5: Consider the Reinvestment Opportunity
Here’s where ROCE becomes truly powerful for long-term investors:
High ROCE + High Reinvestment Rate = Compounding Machine
If a company can reinvest most of its earnings at 25% ROCE, it will grow much faster than a company that can only reinvest at 10% ROCE.
Example: Company A earns $100M and reinvests $80M at 25% ROCE = $20M in new profits next year
Company B earns $100M and reinvests $80M at 10% ROCE = $8M in new profits next year
Over a decade, this difference compounds dramatically!
Step 6: Combine with Other Metrics
Build a complete picture by adding:
- Revenue growth – Is the company growing its top line?
- Profit margins – Are margins expanding or contracting?
- Free cash flow – Is the company converting profits to cash?
- Debt levels – Is leverage reasonable?
- Valuation – Is the stock price attractive relative to quality?
Real-World Decision Framework
Here’s a simple framework for using ROCE in investment decisions:
Green Light (Strong Buy Signal):
- ROCE consistently above 20%
- Improving or stable trend over 5+ years
- Significantly higher than the industry average
- Company reinvesting at high rates
- Reasonable valuation
Yellow Light (Proceed with Caution):
- ROCE between 10-20%
- Inconsistent trend
- Near industry average
- Limited reinvestment opportunities
- Unclear competitive advantages
Red Light (Avoid or Investigate Further):
- ROCE below 10%
- Declining trend
- Below industry average
- High debt levels
- Value trap potential
ROCE in Different Industries: Real Data Examples
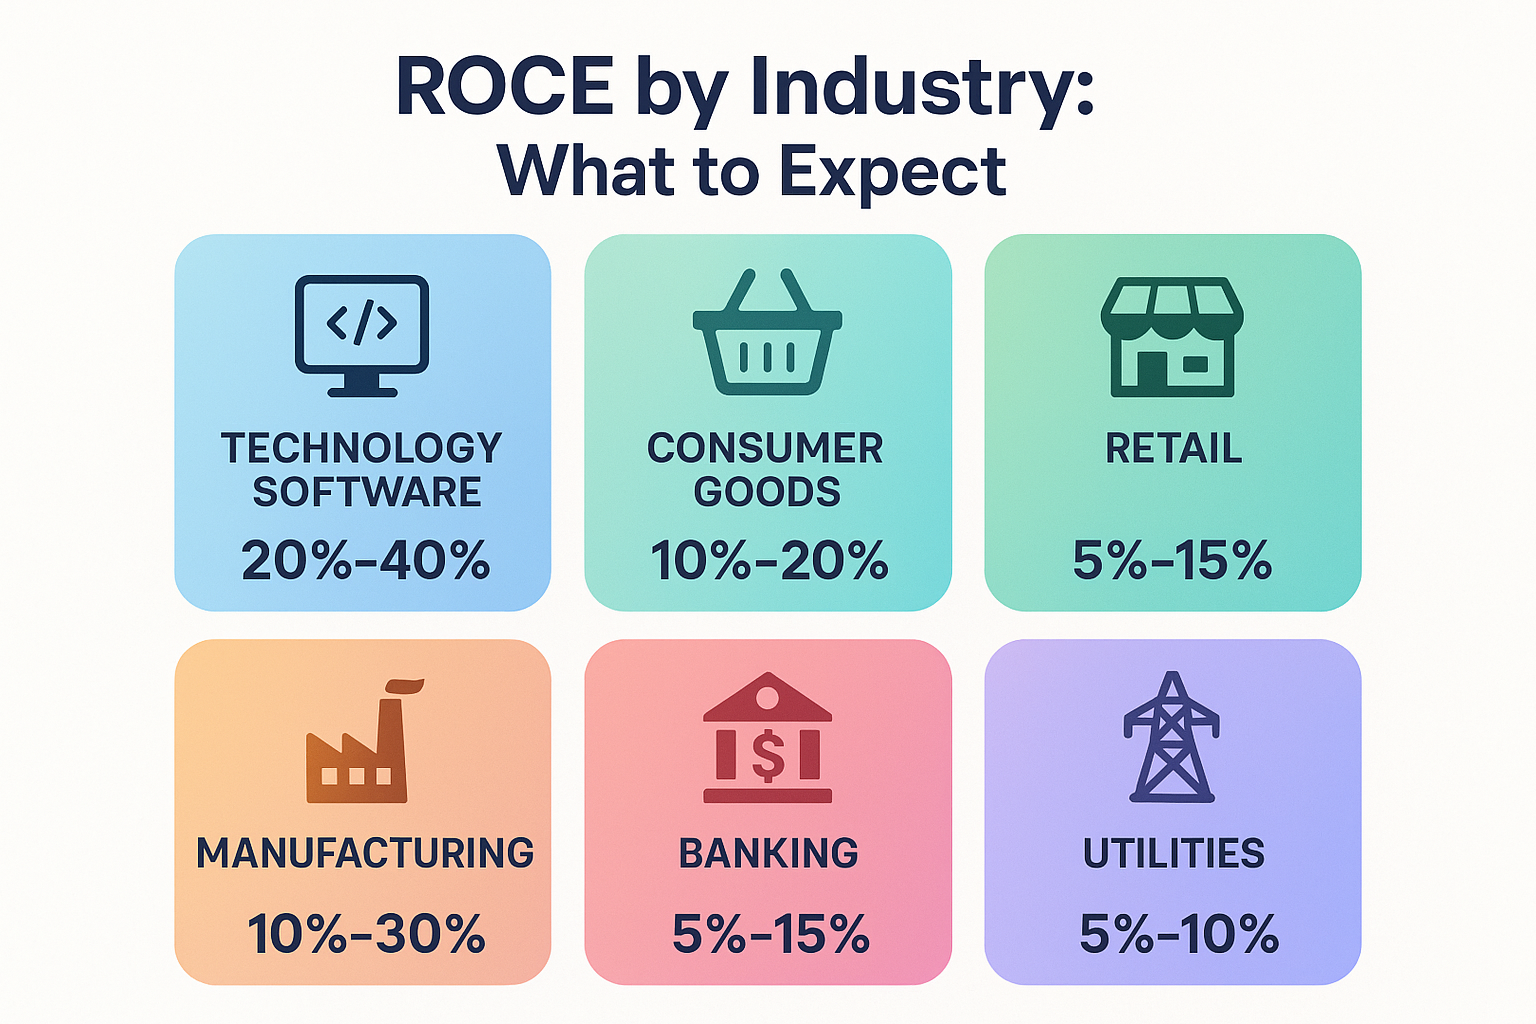
Let’s look at how ROCE varies across different sectors with real-world context (note: these are illustrative examples based on typical industry characteristics):
Technology & Software
Typical ROCE Range: 20-40%+
Why It’s High: Minimal physical assets, high gross margins, scalable business models
Example Profile:
- EBIT: $30 billion
- Capital Employed: $100 billion
- ROCE: 30%
Software companies often post exceptional ROCE because once the product is built, the marginal cost of serving additional customers is near zero. This is why understanding technology stocks can be so valuable for long-term investors.
Consumer Goods (Asset-Light Brands)
Typical ROCE Range: 15-30%
Why It’s Moderate-High: Strong brands command pricing power, but require marketing investment
Example Profile:
- EBIT: $8 billion
- Capital Employed: $40 billion
- ROCE: 20%
Companies with powerful consumer brands can maintain high ROCE through pricing power and brand loyalty.
Retail & Grocery
Typical ROCE Range: 8-15%
Why It’s Lower: Thin margins, high competition, significant working capital needs
Example Profile:
- EBIT: $5 billion
- Capital Employed: $50 billion
- ROCE: 10%
Retail is a tough business with low margins and intense competition, naturally resulting in lower ROCE.
Manufacturing & Industrials
Typical ROCE Range: 8-18%
Why It’s Variable: Heavy machinery investment, cyclical demand, and economies of scale matter
Example Profile:
- EBIT: $12 billion
- Capital Employed: $100 billion
- ROCE: 12%
Capital-intensive manufacturing requires massive upfront investment, which naturally depresses ROCE.
Banking & Financial Services
Typical ROCE Range: 10-15%
Why It’s Moderate: Regulatory capital requirements, leverage limitations
Example Profile:
- EBIT: $25 billion
- Capital Employed: $200 billion
- ROCE: 12.5%
Banks operate under strict capital requirements, which limit how much they can earn on their capital base.
Utilities & Infrastructure
Typical ROCE Range: 6-12%
Why It’s Low: Massive infrastructure investment, regulated returns
Example Profile:
- EBIT: $4 billion
- Capital Employed: $50 billion
- ROCE: 8%
Utilities require enormous capital for power plants and distribution networks, and their returns are often regulated, resulting in lower but stable ROCE. Investopedia – Return on Capital Employed (ROCE): Ratio, Interpretation
The Connection Between ROCE and Stock Market Performance
Here’s something that might surprise you: companies with high, sustainable ROCE tend to outperform the stock market over the long term.
Why does this happen?
The Compounding Effect
When a company can consistently reinvest capital at high rates of return, it creates a powerful compounding effect. Over time, this translates directly into shareholder value.
Think about it: if a company grows its capital base by 15% annually and maintains a 25% ROCE, it’s adding significant new profits every single year. This growth eventually shows up in the stock price.
Quality Premium
The market eventually recognizes and rewards quality businesses. While these companies might not always be the cheapest on traditional valuation metrics, their superior ROCE often justifies premium valuations.
Investors are willing to pay more for businesses that efficiently compound capital year after year.
Avoiding Value Traps
Low ROCE can be a warning sign of a “value trap”—a stock that looks cheap but deserves to be cheap because the underlying business is poor.
A company trading at a low price-to-earnings ratio might seem attractive, but if its ROCE is 5%, it’s probably cheap for good reason. Understanding these dynamics can help you avoid common mistakes in the stock market.
The Emotional Cycle
During market downturns, high-ROCE companies often recover faster because their strong fundamentals become apparent once the panic subsides. Their ability to generate cash and maintain profitability through difficult times makes them resilient investments.
How to Find ROCE Data
You don’t need a Bloomberg terminal to analyze ROCE. Here’s where to find the information you need:
Company Financial Statements
Annual Reports (10-K): Available free on company investor relations websites or SEC.gov
- Income Statement: Find EBIT
- Balance Sheet: Find Total Assets, Current Liabilities, Shareholders’ Equity, and Long-term Debt
Financial Websites
Several free resources calculate ROCE for you:
Morningstar – Provides ROCE and ROIC data for thousands of companies
Gurufocus – Offers detailed capital efficiency metrics
Simply Wall St – Visual presentations of ROCE trends
Yahoo Finance – Basic financial data to calculate yourself
Professional Databases
For serious investors:
- S&P Capital IQ
- FactSet
- Bloomberg Terminal
These are expensive but offer comprehensive historical data and peer comparisons.
Calculate It Yourself
Honestly, calculating ROCE yourself is the best approach. It forces you to understand the company’s financial statements and ensures you’re using a consistent methodology across companies.
Plus, you can adjust for one-time items or accounting quirks that automated calculations might miss.
ROCE and Dividend Investing
If you’re interested in building passive income through dividends, ROCE is an essential metric.
Why ROCE Matters for Dividend Investors
Sustainable Dividends Require Capital Efficiency
Companies with high ROCE can afford to pay dividends while still reinvesting enough to grow the business. Low-ROCE companies often face a painful choice: pay dividends OR invest in growth.
Dividend Growth Potential
The best dividend growth stocks combine:
- High ROCE (20%+)
- Moderate payout ratio (40-60%)
- Consistent cash generation
This combination allows them to increase dividends year after year while still funding growth.
Red Flags for Dividend Investors
High dividend yield + Low ROCE = Potential dividend cut ahead
Declining ROCE + Stable dividend = Unsustainable situation
Payout ratio > 80% + ROCE < 12% = Limited room for error
Finding Quality Dividend Stocks
Look for companies with:
- ROCE consistently above 15%
- 10+ year dividend growth track record
- Payout ratio under 70%
- Strong competitive position
These high-quality dividend stocks can provide both income and capital appreciation over time.
Teaching ROCE to the Next Generation
If you’re thinking about building wealth for your children, teaching them about metrics like ROCE is invaluable.
Making It Relatable for Kids
The Lemonade Stand Example:
“Imagine you spent $50 on a lemonade stand, cups, lemons, and sugar. If you made $15 profit this summer, your return on capital is 30% ($15 ÷ $50). Pretty good!
Now imagine your friend spent $100 on a fancier stand but only made $10 profit. Their return is just 10% ($10 ÷ $100). Your simpler stand was more efficient!”
Key Lessons for Young Investors
Efficiency matters more than size – A small business with great returns can be better than a big business with poor returns
Not all growth is good – Growing by investing capital at low returns destroys value
Quality compounds – Businesses that earn high returns on capital can grow wealth faster over time
Compare apples to apples – Always look at similar businesses when judging performance
Advanced ROCE Strategies
For investors ready to go deeper, here are some advanced applications:
Adjusted ROCE
Consider adjusting ROCE for:
Excess Cash: Subtract cash beyond operational needs from capital employed
- Why? Cash sitting idle earns minimal returns and distorts ROCE
Intangible Assets: Add back goodwill and intangibles if analyzing asset-light businesses
- Why? Provides better operational insight
Leases: Capitalize operating leases to reflect true capital employed
- Why? Modern accounting standards (IFRS 16, ASC 842) require this, but older data might not
Incremental ROCE
Instead of looking at total ROCE, analyze the return on new capital invested:
Incremental ROCE = Change in EBIT ÷ Change in Capital Employed
This shows whether the company is deploying new capital efficiently or experiencing diminishing returns.
ROCE Spread
Compare ROCE to the company’s Weighted Average Cost of Capital (WACC):
ROCE Spread = ROCE – WACC
A positive spread means the company creates value; a negative spread means it destroys value.
Screening Strategy
Build a stock screen based on ROCE:
- ROCE > 15%
- ROCE improving over 5 years
- ROCE > industry median
- Debt-to-equity < 1.0
- P/E ratio < 25
This identifies high-quality companies at reasonable valuations.
FAQ
A good ROCE is typically 15% or higher, though this varies by industry. Capital-intensive businesses like utilities might have “good” ROCE of 10-12%, while asset-light software companies should achieve 20-30% or more. The key is comparing against industry peers and looking for consistent performance over time.
The formula for ROCE is: (EBIT ÷ Capital Employed) × 100. EBIT is Earnings Before Interest and Taxes from the income statement. Capital Employed can be calculated as either (Total Assets – Current Liabilities) or (Shareholders’ Equity + Long-term Debt) from the balance sheet.
ROCE considers all capital employed (equity plus debt), while ROE only looks at shareholders’ equity. ROCE provides a more complete picture of capital efficiency regardless of how the company is financed, making it better for comparing companies with different capital structures.
While high ROCE is generally positive, extremely high figures (50%+) warrant investigation. They might indicate: (1) unsustainable competitive advantages, (2) accounting manipulation, (3) asset-light business models, or (4) recent asset sales. Always understand why ROCE is high before investing.
For long-term investors, checking ROCE annually when companies release their 10-K reports is sufficient. What matters more than frequent checking is tracking the trend over 5-10 years to identify patterns and consistency.
Neither is definitively “better”—they serve slightly different purposes. ROIC (Return on Invested Capital) accounts for taxes and is slightly more precise, while ROCE is simpler to calculate and widely used. For most investors, ROCE provides sufficient insight, especially when comparing companies in the same tax jurisdiction.
Declining ROCE can signal several things: (1) increased competition reducing margins, (2) heavy investment in growth that hasn’t yet paid off, (3) acquisition of lower-return businesses, (4) industry maturation, or (5) deteriorating competitive position. Investigate the cause before making investment decisions.
Conclusion: Putting ROCE to Work
Return on Capital Employed is more than just another financial ratio; it’s a window into the soul of a business. It reveals which companies use their resources wisely and which ones squander capital chasing unprofitable growth.
The key takeaways to remember:
ROCE measures capital efficiency – It shows how much profit a company generates from all the capital it employs
Context is everything – Always compare ROCE against industry peers and historical trends, not absolute benchmarks
High ROCE signals quality – Companies that consistently maintain ROCE above 15-20% often possess durable competitive advantages
Trends matter more than snapshots – A 5-10 year track record of stable or improving ROCE is more valuable than a single year’s figure
Combine with other metrics – ROCE is powerful but works best alongside growth rates, cash flow analysis, and valuation metrics
Your Action Plan
Ready to put ROCE to work in your investment process? Here’s what to do next:
Step 1: Use the calculator above to analyze 3-5 companies you’re interested in
Step 2: Compare their ROCE against industry averages and each other
Step 3: Pull 5-10 years of data and plot the ROCE trend
Step 4: Investigate what drives the differences—competitive advantages, capital intensity, management quality
Step 5: Combine ROCE insights with your broader investment analysis
Step 6: Make more informed investment decisions based on capital efficiency
Remember, investing is a journey of continuous learning. The more you practice analyzing metrics like ROCE, the better you’ll become at identifying quality businesses that can compound wealth over decades.
Whether you’re building a passive income portfolio, analyzing dividend stocks, or simply trying to make smarter investment choices, ROCE is a tool that belongs in every investor’s toolkit.
Start small, stay curious, and let capital efficiency guide you toward better investments. Your future self will thank you!
Disclaimer
This article is for educational purposes only and does not constitute financial advice. The information provided is based on general principles and should not be considered personalized investment recommendations. Return on Capital Employed is one of many metrics used in investment analysis, and no single metric should be the sole basis for investment decisions.
Past performance does not guarantee future results. All investments carry risk, including the potential loss of principal. Before making any investment decisions, consider your personal financial situation, risk tolerance, and investment objectives. Consult with a qualified financial advisor or conduct thorough research before investing.
The examples and calculations provided are for illustrative purposes only and may not reflect actual company data. Industry benchmarks and ROCE ranges mentioned are approximations based on historical patterns and may vary significantly.
TheRichGuyMath.com and its authors are not responsible for any investment decisions made based on this content.
About the Author
Written by Max Fonji — With over a decade of experience in financial analysis and investment education, Max is your go-to source for clear, data-backed investing insights. Max specializes in breaking down complex financial concepts into actionable strategies that everyday investors can use to build wealth.
Through TheRichGuyMath.com, Max has helped thousands of readers understand the mathematics of wealth-building, from fundamental stock market concepts to advanced valuation techniques. His mission is simple: make sophisticated financial knowledge accessible to everyone, regardless of their background or experience level.
When Max isn’t analyzing financial statements or writing educational content, he enjoys teaching young people about money management and helping families build multi-generational wealth.

