
← Back to Budgeting and Saving
Every dollar you earn faces a critical decision: should it be saved or invested? This choice determines whether your money sits idle or compounds into wealth.
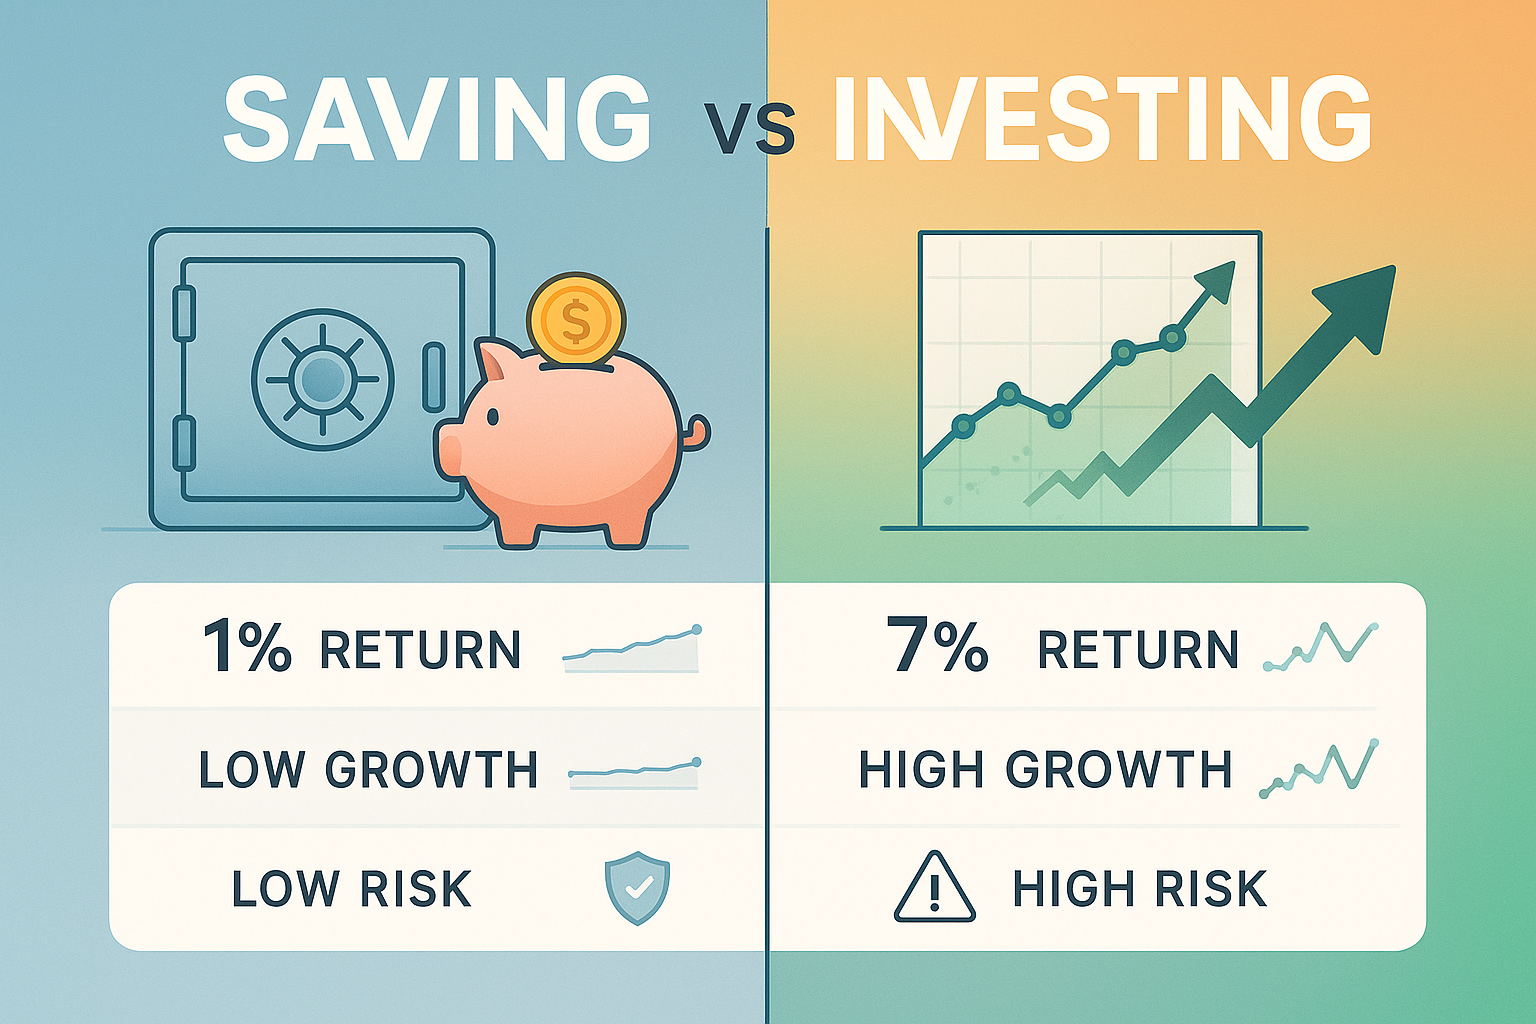
The difference between saving and investing isn’t just semantic; it’s mathematical. One preserves purchasing power through liquidity and safety. The other multiplies purchasing power through compound growth and calculated risk. Understanding Saving vs Investing creates the foundation for every financial decision you’ll make in 2026 and beyond.
This guide explains the math behind money, breaks down the fundamental differences between these two wealth-building strategies, and provides a data-driven framework to determine which approach fits your specific financial situation.
Key Takeaways
- Saving prioritizes capital preservation and liquidity with minimal risk, while investing targets wealth accumulation through compound growth with higher volatility.
- Time horizon is the primary mathematical variable: goals under 3 years favor savings accounts; goals beyond 5 years favor diversified investments.
- Emergency funds require 3-6 months of expenses in high-yield savings before any investment strategy begins—this is non-negotiable financial infrastructure.
- Historical data shows investing outperforms saving over 10+ year periods: the S&P 500 averaged 10.2% annual returns versus 0.5-5% for savings accounts.
- The optimal strategy combines both approaches: maintain liquid savings for short-term needs while investing systematically for long-term wealth building.
What Is Saving? The Foundation of Financial Security
Saving means setting aside money in secure, liquid accounts where the principal remains protected and immediately accessible. The primary objective is capital preservation, not growth.
The mechanics are straightforward: deposit funds into FDIC-insured accounts (savings accounts, money market accounts, certificates of deposit) where they earn modest interest while maintaining full liquidity and zero market risk.
Core Characteristics of Saving
Savings vehicles share four defining attributes that distinguish them from investment products:
Capital Preservation: The principal amount never decreases due to market fluctuations. If you deposit $10,000, you’ll always have at least $10,000 plus accumulated interest.
FDIC Insurance: Up to $250,000 per depositor, per institution is federally guaranteed. This eliminates counterparty risk and principal loss from bank failure.
High Liquidity: Funds can be accessed within 24-48 hours without penalties (except for CDs before maturity). This creates financial flexibility for emergencies and short-term needs.
Predictable Returns: Interest rates are disclosed upfront. A 4.5% APY delivers exactly that annual percentage yield with no volatility.
Where Saving Makes Mathematical Sense
Specific financial scenarios require the safety and accessibility that only savings provide:
Emergency Funds: The 50/30/20 rule budgeting framework allocates 20% to savings, with priority given to 3-6 months of essential expenses in liquid accounts. This buffer prevents forced asset liquidation during income disruptions.
Short-Term Goals (0-3 years): Down payments, wedding expenses, vehicle purchases, or planned major purchases require capital certainty. Market volatility over short periods introduces unacceptable risk of capital loss precisely when funds are needed.
Planned Large Expenses: If you need $15,000 in 18 months for a specific purpose, a high-yield savings account earning 4.5% APY provides $1,035 in interest with zero principal risk. The math is simple: $15,000 × 0.045 × 1.5 = $1,012.50.
The Limitation: Inflation Risk
While savings protect against market risk, they expose holders to purchasing power erosion. When inflation exceeds savings interest rates, real returns become negative.
Example calculation:
- Savings account APY: 4.5%
- Annual inflation rate: 3.2%
- Real return: 4.5% – 3.2% = 1.3%
That $10,000 maintains its nominal value but loses purchasing power relative to rising costs. Over 20 years at 3% inflation, that same $10,000 would need to grow to $18,061 just to maintain equivalent purchasing power.
This mathematical reality explains why savings work for short-term preservation but fail as long-term wealth-building tools.
What Is Investing? The Engine of Wealth Accumulation

Investing means allocating capital to assets that fluctuate in value with the expectation of generating returns that significantly exceed inflation over extended periods.
The fundamental mechanism: purchase ownership stakes (stocks, real estate) or debt instruments (bonds) that produce income (dividends, interest, rent) and/or appreciate, then compound those returns over time.
Core Characteristics of Investing
Investment vehicles operate under different principles than savings accounts:
Capital Appreciation Potential: Asset values increase over time. The S&P 500 index has delivered 10.2% average annual returns since 1957, turning $10,000 into $1,744,940 over 50 years through compound growth.
Volatility and Risk: Market prices fluctuate daily, monthly, and yearly. The S&P 500 has experienced 26 corrections (10%+ declines) and 9 bear markets (20%+ declines) since 1950. Short-term losses are statistically inevitable.
Lower Liquidity: While publicly traded securities can be sold quickly, optimal investing requires holding through market cycles. Real estate and private equity may require months or years to liquidate without significant discounts.
Compound Growth: Reinvested dividends and capital gains create exponential wealth accumulation. A dividend reinvestment strategy transforms linear growth into geometric expansion.
The Mathematics of Compound Growth
The difference between saving and investing becomes clear through compound interest formulas.
Savings account growth (simple or low-rate compounding):
- Initial deposit: $10,000
- Annual rate: 4.5%
- Time: 30 years
- Final value: $10,000 × (1.045)^30 = $36,729
Investment growth (historical stock market returns):
- Initial deposit: $10,000
- Annual return: 10%
- Time: 30 years
- Final value: $10,000 × (1.10)^30 = $174,494
The $137,765 difference illustrates why time horizon fundamentally determines the saving vs investing decision. The longer the timeline, the more compound growth dominates capital preservation.
For detailed compound interest mechanics, see our compound interest calculator guide.
Investment Vehicle Categories
Different asset classes serve different roles in wealth building:
Equities (Stocks): Ownership shares in companies. Highest historical returns (10%+ annually) with the highest volatility. Best for 10+ year horizons. Learn about selecting quality holdings in our best stocks to invest in 2025 guide.
Fixed Income (Bonds): Debt instruments paying regular interest. Lower returns (3-6% annually) with lower volatility. Useful for portfolio stabilization and shorter investment horizons.
Index Funds/ETFs: Diversified baskets tracking market indices. Combines broad exposure with low fees. Our best index funds analysis shows how passive strategies reduce risk while maintaining growth potential.
Real Estate: Physical property or REITs. Provides income through rent plus appreciation potential. Requires larger capital commitments. See the best REITs to invest in for accessible real estate exposure.
When Investing Makes Mathematical Sense
Specific financial contexts favor investment allocation:
Long-Term Goals (5+ years): Retirement accounts, children’s education funds, and generational wealth building. Time horizon allows recovery from market downturns while capturing compound growth.
After Emergency Fund Establishment: Only invest surplus capital beyond 3-6 months of expenses in liquid savings. This sequence prevents forced liquidation during market lows.
When Risk Tolerance Aligns: Investment requires accepting temporary paper losses. The cycle of market emotions explains why psychological preparation matters as much as financial capacity.
Tax-Advantaged Accounts: 401(k)s, IRAs, and HSAs provide immediate tax benefits that amplify investment returns. A 22% tax bracket investor saving $6,000 in a traditional IRA receives $1,320 in immediate tax reduction, effectively investing $6,000 while spending only $4,680.
Saving vs Investing: The Critical Differences Explained
Understanding the precise distinctions between these strategies enables optimal capital allocation decisions.
Time Horizon: The Primary Decision Variable
Mathematical principle: As the time horizon extends, the probability of positive investment returns approaches 100% while the opportunity cost of savings increases exponentially.
Historical data analysis:
- 1-year holding period: S&P 500 positive returns 74% of the time
- 5-year holding period: S&P 500 positive returns 88% of the time
- 10-year holding period: S&P 500 positive returns 94% of the time
- 20-year holding period: S&P 500 positive returns 100% of the time [4]
Decision framework:
- 0-2 years: 100% savings (high-yield savings account, money market)
- 2-5 years: 70% savings, 30% conservative investments (bond funds, balanced portfolios)
- 5-10 years: 40% savings, 60% moderate investments (60/40 stock/bond allocation)
- 10+ years: 10% savings, 90% growth investments (80-100% equity allocation)
This framework adjusts based on individual risk tolerance, but the time horizon remains the dominant variable.
Risk vs Return: The Fundamental Tradeoff
Every financial decision exists on a risk-return spectrum. Higher potential returns require accepting higher potential volatility.
Savings risk profile:
- Principal risk: Near zero (FDIC insured)
- Inflation risk: Moderate to high
- Opportunity cost risk: High over long periods
- Expected real return: 0-2% after inflation
Investment risk profile:
- Principal risk: Moderate to high (market volatility)
- Inflation risk: Low (assets typically outpace inflation)
- Opportunity cost risk: Low (maximizes long-term growth)
- Expected real return: 6-8% after inflation (diversified portfolio)
The mathematical expectation favors investing for long horizons because compound growth overwhelms short-term volatility. A portfolio that declines 20% in year one but averages 10% over 30 years still dramatically outperforms a 4% savings account.
Liquidity and Accessibility
Savings liquidity: Immediate to 24-hour access without penalties (except CDs). This flexibility provides financial security during emergencies, job loss, or unexpected expenses.
Investment liquidity: Technically accessible (most stocks/funds sell within seconds), but optimal use requires patience. Selling during market downturns locks in losses and eliminates recovery potential.
The liquidity paradox: Having liquid emergency savings enables patient investing. Without adequate savings, investors face forced liquidation during the worst possible times—market bottoms that coincide with personal financial stress.
This explains why the optimal strategy always begins with savings (emergency fund) before advancing to investments (wealth building).
Tax Implications
Tax treatment significantly impacts net returns.
Savings taxation:
- Interest income taxed as ordinary income at the marginal rate (10-37%)
- No preferential treatment
- Example: 4.5% APY in 24% tax bracket = 3.42% after-tax return
Investment taxation:
- Long-term capital gains (assets held 12+ months): 0%, 15%, or 20% based on income
- Qualified dividends: Same preferential rates as long-term gains
- Tax-deferred growth in retirement accounts
- Example: 10% return with 15% long-term capital gains rate = 8.5% after-tax return
Tax efficiency comparison:
A $10,000 investment growing at 10% annually for 30 years:
- Taxable account (24% ordinary income): $89,850 after annual taxes
- Tax-deferred account: $174,494 (taxes paid at withdrawal)
- Roth account: $174,494 (tax-free)
The tax advantage of investing in qualified accounts adds 1-2% to effective annual returns—a massive difference over decades.
Effort and Expertise Required
Savings management: Minimal effort. Compare interest rates annually, ensure FDIC coverage, and maintain minimum balances. Time investment: 1-2 hours per year.
Investment management: Requires ongoing education, portfolio rebalancing, tax-loss harvesting, and behavioral discipline. Time investment: 5-20 hours per year for DIY investors.
Solution for time-constrained investors: Robo-advisors automate portfolio construction, rebalancing, and tax optimization for 0.25-0.50% annual fees, far less than traditional financial advisors, while maintaining evidence-based strategies. See our full guide on Why is investing a more powerful tool to build long-term wealth than saving.
How to Choose Between Saving and Investing: A Data-Driven Framework
The optimal allocation between savings and investments follows a systematic decision process based on measurable financial variables.
Step 1: Establish Your Emergency Fund (Non-Negotiable)
Before any investment consideration, build 3-6 months of essential expenses in a high-yield savings account.
Calculation method:
- List monthly essential expenses (housing, utilities, food, insurance, minimum debt payments)
- Multiply by 3 (stable employment) or 6 (variable income, single-income household)
- Place this amount in an FDIC-insured savings account earning competitive rates
Example:
- Monthly essential expenses: $3,500
- Recommended emergency fund: $10,500 – $21,000
- Current high-yield savings rate: 4.5% APY
- Annual interest earned: $472 – $945
This foundation prevents the forced sale of investments during market downturns. It’s financial infrastructure, not an investment strategy.
Step 2: Define Your Time Horizon for Each Financial Goal
Different goals require different strategies based on when you’ll need the capital.
Goal categorization framework:
| Time Horizon | Goal Examples | Recommended Allocation |
|---|---|---|
| 0-1 year | Emergency fund, planned purchases | 100% high-yield savings |
| 1-3 years | House down payment, car purchase, wedding | 80% savings, 20% conservative bonds |
| 3-5 years | Starting a business, sabbatical fund | 50% savings, 50% balanced portfolio |
| 5-10 years | Children’s education, major home renovation | 30% savings, 70% moderate growth portfolio |
| 10-20 years | Early retirement, wealth building | 10% savings, 90% growth portfolio |
| 20+ years | Traditional retirement, generational wealth | 5% savings, 95% aggressive growth portfolio |
This framework assumes moderate risk tolerance. Conservative investors shift toward higher savings percentages; aggressive investors shift toward higher investment percentages.
Step 3: Assess Your Risk Tolerance
Risk tolerance combines financial capacity (ability to absorb losses) and psychological capacity (willingness to accept volatility).
Financial capacity questions:
- Can you maintain your lifestyle if your portfolio declines 30% for 2-3 years?
- Do you have stable income sources independent of investment performance?
- Are you free from high-interest debt that should be prioritized?
Psychological capacity questions:
- Would a 20% portfolio decline cause you to sell in panic?
- Can you ignore daily market fluctuations and maintain your strategy?
- Do you understand that volatility is the price paid for long-term returns?
Risk tolerance scoring:
- Conservative: Prioritize capital preservation, accept lower returns, favor 60-70% savings allocation
- Moderate: Balance growth and stability, accept temporary losses, favor 40-50% savings allocation
- Aggressive: Maximize long-term growth, tolerate significant volatility, favor 10-20% savings allocation
Honest self-assessment prevents costly behavioral mistakes. The best investment strategy is the one you can maintain through complete market cycles.
Step 4: Calculate Your Investment Capacity
Only invest money you won’t need for 5+ years, and that exceeds your emergency fund.
Investment capacity formula:
Investment Capacity = (Monthly Income - Monthly Expenses - Emergency Fund Contribution) × 12Example calculation:
- Monthly after-tax income: $6,000
- Monthly expenses: $4,200
- Emergency fund: Fully funded
- Monthly surplus: $1,800
- Annual investment capacity: $21,600
This surplus can be systematically invested through dollar-cost averaging, which reduces timing risk by spreading purchases across market conditions.
Step 5: Implement a Hybrid Strategy
The optimal approach combines both savings and investing in proportion to your specific circumstances.
The balanced approach for most individuals:
- Foundation (Savings): 3-6 months emergency fund in high-yield savings
- Short-term goals (Savings): Specific amounts for planned expenses within 3 years
- Long-term wealth (Investing): Systematic investment of surplus income in diversified portfolios
- Tax optimization: Maximize tax-advantaged accounts (401k, IRA, HSA) before taxable investing
Monthly cash flow allocation example:
- Income: $6,000
- Essential expenses: $3,500
- Discretionary spending: $1,000
- Emergency fund contribution (until complete): $500
- Retirement investing (401k): $750 (with employer match)
- Taxable investing: $250
This systematic approach builds both financial security (savings) and long-term wealth (investing) simultaneously.
Step 6: Rebalance Annually
Financial circumstances change. Review and adjust your saving vs investing allocation yearly.
Annual review checklist:
- ✓ Is the emergency fund still adequate for current expenses?
- ✓ Have time horizons for specific goals shortened (requiring a shift to savings)?
- ✓ Has income increased (enabling higher investment contributions)?
- ✓ Has risk tolerance changed due to life circumstances?
- ✓ Are investment allocations still aligned with target percentages?
This systematic review prevents strategy drift and maintains alignment between financial resources and life goals.
Common Mistakes to Avoid in the Saving vs Investing Decision
Understanding what not to do is as important as knowing optimal strategies.
Mistake #1: Investing Before Building Emergency Savings
The error: Allocating surplus income to investments while maintaining inadequate liquid reserves.
The consequence: Market downturns often correlate with economic recessions and job losses. Without emergency savings, investors face forced liquidation at market bottoms, the worst possible timing.
The math: A $10,000 investment that declines 30% to $7,000 during a downturn requires a 43% gain just to break even. If forced to sell at $7,000 for emergency expenses, that 30% loss becomes permanent.
The solution: Complete emergency fund first, invest second. No exceptions.
Mistake #2: Keeping Long-Term Money in Savings Accounts
The error: Maintaining retirement funds or 10+ year goals in savings accounts earning 4-5% annually.
The consequence: Massive opportunity cost from foregone compound growth.
The math:
- $500 monthly contribution for 30 years at 4.5% (savings): $372,712
- $500 monthly contribution for 30 years at 10% (investments): $1,130,244
- Opportunity cost: $757,532
The solution: Match asset location to time horizon. Long-term goals belong in growth-oriented investments.
Mistake #3: Panic Selling During Market Downturns
The error: Converting temporary paper losses into permanent realized losses by selling during market declines.
The consequence: Missing the recovery that historically follows every bear market.
The math: An investor who sold during the 2008 financial crisis at the market bottom (March 2009) and stayed in cash missed the subsequent 400%+ recovery through 2021.
The solution: Maintain adequate emergency savings so investment portfolios can remain untouched through full market cycles. Understand that volatility is the admission price for long-term returns.
Mistake #4: Ignoring Inflation in Savings Decisions
The error: Assuming nominal account growth represents real wealth accumulation.
The consequence: Purchasing power erosion over time, especially during high-inflation periods.
The math:
- $50,000 in savings at 4% APY for 20 years: $109,556 nominal value
- Inflation at 3% annually for 20 years: purchasing power equivalent to $60,892 in today’s dollars
- Real gain: Only $10,892 in purchasing power despite $59,556 nominal gain
The solution: Calculate real returns (nominal return – inflation rate) when evaluating savings strategies. For long-term goals, inflation risk often exceeds market risk.
Mistake #5: Attempting to Time the Market
The error: Waiting for “the right time” to invest or moving between savings and investments based on market predictions.
The consequence: Missing optimal entry points and underperforming simple buy-and-hold strategies.
The data: A study by Charles Schwab found that even perfect market timing (investing at the absolute market bottom each year) only marginally outperformed consistent monthly investing through dollar-cost averaging [6]. Meanwhile, investors who tried to time the market typically underperformed both strategies.
The solution: Implement systematic investment schedules regardless of market conditions. Time in the market beats timing the market.
Practical Examples: Saving vs Investing in Real Scenarios
Concrete examples illustrate how the framework applies to common financial situations.
Scenario 1: Recent Graduate Starting First Job
Profile:
- Age: 23
- Income: $55,000 annually
- Current savings: $2,000
- Debt: $25,000 student loans at 4.5% interest
- Goals: Build an emergency fund, start retirement savings, save for an apartment security deposit
Analysis:
- Emergency fund needed: $12,000 (6 months of $2,000 essential expenses)
- Current shortfall: $10,000
- Student loan interest rate below historical investment returns: maintain minimum payments
- Time horizon for retirement: 40+ years
Recommended strategy:
- Months 1-8: Allocate $1,250/month to high-yield savings until the emergency fund reaches $12,000
- Month 9+:
- Continue $200/month to savings for apartment deposit (short-term goal)
- Contribute $500/month to 401(k) to capture employer match (immediate 100% return)
- Invest an additional $300/month in a Roth IRA for tax-free retirement growth
- Maintain student loan minimum payments
Allocation: 67% savings initially, transitioning to 20% savings / 80% investing after emergency fund completion.
Scenario 2: Mid-Career Professional Planning Home Purchase
Profile:
- Age: 35
- Household income: $120,000 annually
- Current savings: $25,000
- Current investments: $85,000 in 401(k)
- Goal: Purchase $400,000 home in 3 years (need $80,000 for 20% down payment)
Analysis:
- Emergency fund needed: $30,000 (6 months of $5,000 essential expenses)
- Current emergency fund: Adequate
- Down payment gap: $55,000 needed in 36 months
- Time horizon: Too short for significant market risk
Recommended strategy:
- Down payment savings: $1,530/month in high-yield savings account (earns ~$4,000 in interest over 3 years)
- Retirement investing: Continue $1,000/month to 401(k) (don’t sacrifice long-term for short-term)
- Additional cushion: $300/month to general savings for closing costs and moving expenses
Allocation: 65% savings (short-term goal) / 35% investing (long-term retirement)
Note: This scenario demonstrates why the 3x rent rule and 20/4/10 rule for car buying matter—they prevent overextension that would compromise both savings and investment capacity.
Scenario 3: Pre-Retiree Optimizing Asset Allocation
Profile:
- Age: 58
- Household income: $180,000 annually
- Current savings: $40,000 emergency fund
- Current investments: $750,000 in retirement accounts
- Goal: Retire at 65 with $1.2 million
Analysis:
- Emergency fund: Adequate
- Time to retirement: 7 years
- Required portfolio growth: $450,000
- Withdrawal timeline: Begins in 7 years, extends 30+ years
Recommended strategy:
- Maintain emergency fund: Keep $40,000 in high-yield savings
- Aggressive retirement contributions: Max 401(k) at $30,500/year (2025 limit with catch-up) plus $8,000 to IRA
- Asset allocation shift: Gradually transition from 80/20 stocks/bonds to 60/40 as retirement approaches
- Create retirement income ladder: Begin building 2-3 years of expenses in bonds/cash equivalents 2 years before retirement.
Allocation: 5% liquid savings / 95% invested, with investment allocation becoming more conservative over time
This scenario illustrates how the saving vs investing question evolves—even in retirement, the majority of assets remain invested to support 30+ years of withdrawals, but near-term spending needs shift to stable, liquid assets.
Advanced Considerations: Optimizing Your Saving and Investing Strategy
Beyond the fundamentals, several sophisticated concepts enhance wealth-building efficiency.
Tax-Loss Harvesting in Investment Accounts
Concept: Strategically selling investments at a loss to offset capital gains and reduce tax liability, then immediately purchasing similar (but not identical) securities to maintain market exposure.
Mathematical benefit: A $10,000 capital loss offsets $10,000 in capital gains, saving $1,500 in taxes at the 15% long-term capital gains rate. That $1,500 can be reinvested for additional compound growth.
Application: Particularly valuable in taxable investment accounts during market downturns. Not applicable to savings accounts or tax-advantaged retirement accounts.
The 4% Rule and Retirement Planning
The 4% rule provides a mathematical framework for determining how much to save versus invest for retirement.
Principle: A retiree can withdraw 4% of their portfolio annually (adjusted for inflation) with a high probability of funds lasting 30+ years.
Reverse calculation: Desired annual retirement income ÷ 0.04 = Required portfolio size
Example:
- Desired retirement income: $60,000/year
- Required portfolio: $60,000 ÷ 0.04 = $1,500,000
- Current age: 35
- Retirement age: 65
- Time horizon: 30 years
- Required monthly investment: ~$1,500 at 8% returns
This calculation determines how much must be invested (not saved) to achieve retirement goals—illustrating why long-term goals require investment strategies.
Sequence of Returns Risk
Concept: The order of investment returns matters significantly for retirees making withdrawals, but barely affects accumulators making contributions.
Implication for saving vs investing: As retirement approaches, shift 2-3 years of planned expenses from volatile investments to stable savings. This buffer prevents forced selling during market downturns early in retirement—the most dangerous period for sequence of returns risk.
Strategy: Create a “retirement income ladder” with 1 year in savings, 1 year in short-term bonds, 1 year in intermediate bonds, with the remainder in growth investments. Replenish from investments during positive market years.
Asset Location Optimization
Concept: Different account types receive different tax treatment. Strategic asset placement maximizes after-tax returns.
Framework:
- Tax-advantaged accounts (401k, IRA): Hold tax-inefficient investments (bonds generating ordinary income, actively managed funds with high turnover, REITs)
- Taxable accounts: Hold tax-efficient investments (index funds with low turnover, individual stocks held long-term for capital gains treatment)
- Roth accounts: Hold the highest-growth-potential investments (small-cap stocks, emerging markets) since all gains are tax-free.e
Mathematical impact: Proper asset location can add 0.2-0.5% to annual after-tax returns—a significant advantage over 30-40 year periods.
Behavioral Economics and Commitment Devices
Challenge: Humans struggle with delayed gratification and systematic saving/investing.
Solution: Automate the decision process to remove willpower from the equation.
Implementation:
- Automatic transfers: Schedule savings account deposits on payday before discretionary spending occurs
- Automatic investment: Set up recurring investment purchases regardless of market conditions
- Automatic escalation: Increase contribution percentages annually or with raises
- Separate accounts: Use different banks for emergency savings (harder to access impulsively) and checking (easy daily access)
Evidence: Studies show automatic enrollment in 401(k) plans increases participation rates from 60% to 90%+. The same principle applies to personal saving and investing strategies.
💰 Saving vs Investing Calculator
Compare the long-term results of saving versus investing your money
Conclusion: Building Wealth Through Strategic Allocation
The question isn’t “saving vs investing”—it’s “saving and investing in optimal proportion to your specific financial situation.”
The framework is mathematical, not emotional:
- Establish emergency savings first: 3-6 months of expenses in FDIC-insured accounts provides financial stability and prevents forced investment liquidation during market downturns or personal crises.
- Match strategy to time horizon: Goals under 3 years require savings for capital preservation. Goals beyond 5 years require investing for compound growth. The 3-5 year range demands balanced allocation based on risk tolerance.
- Understand the tradeoffs: Savings protect against market risk but expose you to inflation risk and opportunity cost. Investing accepts short-term volatility in exchange for long-term wealth accumulation that significantly outpaces inflation.
- Implement systematic processes: Automate savings deposits and investment contributions to remove behavioral barriers. Consistent execution over decades matters more than perfect timing or optimal asset selection.
- Review and adjust annually: Financial circumstances, time horizons, and risk tolerance evolve. Annual reviews ensure your saving and investing allocations remain aligned with current reality.
The data is unambiguous: Over periods of 10+ years, diversified investment portfolios have consistently outperformed savings accounts by 5-7 percentage points annually. That difference, compounded over 30-40 years, represents the gap between modest financial security and substantial wealth.
But that mathematical advantage only materializes when adequate emergency savings prevent forced liquidation during inevitable market downturns. The optimal strategy combines both approaches—savings for stability and liquidity, investments for growth and wealth building.
Your next steps:
- Calculate your emergency fund requirement (3-6 months of essential expenses)
- If below target, prioritize high-yield savings contributions until complete
- Once established, begin systematic investing in low-cost, diversified index funds
- Automate both savings maintenance and investment contributions
- Review annually and adjust allocations as time horizons shorten for specific goals
The math behind money is straightforward. Execution requires discipline, patience, and a systematic process. But the compound result, financial security combined with long-term wealth accumulation, justifies the effort required to optimize your savings and investing strategy.
References
[1] Federal Deposit Insurance Corporation. “Deposit Insurance FAQs.” FDIC.gov, 2025.
[2] Stern School of Business, NYU. “Annual Returns on Stock, T.Bonds and T.Bills: 1928 – Current.” Historical Returns Data, 2025.
[3] Hartford Funds. “Stock Market Corrections & Bear Markets: Historical Trends.” Investment Research, 2024.
[4] J.P. Morgan Asset Management. “Guide to the Markets: Stocks – Long-Term Returns.” Market Insights, Q1 2025.
[5] Internal Revenue Service. “Topic No. 409 Capital Gains and Losses.” IRS.gov, 2025.
[6] Schwab Center for Financial Research. “Does Market Timing Work? Comparing Investment Strategies.” Research Report, 2023.
[7] Vanguard. “How America Saves 2024: Automatic Enrollment and Participation Rates.” Annual Survey, 2024.
Author Bio
Max Fonji is a financial educator and founder of The Rich Guy Math, where he deconstructs complex financial concepts through data-driven analysis and clear mathematical frameworks. With expertise in valuation principles, investment strategy, and evidence-based wealth building, Max teaches readers how money actually works, beyond marketing hype and conventional wisdom. His approach combines analytical rigor with accessible explanations, empowering individuals to make informed financial decisions based on logic, data, and proven principles.
Educational Disclaimer
This article provides educational information about saving and investing strategies for informational purposes only. It does not constitute personalized financial advice, investment recommendations, or tax guidance. Individual financial situations vary significantly based on income, expenses, risk tolerance, time horizon, and personal circumstances.
Before making investment decisions, consult with qualified financial advisors, tax professionals, and legal counsel who can evaluate your specific situation. Past performance does not guarantee future results. All investments carry risk, including potential loss of principal. FDIC insurance covers deposits up to $250,000 per depositor, per institution, but does not cover investment products.
The Rich Guy Math and its authors do not provide personalized financial planning, investment management, or tax preparation services. Readers are responsible for conducting their own due diligence and making informed decisions appropriate to their individual circumstances.
Frequently Asked Questions About Saving vs Investing
How much should I save before I start investing?
Build 3–6 months of essential expenses in an emergency fund before investing. The specific amount depends on income stability (3 months for stable employment, 6 months for variable income) and your personal risk tolerance. Once this foundation exists, begin investing surplus income while maintaining the emergency fund.
Can I save and invest at the same time?
Yes—this is the optimal approach for most people. Keep your emergency fund in savings while systematically investing for long-term goals. The balance between saving and investing depends on your time horizon for each financial goal.
Is it better to pay off debt or invest?
Compare your debt’s interest rate to expected investment returns. High-interest debt (like credit cards at 18–25%) should be eliminated before investing. Low-interest debt (such as mortgages at 3–4%) can be maintained while investing. Student loans at 4–6% fall into a middle zone—factor in risk tolerance and psychological comfort, not just math.
What’s the minimum amount needed to start investing?
Most brokers now offer fractional shares with no minimum. Practically, consistent monthly investments of $100–$500 allow proper diversification using low-cost index funds or ETFs. Starting early matters more than waiting to build a large lump sum.
Should I use a savings account or money market fund?
For emergency funds and short-term savings, high-yield savings accounts provide FDIC insurance, strong 2025 interest rates (4–5%), and full liquidity. Money market funds may yield slightly more but do not have FDIC insurance. For balances under $250,000, savings accounts deliver better risk-adjusted returns.
How do I know if I’m too conservative with my investments?
If your stock allocation is far below (100 − your age), you may be overly conservative. For example, a 30-year-old holding only 30% stocks likely sacrifices long-term growth. Compare your allocation to historical stock performance over 10+ year periods and ensure your strategy reflects your actual time horizon.
What happens to my savings and investments during a recession?
Savings held in FDIC-insured accounts remain safe—your principal and interest are guaranteed regardless of market conditions. Investments often fall during recessions (stock markets historically drop 30–40% in bear markets), but typically recover and reach new highs within 2–5 years. This underscores why emergency savings protect you from selling investments at a loss.
Related posts:
 What Is the 3x Rent Rule & How to Calculate It (With Examples)
 20/4/10 Rule for Car Buying: Smart Budgeting with 20% Down, 4-Year Loan & 10% Cap
 Emergency Fund vs Savings: What’s the Real Difference and Why It Matters
 How to Save Money Fast: A Smart Savings Plan That Actually Works
 The 50/30/20 Rule: A Simple Yet Powerful Budget Framework
 High-Yield Savings Account: What It Is, How It Works, and How to Pick the Best One