Most people confuse investing with gambling. They chase hot stocks, panic during downturns, and wonder why their portfolios underperform year after year.
Smart investing isn’t about picking the next Amazon or timing market crashes. It’s about understanding the math behind money, managing risk systematically, and letting compound growth do the heavy lifting over time.
This guide explains what smart investing actually means, the frameworks that separate intelligent wealth building from reckless speculation, and the practical strategies you can implement today—regardless of your income level or investment experience.
By the end, you’ll understand how to grow wealth using evidence-based principles that have worked for decades, not trendy tactics that disappear when markets turn.
Key Takeaways
- Smart investing prioritizes risk-adjusted returns over maximum returns—understanding what you could lose matters more than what you might gain.
- Time in the market beats timing the market—consistent, long-term investing outperforms short-term speculation in 95% of cases.
- Diversification is non-negotiable—spreading investments across asset classes reduces portfolio volatility by 30-40% without sacrificing returns.
- Fees compound against you—a 1% annual fee difference can cost you over 25% of your portfolio value over 30 years
- Behavior determines outcomes—emotional decisions during market volatility destroy more wealth than poor asset selection.
What Is Smart Investing? (Simple Definition)
Smart investing means allocating capital to assets with favorable risk-adjusted return profiles over extended time horizons, based on data and fundamental analysis rather than speculation or emotion.
In plain English: putting money into investments that have historically grown wealth while managing downside risk, then holding them long enough for compound growth to work.
The difference between smart investing and gambling comes down to three factors:
Evidence-based decision making. Smart investors analyze historical performance data, company fundamentals, economic indicators, and valuation metrics. Gamblers chase rumors, tips, and price momentum without understanding what they own.
Risk management before return optimization. Smart investors ask “what could I lose?” before “what could I gain?” They understand volatility, diversification, and position sizing. Gamblers focus exclusively on upside potential while ignoring downside scenarios.
Long-term wealth accumulation. Smart investors measure success in years and decades, allowing compound growth to multiply returns. Speculators measure success in days and weeks, constantly trading and eroding returns through fees and taxes.
According to a 2024 DALBAR study, the average equity investor earned 5.5% annually over 20 years while the S&P 500 returned 9.8%—a 44% performance gap caused primarily by emotional decision-making and poor timing.[1]
Insight: Smart investing isn’t about being right all the time. It’s about being right enough, over long enough periods, while avoiding catastrophic mistakes that permanently impair capital.
Smart Investing vs Speculation: The Critical Difference
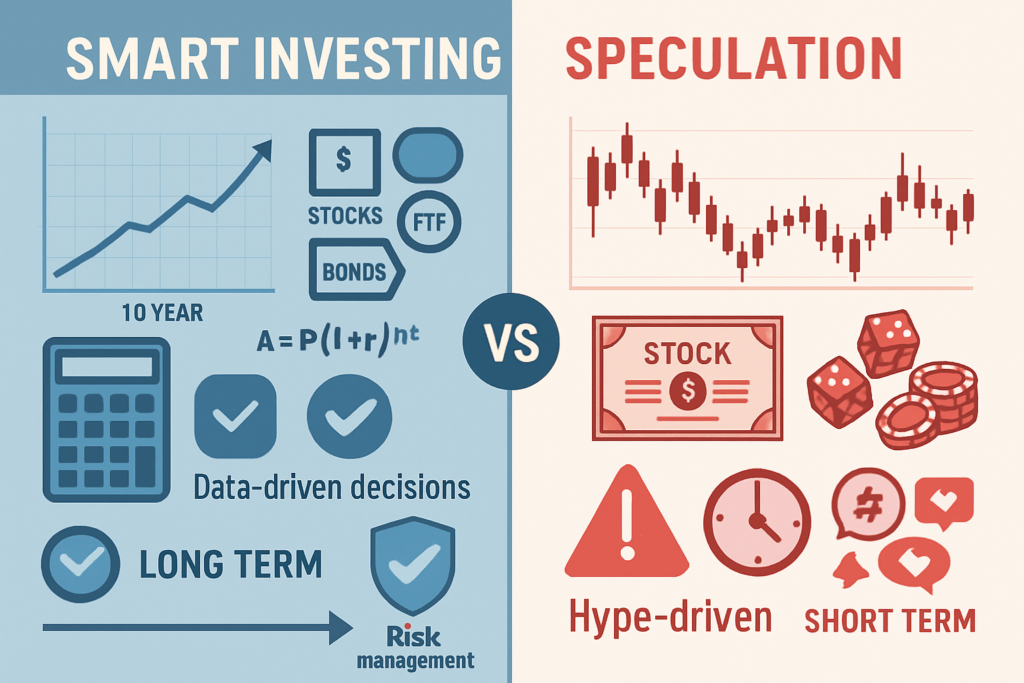
Understanding the distinction between investing and speculation determines whether you build wealth or destroy it.
| Smart Investing | Speculation |
|---|---|
| Based on fundamental analysis and data | Based on price momentum and hype |
| Long-term time horizon (5+ years) | Short-term time horizon (days to months) |
| Diversified across asset classes | Risk is ignored or misunderstood |
| Risk managed through position sizing | Attempts to beat the market consistently |
| Income generation + capital appreciation | Pure capital appreciation |
| Low turnover and tax efficiency | High turnover and tax inefficiency |
| Accepts market returns | Attempts to beat market consistently |
| Evidence-based decision framework | Emotion-driven decision making |
Real-World Example: Index Fund Investor vs Meme Stock Trader
Smart Investor Profile:
- Invests $500 monthly into diversified index funds
- Portfolio allocation: 70% U.S. stocks, 20% international stocks, 10% bonds
- Average annual return: 8-9% over 30 years
- Total fees: 0.05% annually
- Tax strategy: Hold in tax-advantaged accounts
- Behavior: Reviews portfolio annually, rebalances when needed, ignores daily volatility
Speculator Profile:
- Invests $500 monthly into trending stocks based on social media
- Portfolio allocation: 100% individual stocks, high concentration
- Average annual return: -2% to +15% (highly volatile)
- Total fees: 1-2% annually (trading commissions, bid-ask spreads)
- Tax strategy: Frequent trading triggers short-term capital gains
- Behavior: Checks portfolio multiple times daily, trades on emotion, sells winners too early, holds losers too long
After 30 years, the smart investor accumulates approximately $750,000. The speculator, despite occasional wins, accumulates $200,000—a 73% wealth gap caused by fees, taxes, and behavioral mistakes.[2]
Takeaway: Speculation occasionally produces spectacular short-term gains. Smart investing produces reliable long-term wealth. The math consistently favors the latter.
Core Principles of Smart Investing (The Framework)
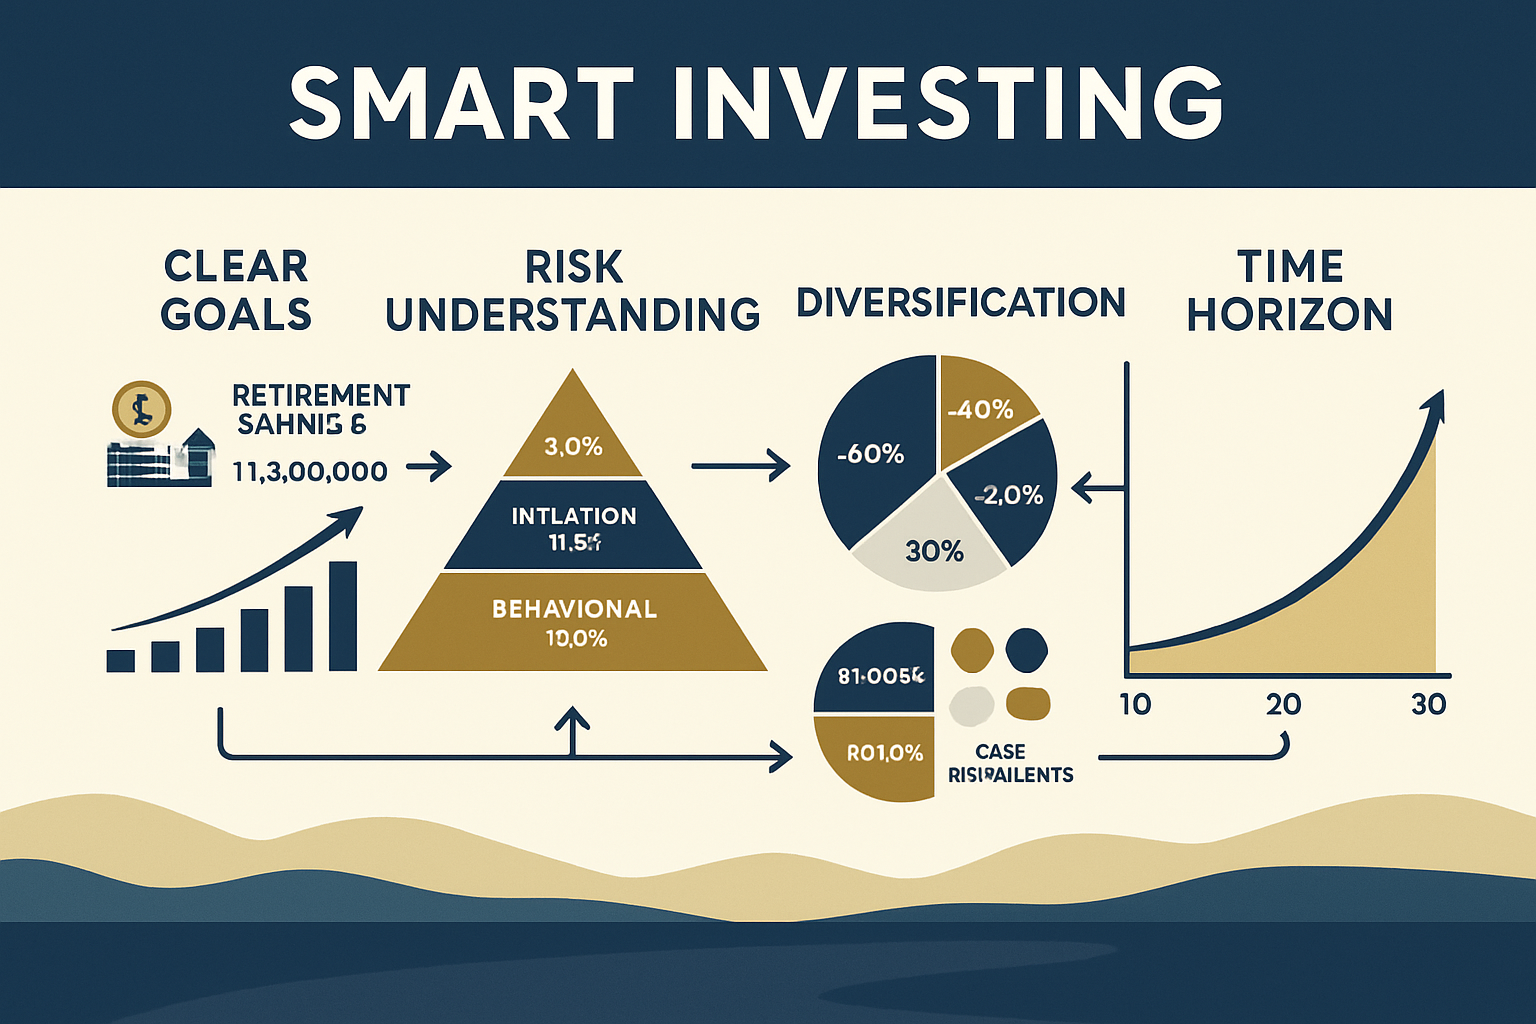
Smart investing operates on four foundational principles that work together to maximize risk-adjusted returns over time.
Principle #1: Invest With a Clear Goal
Every investment decision should connect to a specific financial objective with a defined time horizon.
Common investing goals include:
Retirement accumulation (20-40 year horizon). Building wealth to replace employment income in later years. Requires a growth-focused portfolio with higher equity allocation. Learn more about withdrawal strategies using the 4% rule.
Income generation (ongoing). Creating cash flow from dividends, interest, or distributions. Requires an income-focused portfolio with dividend stocks, bonds, or REITs. Explore dividend investing strategies for consistent cash flow.
Capital preservation (short-term horizon). Protecting purchasing power while maintaining liquidity. Requires a conservative portfolio with high-quality bonds and cash equivalents.
Wealth accumulation (5-15 year horizon). Growing capital for major purchases like real estate or business investment. Requires a balanced portfolio mixing growth and stability.
Your goal determines your asset allocation, risk tolerance, and investment timeline. Investing without clear goals leads to inconsistent decision-making and poor outcomes.
Framework: Define your primary goal, assign a dollar target and timeline, then build a portfolio aligned with both. A 30-year-old saving for retirement needs a completely different strategy than a 55-year-old preserving wealth.
Principle #2: Understand Risk Before Return
Risk represents the probability and magnitude of permanent capital loss. Smart investors quantify risk before evaluating potential returns.
Market risk (systematic risk). The risk that entire markets decline due to economic conditions, affecting all investments. It cannot be eliminated through diversification. Managed through asset allocation and time horizon.
During the 2008 financial crisis, the S&P 500 declined 57% from peak to trough. Investors who understood market risk maintained their allocations and recovered fully by 2013. Those who panicked and sold locked in permanent losses.[3]
Inflation risk. The risk that investment returns fail to exceed inflation, resulting in declining purchasing power. Particularly dangerous for conservative portfolios heavy in cash and bonds.
At 3% annual inflation, money loses 50% of its purchasing power in 24 years. A portfolio earning 2% annually actually loses 1% in real terms—guaranteed wealth destruction.
Behavioral risk. The risk of making emotionally-driven decisions that undermine long-term strategy. Studies show this is the largest risk factor for individual investors.
The cycle of market emotions shows how investors consistently buy high (optimism/euphoria) and sell low (panic/capitulation)—the exact opposite of smart investing.
Concentration risk. The risk of having too much capital in a single investment, sector, or asset class. Eliminated through proper diversification.
Enron employees who held company stock in retirement accounts lost both their jobs and their savings simultaneously—a catastrophic failure of risk management.
Takeaway: Expected return means nothing without understanding expected risk. A 15% potential return with 50% downside risk is worse than an 8% return with 10% downside risk on a risk-adjusted basis.
Principle #3: Diversification Is Non-Negotiable
Diversification means spreading investments across multiple asset classes, sectors, and geographies to reduce portfolio volatility without sacrificing long-term returns.
The mathematical principle: assets with low correlation to each other reduce overall portfolio risk. When stocks decline, bonds often rise. When U.S. markets struggle, international markets may thrive.
Effective diversification includes:
- Asset class diversification: Stocks, bonds, real estate, commodities
- Geographic diversification: U.S., international developed, and emerging markets
- Sector diversification: Technology, healthcare, financials, consumer goods, energy
- Market cap diversification: Large-cap, mid-cap, small-cap companies
- Time diversification: Dollar-cost averaging spreads purchase timing risk
A study by Vanguard found that a 60% stock/40% bond portfolio reduced volatility by 35% compared to 100% stocks while maintaining 90% of the long-term returns.[4]
The Securities and Exchange Commission explicitly recommends diversification as the primary risk management tool for individual investors.[5]
Common diversification mistake: Owning 50 individual stocks in the same sector isn’t diversification. Owning 50 technology stocks means you’re concentrated in one sector, regardless of the number of positions.
Framework: Minimum effective diversification requires exposure to at least three asset classes (stocks, bonds, real estate) across two geographies (domestic, international). Optimal diversification adds sector balance and market cap variety.
Discover how to implement diversification through index funds and ETF strategies.
Principle #4: Time Horizon Determines Strategy
The length of time before you need invested capital fundamentally changes the optimal strategy.
Long time horizons (15+ years) allow you to:
- Accept higher volatility for higher expected returns
- Recover from market downturns through compound growth
- Benefit from tax-advantaged compounding
- Ignore short-term market noise
Short time horizons (0-5 years) require you to:
- Prioritize capital preservation over growth
- Reduce equity exposure to avoid selling during downturns
- Maintain liquidity for planned withdrawals
- Accept lower returns in exchange for lower volatility
Historical data show that stock market returns become increasingly predictable and positive as the time horizon extends. Over any 1 year, stocks have been negative 26% of the time. Over any 20 years, stocks have been negative 0% of the time since 1926.[6]
Insight: Time is the most powerful risk management tool available to investors. A 25-year-old can afford to invest aggressively because they have 40 years to recover from downturns. A 65-year-old cannot.
Smart Investing Strategies That Actually Work
Evidence-based strategies that have produced consistent results across decades and market cycles.
Buy-and-Hold Investing
Buy-and-hold means purchasing quality investments and holding them for extended periods (typically 5+ years) regardless of short-term market volatility.
Why it works:
Time in the market beats timing the market. Fidelity analyzed investor accounts and found that the best-performing accounts belonged to people who forgot they had accounts—they never traded, never panicked, never tried to time markets.[7]
Compound growth requires time. A $10,000 investment growing at 8% annually becomes $46,610 after 20 years. The same investment with annual 20% withdrawals and reinvestment becomes only $31,722—a 32% reduction in wealth.
Tax efficiency. Long-term capital gains (assets held 12+ months) are taxed at 0-20% depending on income. Short-term gains are taxed as ordinary income at rates up to 37%. Holding reduces tax drag significantly.
Lower fees. Trading costs money through commissions, bid-ask spreads, and market impact. The average active trader pays 1-2% annually in hidden trading costs.[8]
Implementation: Select diversified, low-cost index funds or quality individual stocks. Contribute consistently. Rebalance annually. Ignore daily market movements. Review strategy only when life circumstances change significantly.
Index Fund Investing
Index fund investing means buying funds that track broad market indices like the S&P 500, total stock market, or total bond market rather than trying to select individual winners.
The math behind index investing:
Over 15-year periods, 92% of actively managed funds underperform their benchmark index after fees.[9] This isn’t because fund managers lack skill—it’s because fees and trading costs compound against investors over time.
Fee impact example:
- Index fund: 0.04% annual fee
- Active fund: 1.00% annual fee
- Initial investment: $100,000
- Time horizon: 30 years
- Annual return before fees: 8%
Results:
- Index fund balance: $988,918
- Active fund balance: $761,225
- Wealth destroyed by fees: $227,693 (23% of potential wealth)
Additional advantages:
- Instant diversification: A single S&P 500 index fund provides exposure to 500 companies across all sectors
- Tax efficiency: Low turnover means fewer taxable events
- Transparency: You know exactly what you own at all times
- Simplicity: No need to analyze individual companies or time trades
Warren Buffett famously bet $1 million that an S&P 500 index fund would outperform a basket of hedge funds over 10 years. The index fund won by a massive margin—85.4% total return vs 22% for hedge funds.[10]
Explore the best index funds for 2025 to implement this strategy immediately.
Dollar-Cost Averaging
Dollar-cost averaging (DCA) means investing fixed amounts at regular intervals regardless of market conditions, rather than investing lump sums all at once.
How it reduces behavioral mistakes:
Eliminates timing decisions. You invest the same amount monthly whether markets are up or down, removing the temptation to “wait for a better entry point.”
Buys more shares when prices are low. Your fixed investment amount purchases more shares during market declines and fewer during rallies—automatically buying low and selling high over time.
Reduces regret risk. If you invest a lump sum and the markets immediately decline 20%, you experience severe psychological pain. DCA spreads that risk across multiple entry points.
Example:
- Monthly investment: $500
- Month 1: Share price $50 → Buy 10 shares
- Month 2: Share price $40 → Buy 12.5 shares
- Month 3: Share price $60 → Buy 8.33 shares
- Average share price: $50
- Average cost per share: $48.78
You paid less than the average price because you bought more shares when prices were low.
When DCA makes sense:
- Regular contributions from employment income
- Building positions over time in tax-advantaged accounts
- High market uncertainty or elevated valuations
- Investors are prone to emotional decision-making
When lump-sum investing makes sense:
- Receiving an inheritance or a windfall
- Historically low valuations
- Very long time horizons (20+ years)
- Disciplined investors are comfortable with volatility
Research shows that lump-sum investing outperforms DCA about 68% of the time because markets trend long-term upward. However, DCA produces better risk-adjusted returns and reduces behavioral mistakes for most investors.
Common Smart Investing Mistakes (Even Smart People Make)
Intelligence doesn’t prevent investing mistakes. Understanding common behavioral traps does.
Mistake #1: Overtrading
Trading frequently based on market news, price movements, or “opportunities” destroys wealth through fees, taxes, and poor timing.
The data:
- Investors who traded most frequently earned 6.5% annually
- Investors who traded least frequently earned 7.1% annually
- Buy-and-hold investors earned 8.2% annually[12]
Each trade incurs costs: commissions, bid-ask spreads, market impact, and potential tax consequences. These costs compound against you over time.
Solution: Establish a rebalancing schedule (annually or semi-annually) and trade only when allocations drift significantly from targets (typically 5+ percentage points).
Mistake #2: Panic Selling During Downturns
Selling investments during market declines locks in losses and misses subsequent recoveries.
The S&P 500 has experienced 26 corrections (10%+ declines) since 1950. Every single one eventually recovered to new highs. Investors who sold during panic and stayed out missed the recovery entirely.
Historical example: During the COVID-19 crash of March 2020, the S&P 500 declined 34% in 23 days. Investors who panicked and sold locked in massive losses. Those who had recovered fully by August 2020 and gained an additional 60% by December 2021.
Solution: Understand that volatility is the price of admission for equity returns. Build an emergency fund covering 6-12 months of expenses so you never need to sell investments during downturns. Review the 50/30/20 budgeting rule to ensure proper cash reserves.
Mistake #3: Chasing Past Performance
Investing in last year’s top-performing funds or sectors is one of the most common and costly mistakes.
Why it fails:
Performance is cyclical. Asset classes and sectors that outperformed recently often underperform subsequently due to mean reversion. Growth stocks dominate for years, then value stocks lead. Small caps outperform, then large caps take over.
Morningstar found that investors consistently pour money into funds after strong performance and withdraw after poor performance—buying high and selling low systematically.[13]
Solution: Focus on asset allocation and diversification rather than chasing returns. Rebalance regularly to sell portions of outperformers and buy underperformers—forcing yourself to buy low and sell high.
Mistake #4: Ignoring Fees
Investment fees compound against you just as investment returns compound for you. A seemingly small fee difference creates massive wealth gaps over time.
30-year fee impact on $100,000 growing at 8% annually:
| Annual Fee | Ending Balance | Fees Paid | Wealth Lost |
|---|---|---|---|
| 0.05% | $988,918 | $49,446 | — |
| 0.50% | $898,358 | $133,642 | $90,560 |
| 1.00% | $761,225 | $237,775 | $227,693 |
| 2.00% | $574,349 | $425,651 | $414,569 |
A 2% annual fee doesn’t mean you pay 2% of your initial investment. It means you pay 2% of your entire balance every year—and you lose the compound growth on those fees forever.
Hidden fees to watch:
- Expense ratios (disclosed)
- Trading commissions (sometimes hidden)
- Bid-ask spreads (always hidden)
- 12b-1 marketing fees (disclosed but often overlooked)
- Load fees (front-end or back-end charges)
- Advisory fees (if using a financial advisor)
Solution: Prioritize low-cost index funds and ETFs with expense ratios below 0.20%. Avoid load funds entirely. Understand the total cost of ownership before investing.
Mistake #5: Lack of Diversification
Concentrating investments in a single stock, sector, or asset class exposes you to catastrophic risk.
Historical examples of concentration risk:
- Enron employees lost $1.3 billion in retirement savings concentrated in company stock
- Lehman Brothers employees lost 90%+ of their wealth concentrated in the financial sector
- Tech workers who held only tech stocks lost 78% during the 2000-2002 dot-com crash
Solution: Implement true diversification across asset classes, sectors, and geographies. Use index funds for instant diversification. Never hold more than 5-10% of your portfolio in any single position.
Learn about diversification strategies to protect your portfolio from concentration risk.
Smart Investing by Life Stage
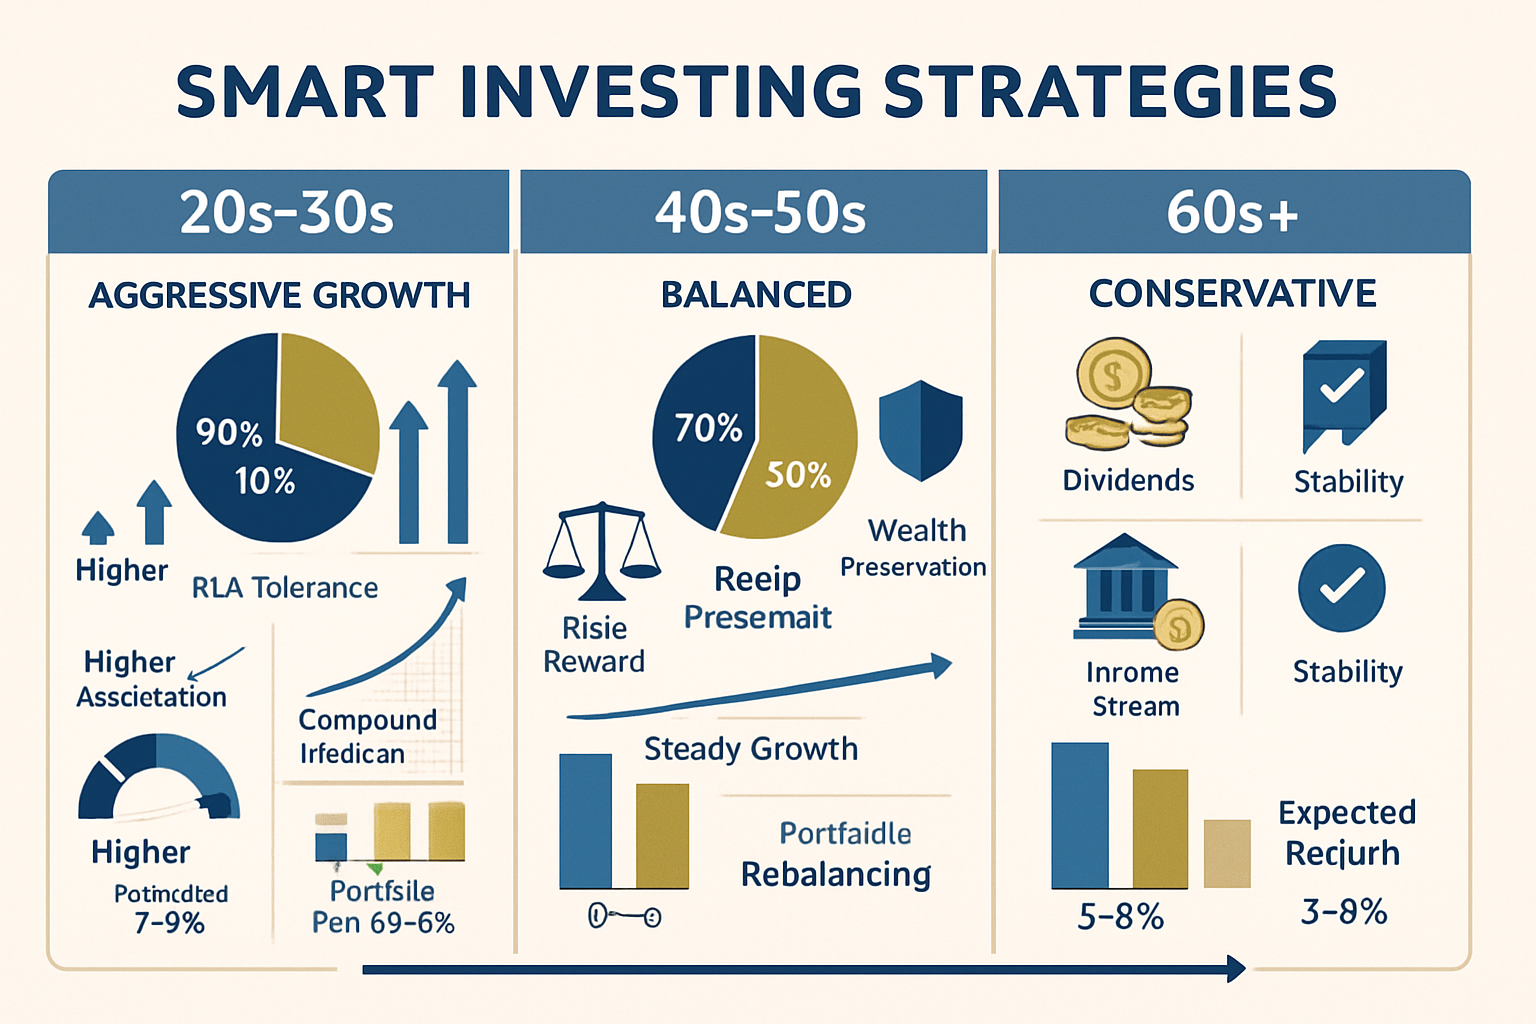
Optimal investment strategy changes as you age because your time horizon, risk capacity, and financial goals evolve.
Smart Investing in Your 20s-30s
Time horizon: 30-40 years until retirement
Primary goal: Maximum wealth accumulation
Risk capacity: Highest—decades to recover from downturns
Recommended allocation:
- 80-90% stocks (domestic and international)
- 10-20% bonds
- 0-5% cash
Strategy priorities:
Maximize equity exposure. With 30+ years until retirement, you can withstand significant volatility in exchange for higher expected returns. Historical data shows stocks return 10% annually over long periods compared to 5% for bonds.
Prioritize tax-advantaged accounts. Max out employer 401(k) match (free money), then Roth IRA contributions (tax-free growth), then additional 401(k) contributions. Every dollar in tax-advantaged accounts compounds without tax drag.
Automate contributions. Set up automatic transfers from checking to investment accounts. Consistency matters more than perfect timing.
Focus on accumulation, not income. Growth stocks and index funds that reinvest dividends maximize compound growth. Income-focused investments make sense later.
Ignore short-term volatility. A 20% market decline in your 20s is a buying opportunity, not a crisis. You have decades to recover and benefit from lower prices.
Example portfolio:
- 50% U.S. total stock market index fund
- 30% International stock index fund
- 10% Small-cap value index fund
- 10% Bond index fund
Takeaway: Your 20s and 30s are when compound growth has the most time to work. Aggressive equity allocation and consistent contributions create exponential wealth over time.
Smart Investing in Your 40s-50s
Time horizon: 15-25 years until retirement
Primary goal: Balance growth and protection
Risk capacity: Moderate—enough time to recover, but needs to preserve gains
Recommended allocation:
- 60-75% stocks
- 25-35% bonds
- 0-5% cash
Strategy priorities:
Gradually reduce equity exposure. Begin shifting from aggressive growth to balanced portfolios. A 50-year-old can still recover from a market crash, but has less time than a 30-year-old.
Increase fixed income allocation. Bonds provide stability and income while reducing portfolio volatility. A 30% bond allocation reduces portfolio volatility by approximately 25% while maintaining 85% of equity returns.
Maximize retirement contributions. Peak earning years allow for maximum 401(k) and IRA contributions. Catch-up contributions (age 50+) allow an additional $7,500 annually in 401(k)s and $1,000 in IRAs.
Eliminate high-interest debt. Paying off credit cards and personal loans provides guaranteed returns equal to the interest rate—often 15-25% annually, better than any investment.
Rebalance regularly. As stocks outperform bonds over time, portfolios drift toward higher equity allocations. Annual rebalancing maintains target risk levels.
Example portfolio:
- 40% U.S. total stock market index fund
- 20% International stock index fund
- 10% Real estate investment trust (REIT) index fund
- 25% Bond index fund
- 5% Cash/money market
Takeaway: Your 40s and 50s are when you balance continued growth with risk management. You’ve accumulated significant wealth and need to protect it while still growing.
Smart Investing Near Retirement (60s+)
Time horizon: 0-15 years until retirement, then 20-30 years in retirement
Primary goal: Capital preservation and income generation
Risk capacity: Lower—limited time to recover from major losses
Recommended allocation:
- 40-50% stocks (maintain growth for longevity)
- 40-50% bonds (stability and income)
- 10-15% cash (liquidity for withdrawals)
Strategy priorities:
Preserve capital. Major losses in the years before or after retirement have catastrophic effects. A 40% portfolio decline at age 65 may never be recovered.
Generate reliable income. Shift toward dividend-paying stocks, bonds, and income-focused investments. Create a predictable cash flow to fund retirement expenses. Explore dividend growth stocks and monthly dividend options.
Maintain equity exposure. Retirement can last 30+ years. A 100% bond portfolio won’t keep pace with inflation. Maintain 40-50% stocks for continued growth.
Create a withdrawal strategy. The 4% rule suggests withdrawing 4% of portfolio value in year one of retirement, then adjusting for inflation annually. This provides a 95% probability of the portfolio lasting 30+ years.
Reduce volatility. Shift from growth stocks to dividend aristocrats, investment-grade bonds, and stable value funds. Reduce exposure to emerging markets and small-cap stocks.
Example portfolio:
- 25% Dividend aristocrat stocks
- 15% U.S. total stock market index fund
- 10% REIT index fund
- 30% Investment-grade bond fund
- 10% Treasury bonds
- 10% Cash/money market
Takeaway: Retirement investing requires balancing three competing needs: capital preservation, income generation, and continued growth for longevity. The right allocation depends on your specific retirement timeline and income needs.
Smart Investing Tools & Accounts
The account type you use determines tax treatment, contribution limits, and withdrawal rules—all of which significantly impact long-term wealth.
Tax-Advantaged Retirement Accounts
401(k) / 403(b) (Employer-Sponsored Plans)
How they work: Pre-tax contributions reduce current taxable income. Investments grow tax-deferred. Withdrawals in retirement are taxed as ordinary income.
Contribution limits (2025): $23,000 annually, plus $7,500 catch-up contribution if age 50+
Advantages:
- Employer match (free money—average match is 4.7% of salary)
- Immediate tax deduction reduces the current tax bill
- Tax-deferred growth means no taxes on dividends, interest, or capital gains until withdrawal
- Creditor protection in most states
Disadvantages:
- Limited investment options (only what the employer offers)
- Required minimum distributions (RMDs) starting at age 73
- Withdrawals before age 59½ incur a 10% penalty plus ordinary income tax
- All withdrawals are taxed as ordinary income (even if from capital gains)
Best for: Anyone with an employer match (contribute at least enough to get a full match), high earners in peak tax years who expect lower tax rates in retirement.
Roth IRA (Individual Retirement Account)
How it works: After-tax contributions (no immediate deduction). Investments grow tax-free. Qualified withdrawals in retirement are completely tax-free.
Contribution limits (2025): $7,000 annually, plus $1,000 catch-up if age 50+
Income limits: Phase-out begins at $146,000 (single) or $230,000 (married filing jointly)
Advantages:
- Tax-free growth and withdrawals forever
- No required minimum distributions (can leave to heirs)
- Can withdraw contributions (not earnings) anytime without penalty
- Tax diversification in retirement
Disadvantages:
- Income limits exclude high earners (though backdoor Roth conversions exist)
- Lower contribution limits than 401(k)
- No immediate tax deduction
Best for: Young investors in lower tax brackets, anyone expecting higher tax rates in retirement, and high earners using backdoor Roth strategies.
Compare Roth IRA vs Traditional IRA to determine which account type suits your situation.
Traditional IRA
Similar to a 401(k) but self-directed with unlimited investment options. Contribution limits same as Roth IRA. Tax-deductibility phases out at higher incomes if you have access to an employer retirement plan.
Best for: Self-employed individuals, those without employer retirement plans, or as a supplement to 401(k) contributions.
Taxable Brokerage Accounts
How they work: After-tax contributions. Dividends and interest are taxed annually. Capital gains are taxed when you sell (long-term rates if held 12+ months).
Contribution limits: None
Advantages:
- Complete investment flexibility
- No withdrawal restrictions or penalties
- Access to capital anytime for any reason
- Tax-loss harvesting opportunities
- Step-up in cost basis at death (heirs avoid capital gains tax)
Disadvantages:
- No tax deduction for contributions
- Annual taxes on dividends and interest
- Capital gains tax when selling
Best for: Investors who max out retirement accounts, those saving for goals before retirement age, and high-net-worth individuals building taxable wealth.
Tax optimization strategy: Hold tax-efficient investments (index funds, growth stocks) in taxable accounts. Hold tax-inefficient investments (bonds, REITs, actively managed funds) in tax-advantaged accounts.
Robo-Advisors
Automated investment platforms that build and manage diversified portfolios based on your goals, timeline, and risk tolerance.
How they work: Answer a questionnaire about goals and risk tolerance. The algorithm creates a portfolio of low-cost ETFs. Automatic rebalancing and tax-loss harvesting.
Costs: 0.25-0.50% annually (much lower than human advisors)
Best options: Betterment, Wealthfront, Vanguard Digital Advisor, Schwab Intelligent Portfolios
Best for: Beginning investors who want professional management at low cost, those who lack the time or interest to manage investments themselves.
Explore the best robo-advisors for 2025 for automated portfolio management.
Is Smart Investing Safe? (Risks You Can’t Eliminate)
Smart investing reduces risk but cannot eliminate it. Understanding unavoidable risks prevents unrealistic expectations.
Market Risk (Systematic Risk)
All investments carry some exposure to overall market movements. When the entire market declines, even the best companies and diversified portfolios lose value.
Historical context:
- 2008 Financial Crisis: S&P 500 declined 57%
- 2000-2002 Dot-com Crash: Nasdaq declined 78%
- 2020 COVID Crash: S&P 500 declined 34%
Why it’s unavoidable: Economic recessions, financial crises, and geopolitical events affect all risk assets simultaneously. No amount of diversification eliminates systematic market risk.
How to manage it:
- Maintain appropriate asset allocation for your time horizon
- Keep a 6-12 months emergency fund in cash
- Never invest money you’ll need within 5 years
- Rebalance during downturns to buy assets at lower prices
- Remember that all historical market declines eventually recovered
Insight: Market risk is the price you pay for equity returns. Investors who accept short-term volatility earn long-term premiums over safer assets.
Inflation Risk
The risk that investment returns fail to exceed inflation, resulting in declining purchasing power over time.
Current context: At 3% annual inflation, prices double every 24 years. A portfolio earning 2% annually loses 1% in real (inflation-adjusted) terms—guaranteed wealth destruction.
Assets most vulnerable:
- Cash (0% return, loses to inflation every year)
- Low-yield bonds (often return less than inflation)
- Fixed pensions (purchasing power erodes over time)
Assets that hedge inflation:
- Stocks (companies raise prices with inflation)
- Real estate (rents and property values rise with inflation)
- Treasury Inflation-Protected Securities (TIPS)
- Commodities
Solution: Maintain equity exposure even in retirement. A 100% “safe” portfolio of cash and bonds guarantees inflation-adjusted losses over a 30-year retirement.
The Federal Reserve targets 2% annual inflation as part of its monetary policy.[14] Your portfolio must exceed this hurdle to build real wealth.
Behavioral Risk
The risk of making emotionally-driven decisions that undermine long-term strategy—the largest risk factor for individual investors.
Common behavioral mistakes:
- Panic selling during market declines
- Greed-driven buying during market peaks
- Overconfidence in the ability to pick winners
- Recency bias (believing recent trends continue forever)
- Loss aversion (feeling losses twice as intensely as gains)
The data: Behavioral mistakes cost investors 3-4% annually in returns—more than any other single factor, including fees, taxes, or asset selection.[15]
Solutions:
- Automate investments to remove emotional decisions
- Create a written investment policy statement and follow it
- Avoid checking the portfolio daily (increases emotional reactions)
- Rebalance on schedule, not based on market conditions
- Work with an advisor or accountability partner during volatility
Takeaway: Your behavior determines your returns more than your investment selection. Discipline and consistency beat intelligence and market timing.
How to Start Smart Investing Today (Step-by-Step)
A practical framework to begin building wealth through evidence-based investing.
Step 1: Define Your Goal and Timeline
Write down specific answers:
- What are you investing in? (Retirement, house down payment, financial independence)
- How much do you need? (Specific dollar amount)
- When do you need it? (Specific year)
- What’s your risk tolerance? (Honest assessment of how you’d react to a 30% portfolio decline)
Example: “I’m investing for retirement in 30 years. I need $1.5 million. I can tolerate significant short-term volatility because I have decades to recover.”
This clarity determines everything else: asset allocation, account type, contribution amount, and investment selection.
Step 2: Choose the Right Account Type
Decision framework:
If you have access to employer 401(k) with match:
- Contribute enough to get a full employer match (priority—it’s free money)
- Max out Roth IRA ($7,000/year)
- Return to 401(k) and contribute up to $23,000/year
- Open a taxable brokerage account for additional savings
If you’re self-employed or have no employer plan:
- Max out Roth IRA ($7,000/year)
- Consider Solo 401(k) or SEP IRA (much higher contribution limits)
- Open a taxable brokerage account for additional savings
If you’re saving for a near-term goal (5 years or less):
- Use a high-yield savings account or a short-term bond fund
- Don’t use retirement accounts (penalties for early withdrawal)
Step 3: Select Diversified Investments
For beginners, the simplest effective portfolio:
Option 1: Three-Fund Portfolio
- 60% U.S. Total Stock Market Index Fund
- 30% International Stock Index Fund
- 10% Bond Index Fund
Option 2: Target-Date Fund
- Single fund that automatically adjusts allocation as you age
- Example: “Target Retirement 2055 Fund” for someone retiring around 2055
- Handles diversification and rebalancing automatically
Option 3: Robo-Advisor
- Answer the questionnaire about goals and risk tolerance
- Algorithm builds diversified portfolio
- Automatic rebalancing and tax optimization
Fund selection criteria:
- Expense ratio below 0.20%
- Diversified across hundreds or thousands of holdings
- Tracks the broad market index
- Available at major brokerages (Vanguard, Fidelity, Schwab)
Discover the best ETFs to buy for simple, diversified portfolio construction.
Step 4: Automate Contributions
Set up automatic transfers from your checking account to your investment account on the same day you receive income.
Why automation works:
- Removes emotional decision-making
- Ensures consistency regardless of market conditions
- Implements dollar-cost averaging automatically
- Makes investing effortless (happens without thinking about it)
Recommended approach: Start with whatever amount fits your budget—even $50/month builds wealth over time. Increase contributions by 1% annually or whenever you receive a raise.
Use the 50/30/20 budgeting rule to determine the appropriate investment amount: 20% of income toward savings and investments.
Step 5: Review Annually (Not Daily)
Annual review checklist:
- Is allocation still appropriate for the timeline and goals?
- Has the portfolio drifted significantly from target allocation? (Rebalance if any asset class is 5+ percentage points off target)
- Have life circumstances changed? (Marriage, children, job change, inheritance)
- Are you on track to meet goals? (Adjust contributions if needed)
What NOT to do:
- Check portfolio daily (increases emotional reactions)
- Trade based on market news or predictions
- Constantly change strategy based on recent performance
- Compare your returns to others (everyone has different goals and timelines)
Insight: The best investors are often those who set up their strategy and forget about it for years. Constant tinkering usually reduces returns rather than improving them.
Interactive Smart Investing Portfolio Builder
Smart Investing Portfolio Builder
Get a personalized portfolio allocation based on your age, timeline, and risk tolerance
Your Recommended Portfolio Allocation
Recommendation
Conclusion
Smart investing isn’t complicated, but it requires discipline and a long-term perspective that most investors lack.
The core principles remain constant across decades and market cycles:
Invest with clear goals and appropriate time horizons. Your strategy should align with when you need the money and what you’re trying to accomplish.
Understand and manage risk before chasing returns. Risk-adjusted returns matter more than maximum returns. Protecting capital during downturns matters as much as participating in upturns.
Diversify across asset classes, geographies, and sectors. Concentration creates catastrophic risk. Diversification reduces volatility without sacrificing long-term returns.
Minimize fees and taxes. Every percentage point in fees is a percentage point of returns you’ll never recover. Tax-advantaged accounts and low-cost index funds maximize compound growth.
Control behavior and emotions. Discipline beats intelligence in investing. Following a simple strategy consistently outperforms complex strategies executed inconsistently.
The math behind money is clear: consistent contributions to diversified, low-cost investments held for decades produce reliable wealth accumulation. The challenge isn’t understanding what to do—it’s actually doing it while everyone around you chases trends and times markets.
Start today with whatever amount you can contribute. Automate the process. Ignore the noise. Let compound growth work over time.
The difference between smart investing and speculation is the difference between building wealth and hoping for wealth. Choose wisely.
Educational Disclaimer
The information provided in this article is for educational and informational purposes only and should not be construed as financial, investment, or professional advice.
Smart investing involves risk, including the potential loss of principal. Past performance does not guarantee future results. Market conditions, economic factors, and individual circumstances vary significantly.
Before making any investment decisions, consult with a qualified financial advisor who understands your specific situation, goals, risk tolerance, and financial circumstances. The strategies and examples discussed may not be suitable for all investors.
The Rich Guy Math and its contributors do not provide personalized investment advice or recommendations. All investment decisions are the sole responsibility of the individual investor.
References to specific investments, funds, or strategies are for illustrative purposes only and do not constitute recommendations or endorsements.
About the Author
Max Fonji is the founder of The Rich Guy Math, a data-driven financial education platform that explains the math behind money with precision and clarity.
With a background in financial analysis and a commitment to evidence-based investing principles, Max helps individuals understand how wealth building, risk management, and compound growth actually work—through numbers, logic, and historical data rather than speculation and hype.
The Rich Guy Math provides comprehensive guides on investing fundamentals, valuation principles, financial literacy, and the quantitative frameworks that separate smart investing from gambling.
Every article is researched using authoritative sources, including the SEC, Federal Reserve, academic studies, and peer-reviewed financial research to ensure accuracy and reliability.
Connect with The Rich Guy Math for more data-driven financial insights that cut through the noise and focus on what actually works.
References
[1] DALBAR, Inc. (2024). “Quantitative Analysis of Investor Behavior.” Annual study measuring investor returns versus market returns.
[2] Vanguard Research. (2023). “The Case for Index Fund Investing.” Analysis of long-term performance differences between index investing and active trading strategies.
[3] Federal Reserve Economic Data (FRED). (2008-2013). “S&P 500 Historical Performance During Financial Crisis.” St. Louis Federal Reserve.
[4] Vanguard Investment Strategy Group. (2022). “The Role of Asset Allocation in Portfolio Performance.” Research paper on diversification benefits.
[5] U.S. Securities and Exchange Commission. “Beginners’ Guide to Asset Allocation, Diversification, and Rebalancing.” Investor.gov. https://www.investor.gov/introduction-investing/investing-basics/asset-allocation
[6] Ibbotson Associates. (2024). “Stocks, Bonds, Bills, and Inflation (SBBI) Yearbook.” Historical market performance data 1926-2024.
[7] Fidelity Investments. (2014). “The Best Investors Are Dead.” Internal study of account performance.
[8] Morningstar Research. (2023). “Hidden Costs of Active Trading.” Analysis of total trading costs, including commissions, spreads, and market impact. https://www.morningstar.com/
[9] S&P Dow Jones Indices. (2024). “SPIVA U.S. Scorecard.” Year-end report comparing active fund performance to benchmarks.
[10] Berkshire Hathaway Annual Letter. (2018). Warren Buffett’s commentary on the 10-year bet between index funds and hedge funds.
[11] Vanguard Research. (2021). “Dollar-Cost Averaging vs Lump-Sum Investing.” Comparative analysis of investment timing strategies.
[12] Barber, Brad M., and Terrance Odean. (2000). “Trading Is Hazardous to Your Wealth.” Journal of Finance, Vol. 55, No. 2, pp. 773-806.
[13] Morningstar. (2023). “Mind the Gap: The Behavior Gap in Mutual Fund Returns.” Annual study of investor returns versus fund returns. https://www.morningstar.com/
[14] Federal Reserve. (2024). “Federal Open Market Committee Statement on Longer-Run Goals and Monetary Policy Strategy.” https://www.federalreserve.gov/
[15] Dalbar, Inc. (2023). “Quantitative Analysis of Investor Behavior.” Study measuring the impact of behavioral mistakes on investment returns.