A profitable company can still go bankrupt.
This statement confuses many new investors, but it reveals a fundamental truth about business finance: making money and having cash available are two different things. Understanding solvency vs liquidity is essential for anyone analyzing companies, managing personal finances, or building long-term wealth.
The math behind money requires distinguishing between whether a business can pay its bills this month versus whether it can survive the next five years. These two concepts, liquidity and solvency, measure different aspects of financial health, and both matter tremendously for investors, business owners, and anyone practicing sound financial literacy.
This guide breaks down the key differences between solvency and liquidity, explains why both metrics matter, and shows how to use them for better financial decisions in 2025 and beyond.
Key Takeaways
- Liquidity measures short-term financial health: the ability to convert assets to cash quickly and meet immediate obligations within 12 months
- Solvency measures long-term financial stability: the capacity to meet all debts and obligations over the company’s entire lifespan
- A business can be liquid but insolvent (enough cash now, but drowning in long-term debt) or solvent but illiquid (strong asset base, but cash-strapped today)
- Key liquidity ratios include the current ratio and quick ratio; key solvency ratios include debt-to-equity and interest coverage
- Both metrics are essential for complete financial analysis; ignoring either creates blind spots that can lead to catastrophic investment or business decisions
What Is Liquidity? Understanding Short-Term Financial Health
Liquidity refers to how quickly and easily an asset can be converted into cash without significant loss of value. For businesses, liquidity measures the ability to meet short-term obligations, typically those due within one year.
Cash is the most liquid asset because it requires no conversion. A checking account balance can pay a bill immediately. Conversely, real estate is illiquid because selling property takes time, involves transaction costs, and may require accepting a lower price for speed.
The Math Behind Liquidity
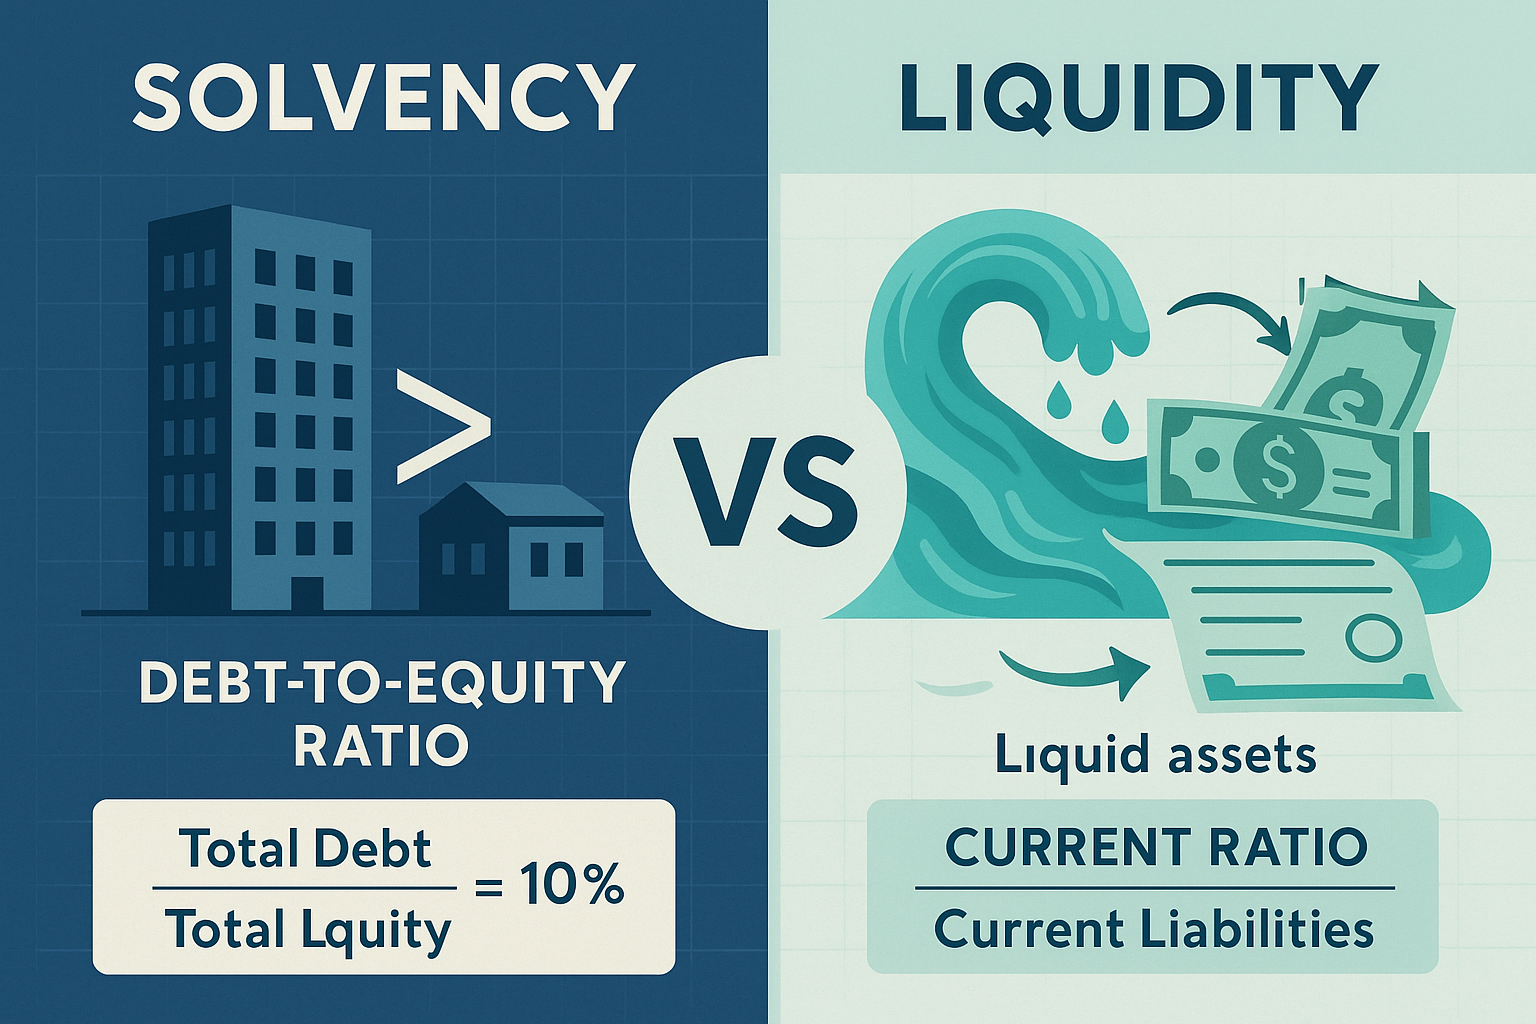
Financial analysts use specific ratios to quantify liquidity. The most common is the current ratio:
Current Ratio = Current Assets ÷ Current Liabilities
Current assets include cash, accounts receivable, inventory, and other assets expected to convert to cash within 12 months. Current liabilities include accounts payable, short-term debt, and other obligations due within one year.
A current ratio of 2.0 means the company has $2 in current assets for every $1 in current liabilities. This provides a cushion for unexpected expenses or revenue shortfalls.
The quick ratio (also called the acid-test ratio) offers a more conservative measure:
Quick Ratio = (Current Assets – Inventory) ÷ Current Liabilities
This calculation removes inventory because selling inventory quickly often requires steep discounts. The quick ratio reveals whether a company can meet its obligations using only its most liquid assets.
Why Liquidity Matters
Liquidity determines survival during cash crunches. A company with strong liquidity can:
- Pay employees on schedule
- Cover unexpected expenses without borrowing
- Take advantage of bulk purchase discounts
- Weather temporary revenue disruptions
- Maintain vendor relationships through timely payments
Poor liquidity creates a cascade of problems. Late payments damage credit ratings, increase borrowing costs, and strain supplier relationships. Employees leave when paychecks bounce. Customers flee when service quality deteriorates.
The 2008 financial crisis demonstrated liquidity’s importance. Many banks held valuable assets but couldn’t convert them to cash quickly enough to meet withdrawal demands. Asset-rich but cash-poor, they required government intervention to survive.
Insight: Liquidity represents financial flexibility—the breathing room that allows businesses and individuals to handle life’s inevitable surprises without catastrophic consequences.
What Is Solvency? Measuring Long-Term Financial Stability
Solvency measures whether total assets exceed total liabilities. A solvent entity owns more than it owes. An insolvent entity faces negative net worth, debts exceeding assets, making bankruptcy likely even if cash flow temporarily remains positive.
While liquidity focuses on the next 12 months, solvency examines the entire financial structure. Solvency answers: “If this business liquidated all assets and paid all debts, would anything remain for owners?”
The Math Behind Solvency
The debt-to-equity ratio is the primary solvency metric:
Debt-to-Equity Ratio = Total Debt ÷ Total Equity
This ratio reveals how much financing comes from creditors versus owners. A ratio of 0.5 means the company uses $0.50 of debt for every $1.00 of equity. Higher ratios indicate greater financial leverage and risk.
The debt-to-assets ratio provides another perspective:
Debt-to-Assets Ratio = Total Debt ÷ Total Assets
This shows what percentage of assets are financed through debt. A ratio of 0.40 means 40% of assets are debt-financed, while 60% are equity-financed.
The interest coverage ratio measures the ability to service debt:
Interest Coverage Ratio = EBIT ÷ Interest Expense
EBIT (Earnings Before Interest and Taxes) represents operating profit. An interest coverage ratio of 5.0 means the company earns five times its interest obligations, providing a substantial cushion for debt service.
Why Solvency Matters
Solvency determines long-term viability. A company with strong solvency can:
- Survive extended downturns without bankruptcy
- Access favorable borrowing terms
- Invest in growth opportunities
- Attract quality employees and partners
- Provide returns to shareholders over decades
Poor solvency creates existential risk. Excessive debt eventually overwhelms even profitable operations. Interest payments consume cash flow. Lenders refuse additional financing. Asset sales at fire-sale prices become necessary.
General Motors filed for bankruptcy in 2009 despite being one of the world’s largest companies. Decades of accumulating pension obligations and debt created insolvency that even substantial assets couldn’t overcome.
Insight: Solvency represents financial sustainability, the structural foundation that allows businesses to survive economic cycles and compound growth over time.
Solvency vs Liquidity: The Critical Differences Explained
Understanding solvency vs liquidity requires recognizing that these metrics measure different dimensions of financial health. They’re complementary, not interchangeable.
Time Horizon
Liquidity = Short-term (0-12 months)
Solvency = Long-term (entire business lifespan)
Liquidity asks: “Can you pay next month’s bills?”
Solvency asks: “Will you still exist in five years?”
Asset Focus
Liquidity examines current assets—those convertible to cash within one year
Solvency examines total assets—everything the company owns, regardless of conversion timeline
A company might own valuable patents, real estate, or equipment (boosting solvency) while lacking cash to make payroll (poor liquidity).
Liability Focus
Liquidity examines current liabilities, obligations due within one year
Solvency examines total liabilities, all debts, regardless of payment timeline
Long-term bonds due in 10 years don’t affect liquidity calculations but significantly impact solvency metrics.
Risk Type
Liquidity risk = Running out of cash before the next revenue cycle
Solvency risk = Accumulating debt that eventually exceeds asset value
Liquidity crises can be resolved through short-term financing, asset sales, or improved collections. Solvency crises require fundamental restructuring or bankruptcy.
The Four Possible Combinations
Companies fall into four categories based on their solvency and liquidity status:
- High Liquidity + High Solvency = Ideal financial health (strong balance sheet, ample cash)
- High Liquidity + Low Solvency = Temporary comfort (cash today, but drowning in long-term debt)
- Low Liquidity + High Solvency = Asset-rich, cash-poor (valuable assets, but immediate cash shortage)
- Low Liquidity + Low Solvency = Financial distress (immediate crisis plus structural problems)
Understanding these combinations prevents dangerous assumptions. A company with $10 million in cash might seem healthy until you discover it carries $100 million in debt maturing over the next five years.
Insight: The relationship between solvency and liquidity reveals the complete financial picture—neither metric alone tells the full story.
Key Ratios: How to Calculate and Interpret Solvency vs Liquidity Metrics
Effective financial analysis requires calculating specific ratios and understanding what they reveal. Here’s how to measure both concepts using real numbers.
Liquidity Ratios in Detail
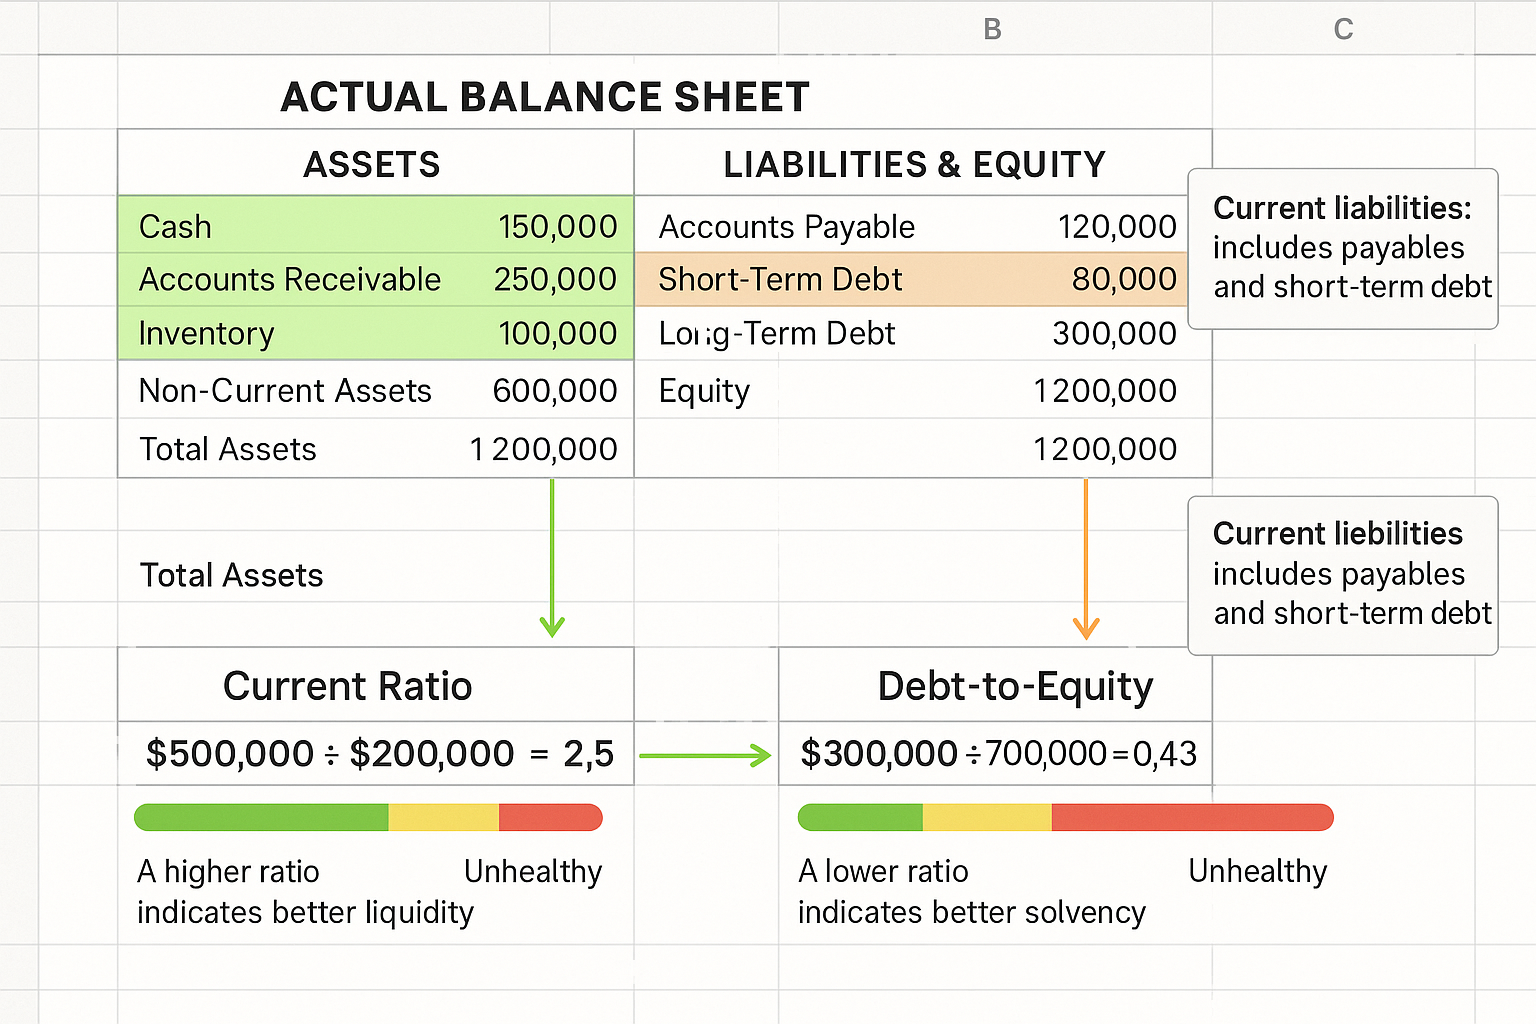
Current Ratio
Formula: Current Assets ÷ Current Liabilities
Example: A company has $500,000 in current assets and $200,000 in current liabilities.
Current Ratio = $500,000 ÷ $200,000 = 2.5
Interpretation:
- Below 1.0 = Danger zone (insufficient current assets to cover current debts)
- 1.0-1.5 = Adequate but tight
- 1.5-3.0 = Healthy range for most industries
- Above 3.0 = Possibly inefficient (too much capital sitting idle)
Industry matters significantly. Retailers often operate with lower current ratios due to rapid inventory turnover. Manufacturing companies typically require higher ratios due to longer production cycles.
Quick Ratio (Acid-Test Ratio)
Formula: (Current Assets – Inventory) ÷ Current Liabilities
Example: Same company with $500,000 current assets, but $150,000 is inventory.
Quick Ratio = ($500,000 – $150,000) ÷ $200,000 = 1.75
Interpretation:
- Below 0.5 = Severe liquidity risk
- 0.5-1.0 = Acceptable for some industries
- Above 1.0 = Strong liquidity position
The quick ratio provides a more conservative view because inventory can be difficult to liquidate quickly without discounts.
Cash Ratio
Formula: (Cash + Cash Equivalents) ÷ Current Liabilities
This most conservative liquidity measure uses only the most liquid assets. Learn more about cash ratio calculations and their significance.
Solvency Ratios in Detail
Debt-to-Equity Ratio
Formula: Total Debt ÷ Total Equity
Example: A company has $300,000 in total debt and $700,000 in total equity.
Debt-to-Equity = $300,000 ÷ $700,000 = 0.43
Interpretation:
- Below 0.5 = Conservative capital structure
- 0.5-1.0 = Moderate leverage
- 1.0-2.0 = High leverage (common in capital-intensive industries)
- Above 2.0 = Potentially dangerous debt levels
For a comprehensive understanding of this critical metric, see our guide on debt-to-equity ratio.
Debt-to-Assets Ratio
Formula: Total Debt ÷ Total Assets
Example: Same company with $300,000 debt and $1,000,000 in total assets.
Debt-to-Assets = $300,000 ÷ $1,000,000 = 0.30
Interpretation:
- Below 0.3 = Low financial risk
- 0.3-0.6 = Moderate debt usage
- Above 0.6 = High dependence on debt financing
This ratio shows what percentage of assets are financed through debt versus equity.
Interest Coverage Ratio
Formula: EBIT ÷ Interest Expense
Example: A company generates $200,000 in EBIT and pays $40,000 in annual interest.
Interest Coverage = $200,000 ÷ $40,000 = 5.0
Interpretation:
- Below 1.5 = Difficulty covering interest payments
- 1.5-2.5 = Minimal coverage cushion
- 2.5-5.0 = Adequate coverage
- Above 5.0 = Strong ability to service debt
This ratio reveals whether operating profits can comfortably cover debt obligations—a critical solvency indicator.
Using Ratios Together
Analyzing solvency vs liquidity requires examining multiple ratios simultaneously. Consider this scenario:
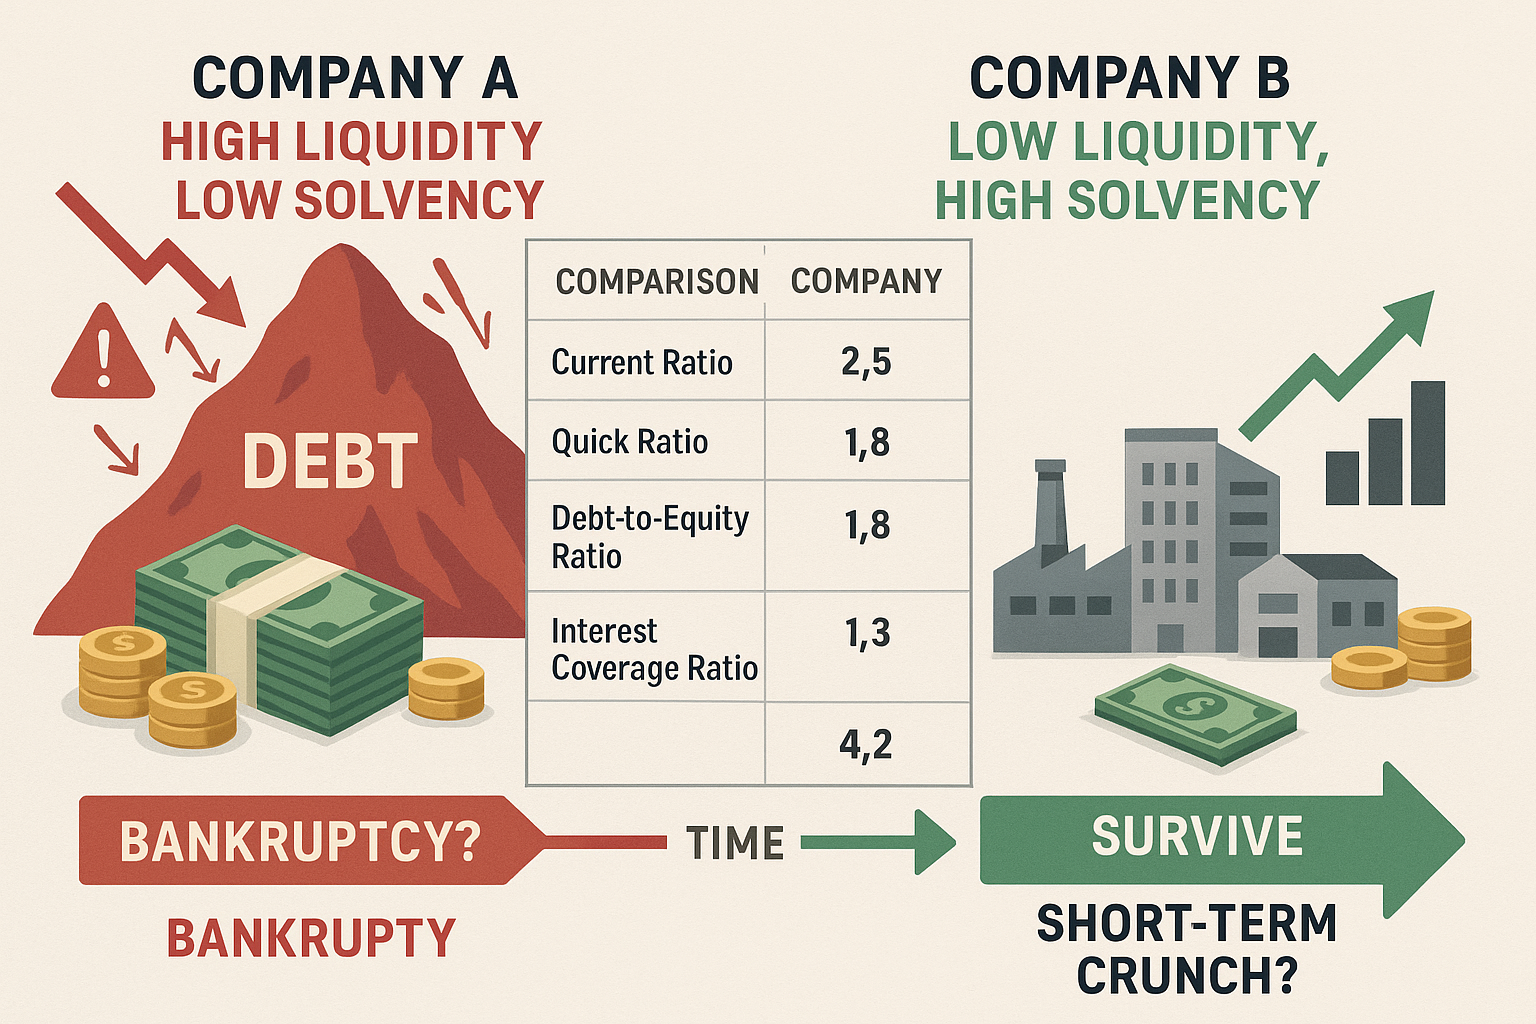
Company A:
- Current Ratio: 2.8 (strong liquidity)
- Quick Ratio: 2.1 (strong liquidity)
- Debt-to-Equity: 3.2 (weak solvency)
- Interest Coverage: 1.8 (weak solvency)
Company A can pay its bills this year but faces long-term structural problems. High debt levels create vulnerability to economic downturns or rising interest rates.
Company B:
- Current Ratio: 1.1 (weak liquidity)
- Quick Ratio: 0.7 (weak liquidity)
- Debt-to-Equity: 0.4 (strong solvency)
- Interest Coverage: 8.5 (strong solvency)
Company B has a strong balance sheet but faces immediate cash management challenges. This company might benefit from a line of credit or better accounts receivable management.
Takeaway: Complete financial analysis examines both time horizons, the immediate (liquidity) and the structural (solvency), to identify risks and opportunities.
Real-World Examples: When Companies Have One But Not the Other
Theory becomes clear through concrete examples. These scenarios demonstrate how solvency and liquidity can diverge dramatically.
Case Study 1: The Profitable but Illiquid Startup
TechStart Inc. develops software with $2 million in annual revenue and 40% profit margins. The company is highly profitable and solvent, with minimal debt and valuable intellectual property.
However, TechStart faces a liquidity crisis:
- Customers pay 60 days after delivery
- Employees require biweekly paychecks
- Server costs are billed monthly
- $180,000 in accounts receivable (money owed but not yet received)
- $25,000 in a checking account
- $85,000 in payroll due next week
Current Ratio: 0.3 (severe liquidity problem)
Debt-to-Equity: 0.1 (excellent solvency)
TechStart is solvent but illiquid. The company owns more than it owes, but cash timing creates immediate problems. The solution involves short-term financing, faster collections, or adjusting payment terms with vendors.
This scenario is common among growing businesses. Revenue growth often requires increased working capital before customer payments arrive. Understanding the cash conversion cycle helps prevent these crises.
Case Study 2: The Cash-Rich but Overleveraged Retailer
MegaMart operates 500 stores with $50 million in cash reserves and strong quarterly sales. The company appears healthy with substantial liquidity.
However, MegaMart carries massive long-term debt:
- $50 million in current assets (including cash)
- $20 million in current liabilities
- $400 million in long-term debt
- $150 million in total equity
Current Ratio: 2.5 (strong liquidity)
Debt-to-Equity: 2.67 (poor solvency)
MegaMart can pay this year’s bills but faces structural insolvency. The debt burden consumes cash flow through interest payments. Economic downturns or competitive pressure could trigger bankruptcy despite current cash reserves.
This pattern appeared frequently during retail bankruptcies in the 2010s. Companies maintained operations for years while accumulating unsustainable debt, eventually collapsing despite appearing healthy in the short term.
Case Study 3: The Real Estate Developer’s Timing Problem
BuildCo owns $20 million in commercial properties and land but faces a temporary cash shortage. A major project is completed in six months, generating $5 million in profit, but current cash reserves are depleted.
- $22 million in total assets (mostly property)
- $8 million in total debt
- $50,000 in cash
- $200,000 in bills due this month
Current Ratio: 0.25 (severe liquidity crisis)
Debt-to-Assets: 0.36 (good solvency)
BuildCo is solvent but illiquid. The company owns valuable assets but can’t quickly convert them to cash. Solutions include bridge financing, selling a property, or finding a partner.
This scenario demonstrates why understanding assets vs liabilities and their conversion timelines matters tremendously for financial planning.
Case Study 4: The Ideal Balance
StableGrowth Corp. maintains both strong liquidity and solvency:
- $8 million in current assets
- $3 million in current liabilities
- $25 million in total assets
- $5 million in total debt
- $20 million in equity
Current Ratio: 2.67 (excellent liquidity)
Quick Ratio: 2.1 (excellent liquidity)
Debt-to-Equity: 0.25 (excellent solvency)
Debt-to-Assets: 0.20 (excellent solvency)
StableGrowth can handle short-term disruptions and possesses long-term structural stability. This company can invest in growth, weather economic storms, and provide consistent returns to shareholders.
Insight: Real-world financial management requires balancing both metrics—maintaining enough liquidity for operational flexibility while preserving solvency for long-term sustainability.
Why Both Metrics Matter for Investors and Business Owners
Successful investing and business management require monitoring solvency vs liquidity continuously. Ignoring either metric creates blind spots that lead to poor decisions.
For Investors: Avoiding Value Traps
Stock investors often fall into value traps—companies that appear cheap based on price-to-earnings ratios but face financial distress. Analyzing both solvency and liquidity reveals these dangers.
A stock trading at 5x earnings looks attractive until you discover:
- Current ratio of 0.6 (liquidity crisis)
- Debt-to-equity of 4.0 (solvency crisis)
- Declining interest coverage (approaching default)
The “cheap” valuation reflects bankruptcy risk, not opportunity. The market prices in the probability of shareholders receiving nothing.
Conversely, strong solvency and liquidity metrics support higher valuations. Companies with fortress balance sheets can:
- Invest through economic downturns
- Acquire distressed competitors
- Return cash to shareholders via dividends and buybacks
- Survive industry disruption
Warren Buffett emphasizes balance sheet strength for this reason. Companies with both strong liquidity and solvency compound wealth over decades because they survive the inevitable crises that destroy overleveraged competitors.
For Business Owners: Managing Growth Sustainably
Entrepreneurs often focus exclusively on revenue growth, ignoring the financial metrics that determine survival. Rapid growth actually increases both liquidity and solvency risks.
Growth Strains Liquidity because:
- Increased sales require more inventory
- Larger operations need more working capital
- Customer payments lag behind expense increases
- Equipment and hiring require upfront cash
Many profitable, growing businesses fail due to liquidity crunches. They’re “growing broke”—expanding faster than cash flow supports.
Growth Strains Solvency when:
- Debt finances expansion
- Leverage ratios deteriorate
- Interest obligations consume cash flow
- Asset values don’t keep pace with debt accumulation
Sustainable growth requires maintaining both metrics. This might mean:
- Growing more slowly to preserve cash reserves
- Raising equity instead of debt
- Improving collection processes
- Negotiating better payment terms with suppliers
Understanding the 50/30/20 rule for budgeting at the personal level translates to similar discipline at the business level—allocating resources to ensure both short-term stability and long-term health.
For Financial Planning: Personal Applications
Individuals face solvency and liquidity challenges, too:
Personal Liquidity = Emergency funds, checking accounts, easily accessible savings
Personal Solvency = Net worth (total assets minus total debts)
A person might have high net worth (valuable home, retirement accounts) but poor liquidity (no emergency fund, living paycheck-to-paycheck). Unexpected expenses create crises despite overall wealth.
Conversely, someone might have $20,000 in savings (good liquidity) but $200,000 in student loans and credit card debt against minimal assets (poor solvency).
Comprehensive financial planning addresses both:
- Build 3-6 months of expenses in liquid emergency funds
- Reduce debt to improve net worth
- Invest for long-term wealth building
- Maintain insurance for catastrophic risks
The 4% rule for retirement planning essentially addresses solvency—ensuring total assets can sustain withdrawals indefinitely. But retirees also need liquidity—accessible cash for near-term expenses without selling assets at inopportune times.
Takeaway: Whether analyzing investments, managing a business, or planning personal finances, both solvency and liquidity metrics provide essential information that prevents catastrophic mistakes and enables sustainable success.
How to Improve Liquidity Without Harming Solvency (and Vice Versa)
Financial management often involves tradeoffs, but strategic actions can improve both metrics simultaneously or enhance one without damaging the other.
Strategies to Improve Liquidity
1. Accelerate Receivables Collection
Collecting money owed faster improves cash position without affecting solvency:
- Offer early payment discounts (2% discount for payment within 10 days)
- Implement automated billing and payment reminders
- Require deposits on large orders
- Factor receivables (sell them to a third party for immediate cash)
2. Optimize Inventory Management
Reducing excess inventory frees cash without harming the balance sheet:
- Implement just-in-time inventory systems
- Negotiate consignment arrangements with suppliers
- Clear slow-moving inventory through sales
- Improve demand forecasting
3. Extend Payables Strategically
Negotiating longer payment terms with suppliers preserves cash:
- Request net-60 or net-90 terms instead of net-30
- Take advantage of payment terms without damaging relationships
- Schedule payments strategically around cash flow cycles
4. Establish Credit Lines
Access to credit improves liquidity without immediately affecting solvency:
- Secure a revolving line of credit
- Maintain the facility unused for emergencies
- Use only when necessary to bridge timing gaps
5. Convert Assets to Cash
Selling non-essential assets improves liquidity:
- Liquidate excess equipment
- Sell unused real estate
- Convert securities to cash
- Lease instead of own when possible
Strategies to Improve Solvency
1. Reduce Debt Levels
Paying down debt directly improves solvency ratios:
- Prioritize high-interest debt first
- Refinance expensive debt to lower rates
- Use profits to accelerate debt repayment
- Avoid taking on new debt unnecessarily
Understanding debt consolidation strategies can help optimize this process.
2. Increase Equity
Adding equity improves the debt-to-equity ratio:
- Retain earnings instead of distributing them
- Issue new shares (for corporations)
- Bring in equity investors or partners
- Convert debt to equity when possible
3. Improve Profitability
Higher profits build equity over time:
- Increase prices where the market allows
- Reduce operating costs
- Improve operational efficiency
- Focus on higher-margin products or services
Understanding accounting profit versus economic profit helps identify true value creation.
4. Grow Asset Values
Increasing asset values improves solvency metrics:
- Invest in appreciating assets
- Improve existing assets (renovations, upgrades)
- Acquire undervalued assets
- Develop intellectual property
Balancing Both Metrics
Some strategies improve both liquidity and solvency:
Increase Profitability and Retain Earnings: Profitable operations generate cash (improving liquidity) and build equity (improving solvency). This is the most sustainable path to financial strength.
Sell Unproductive Assets: Converting unused equipment or property to cash improves liquidity while potentially improving solvency if assets sell above book value.
Improve Operating Efficiency: Reducing waste and improving processes generates cash flow and profits, benefiting both metrics.
Avoid Debt-Financed Growth: Growing through retained earnings and customer deposits rather than debt maintains both liquidity and solvency.
Tradeoffs to Manage Carefully
Some actions improve one metric while harming the other:
Taking on Debt for Cash: Borrowing improves liquidity but worsens solvency. This makes sense for temporary timing issues, but creates problems if it becomes a pattern.
Paying Down Debt Aggressively: Using cash reserves to eliminate debt improves solvency but reduces liquidity. Balance sheet strength improves, but operational flexibility decreases.
Distributing Profits: Paying dividends or owner distributions reduces both liquidity (less cash) and solvency (lower equity). This is appropriate when both metrics are strong, but dangerous when either is weak.
Insight: The most successful financial management focuses on sustainable profitability—the engine that generates both cash flow and equity growth, improving liquidity and solvency simultaneously over time.
Common Mistakes When Analyzing Solvency vs Liquidity
Even experienced investors and managers make errors when evaluating financial health. Avoiding these mistakes improves decision quality.
Mistake 1: Focusing Only on Profitability
The Error: Assuming profitable companies are financially healthy.
The Reality: Profit is an accounting concept; cash is reality. A company can show profits while hemorrhaging cash due to:
- Aggressive revenue recognition
- Growing accounts receivable
- Increasing inventory
- Capital expenditures
- Debt service requirements
The Solution: Always examine both the income statement and balance sheet. Analyze cash flow statements to understand the relationship between profits and cash generation.
Mistake 2: Ignoring Industry Context
The Error: Applying universal ratio standards across all industries.
The Reality: Different industries operate with vastly different financial structures:
- Grocery stores: Low margins, high turnover, low current ratios (1.0-1.5)
- Software companies: High margins, minimal inventory, high current ratios (2.0-4.0)
- Utilities: Capital-intensive, high debt levels, low debt-to-equity, acceptable
- Technology startups: Often unprofitable initially, negative equity is common
The Solution: Compare companies against industry peers and historical norms, not absolute standards.
Mistake 3: Using Single Ratios in Isolation
The Error: Making decisions based on one metric.
The Reality: Financial health is multidimensional. A strong current ratio means little if the company faces insolvency. Low debt might seem positive until you discover the company can’t access credit due to poor operations.
The Solution: Examine multiple ratios across both liquidity and solvency categories. Look for patterns and contradictions.
Mistake 4: Neglecting Trend Analysis
The Error: Evaluating ratios at a single point in time.
The Reality: Financial health is dynamic. A company with a current ratio of 2.0 today might have had 3.5 last year and 1.2 the year before. The trend reveals whether the situation is improving or deteriorating.
The Solution: Analyze ratios over multiple periods (quarterly and annually). Identify trends and understand what’s driving changes.
Mistake 5: Overlooking Off-Balance-Sheet Obligations
The Error: Accepting balance sheet figures at face value.
The Reality: Significant obligations might not appear on the balance sheet:
- Operating leases (though accounting rules have improved)
- Pension obligations
- Legal contingencies
- Guarantees and commitments
The Solution: Read financial statement footnotes. Understand contingent liabilities and commitments that could affect future solvency.
Mistake 6: Confusing Correlation with Causation
The Error: Assuming strong ratios cause business success.
The Reality: Financial ratios are outcomes, not causes. Strong liquidity and solvency result from good business models, competitive advantages, and effective management.
The Solution: Use ratios as diagnostic tools to identify strengths and weaknesses, but understand the underlying business fundamentals that drive those numbers.
Mistake 7: Ignoring the Quality of Assets and Liabilities
The Error: Treating all assets and liabilities as equal.
The Reality: Asset quality varies tremendously:
- Cash is certain; accounts receivable might be uncollectible
- Inventory might be obsolete or unsaleable
- Property values are estimates that might not reflect market reality
Similarly, liability timing and terms matter:
- Short-term debt at high interest rates is more dangerous than long-term fixed-rate debt
- Liabilities to related parties might be more flexible than bank debt
The Solution: Dig deeper than ratio calculations. Understand what comprises the numbers and assess quality, not just quantity.
Takeaway: Effective financial analysis requires examining multiple metrics over time, understanding industry context, and investigating the quality of underlying assets and liabilities, not just calculating ratios mechanically.
💰 Solvency vs Liquidity Calculator
Analyze your company’s short-term and long-term financial health
Current Assets & Liabilities (Liquidity)
Total Assets & Liabilities (Solvency)
Conclusion: Using Solvency and Liquidity for Better Financial Decisions
Understanding solvency vs liquidity transforms financial analysis from superficial to comprehensive. These two metrics reveal different dimensions of financial health—the ability to survive tomorrow and the capacity to thrive for decades.
The math behind money requires this dual perspective. Liquidity without solvency creates false comfort—cash today masks structural problems that eventually destroy value. Solvency without liquidity creates unnecessary crises—strong fundamentals get derailed by temporary cash shortages.
Key principles to remember:
- Measure both dimensions regularly: Calculate liquidity ratios (current ratio, quick ratio) and solvency ratios (debt-to-equity, debt-to-assets) at least quarterly
- Compare against industry standards: Financial norms vary dramatically across industries—context matters
- Analyze trends over time: Single snapshots mislead; patterns reveal whether situations improve or deteriorate
- Investigate the underlying business: Ratios are diagnostic tools, not explanations—understand what drives the numbers
- Balance both metrics in decision-making: Avoid strategies that improve one metric while catastrophically harming the other
For investors, examining both solvency and liquidity prevents value traps and identifies companies with genuine competitive advantages. Companies with fortress balance sheets—strong liquidity and solvency—survive crises that destroy overleveraged competitors, creating opportunities for compound growth.
For business owners and managers, monitoring both metrics enables sustainable growth. Rapid expansion strains both liquidity (working capital needs) and solvency (debt accumulation). Growing within financial constraints prevents the “growing broke” phenomenon that destroys profitable businesses.
For individuals, applying these concepts to personal finance builds resilience. Maintaining emergency funds (liquidity) while building net worth (solvency) creates the financial foundation for long-term wealth building and security.
Next Steps
- Calculate your current ratios: Whether analyzing a business, investment, or personal finances, measure where you stand today
- Identify weaknesses: Determine whether liquidity or solvency (or both) needs improvement
- Create an action plan: Implement specific strategies to strengthen weak areas
- Monitor progress: Recalculate ratios quarterly to track improvement
- Continue learning: Explore related concepts like cash flow analysis, balance sheet fundamentals, and capital structure
The difference between solvency and liquidity might seem academic until a crisis reveals which companies, investments, or personal financial plans can survive stress. Understanding both concepts and maintaining strength in both areas separates sustainable success from eventual failure.
Financial health, like physical health, requires attention to multiple systems simultaneously. Master both solvency and liquidity, and you’ll make better decisions, avoid catastrophic mistakes, and build wealth that compounds over time.
References
[1] Financial Accounting Standards Board (FASB). “Statement of Financial Accounting Concepts No. 5.” FASB.org.
[2] CFA Institute. “Financial Statement Analysis: An Introduction.” CFA Institute Research Foundation, 2023.
[3] Federal Reserve Bank of St. Louis. “Financial Ratios and Credit Risk.” FRED Economic Data, 2024.
[4] Investopedia. “Liquidity Ratios: What They Are and Why They Matter.” Investopedia.com, 2025.
[5] U.S. Securities and Exchange Commission. “Beginners’ Guide to Financial Statements.” SEC.gov, 2024.
[6] Morningstar. “Understanding Company Financial Health Through Ratio Analysis.” Morningstar.com, 2025.
[7] Harvard Business Review. “The Cash Conversion Cycle: A Critical Metric for Operations.” HBR.org, 2024.
[8] Journal of Finance. “Capital Structure and Corporate Financial Distress.” American Finance Association, 2023.
Author Bio
Max Fonji is the founder of The Rich Guy Math, a data-driven financial education platform that explains the math behind money, investing, and wealth building. With a background in economic analysis and a passion for evidence-based investing, Max translates complex financial concepts into actionable insights for beginner and intermediate investors. His work focuses on helping readers understand valuation principles, risk management, and the mathematical foundations of long-term wealth creation.
Educational Disclaimer
This article is provided for educational and informational purposes only. It does not constitute financial, investment, tax, or legal advice. The information presented represents general principles of financial analysis and should not be considered personalized recommendations for any specific individual or business situation.
Financial ratios and metrics discussed in this article should be used as analytical tools within a broader decision-making framework. Past performance does not guarantee future results. All investments and business decisions carry risk, including the potential loss of principal.
Readers should conduct their own research, consider their specific circumstances, and consult with qualified financial, tax, and legal professionals before making any financial decisions. The Rich Guy Math and its authors assume no liability for any actions taken based on the information provided in this article.
Market conditions, accounting standards, and financial regulations change over time. While this article reflects current practices and standards as of 2025, readers should verify that information remains current and applicable to their specific situations.
Frequently Asked Questions About Solvency vs Liquidity
What is the main difference between solvency and liquidity?
Liquidity measures the ability to meet short-term obligations (typically within 12 months) by converting assets to cash quickly. Solvency measures the ability to meet all obligations over the long term, examining whether total assets exceed total liabilities. A company can be liquid but insolvent (cash today, but excessive long-term debt) or solvent but illiquid (valuable assets, but cash-strapped now).
Can a company be profitable but have poor liquidity?
Yes. Profitability measures accounting income using accrual rules, while liquidity reflects actual cash on hand. A company may show strong profits while waiting 60–90 days for customer payments, creating a liquidity crunch despite solid earnings.
Which is more important for investors: solvency or liquidity?
Both matter, but long-term investors focus more on solvency because sustainable capital structures drive compounding over decades. Short-term traders may prioritize liquidity because immediate cash pressures can impact prices. The best analysis evaluates both to assess overall financial strength.
How often should businesses calculate these ratios?
Public companies report quarterly, which is the minimum recommended. Liquidity ratios should be monitored monthly—or weekly for cash-sensitive businesses—while solvency ratios can be reviewed quarterly or annually unless major events occur, such as new debt issuance or acquisitions.
What’s a good current ratio for most businesses?
Most healthy companies maintain current ratios between 1.5 and 3.0. However, industry context is critical. Retailers with fast inventory turnover may operate at 1.2, while manufacturers with longer cycles may need 2.5 or more. Always compare against industry peers.
Can improving liquidity harm solvency?
Yes—if liquidity is improved by taking on more debt, solvency weakens. The best approach is improving liquidity through operations (faster collections, reduced inventory) rather than by borrowing simply to boost cash levels.
What happens when a company has poor solvency but good liquidity?
This situation often appears before bankruptcy. The company can cover short-term bills but carries long-term debt that is unsustainable. Over time, debt service drains cash flow, liquidity collapses, and bankruptcy becomes likely.
How do you calculate liquidity for personal finances?
Personal liquidity equals liquid assets (checking, savings, money market accounts) divided by monthly expenses. A 3–6 month emergency buffer is recommended. Personal solvency is total assets minus total debts; positive net worth indicates solvency.
Related posts:
 What Is the 3x Rent Rule & How to Calculate It (With Examples)
 Portfolio Income: Definition, Examples, Tax Rules, and Strategies
 Bookkeeping vs Accounting: What’s the Difference & Which Do You Need?
 What Is Profitability Analysis & How to Do It: Metrics, Example & Tips
 Emergency Fund vs Savings: What’s the Real Difference and Why It Matters
 Debt Service Coverage Ratio (DSCR): Formula, Meaning & Examples