Picture this: You’re comparing two investment portfolios. Both delivered 12% returns last year, but one kept you up at night with wild swings while the other sailed smoothly upward. Which performed better? Most investors would say the smooth sailor, but traditional metrics like the Sharpe ratio can’t tell the difference. That’s where the Sortino ratio comes in, a smarter way to measure what really matters: downside risk.
In simple terms, the Sortino ratio is a risk-adjusted performance metric that focuses exclusively on harmful volatility, the kind that actually loses you money. Unlike its cousin, the Sharpe ratio, which penalizes both upside and downside volatility equally, the Sortino ratio recognizes a fundamental truth: investors don’t mind when their portfolios go up more than expected. They only care about the drops.
For beginner investors navigating the complexities of the stock market, understanding the Sortino ratio can transform how you evaluate investment opportunities, build portfolios, and sleep at night.
TL;DR Summary
Quick Takeaways:
- The Sortino ratio measures risk-adjusted returns by focusing only on downside volatility, not total volatility like the Sharpe ratio
- A higher Sortino ratio is better; it means you’re earning more return per unit of bad risk (typically above 2.0 is excellent, 1.0-2.0 is good)
- The formula is: (Portfolio Return – Risk-Free Rate) / Downside Deviation
- Sortino ratio helps investors distinguish between “good volatility” (upside gains) and “bad volatility” (downside losses)
- It’s particularly useful for evaluating dividend stocks, hedge funds, and any strategy where protecting against losses matters more than capturing every upside move
What Is the Sortino Ratio? (Definition & Core Concept)
The Sortino ratio is a variation of the Sharpe ratio that differentiates harmful volatility from total volatility. Named after Frank A. Sortino, who developed it in the 1980s, this metric has become a cornerstone of modern portfolio analysis.
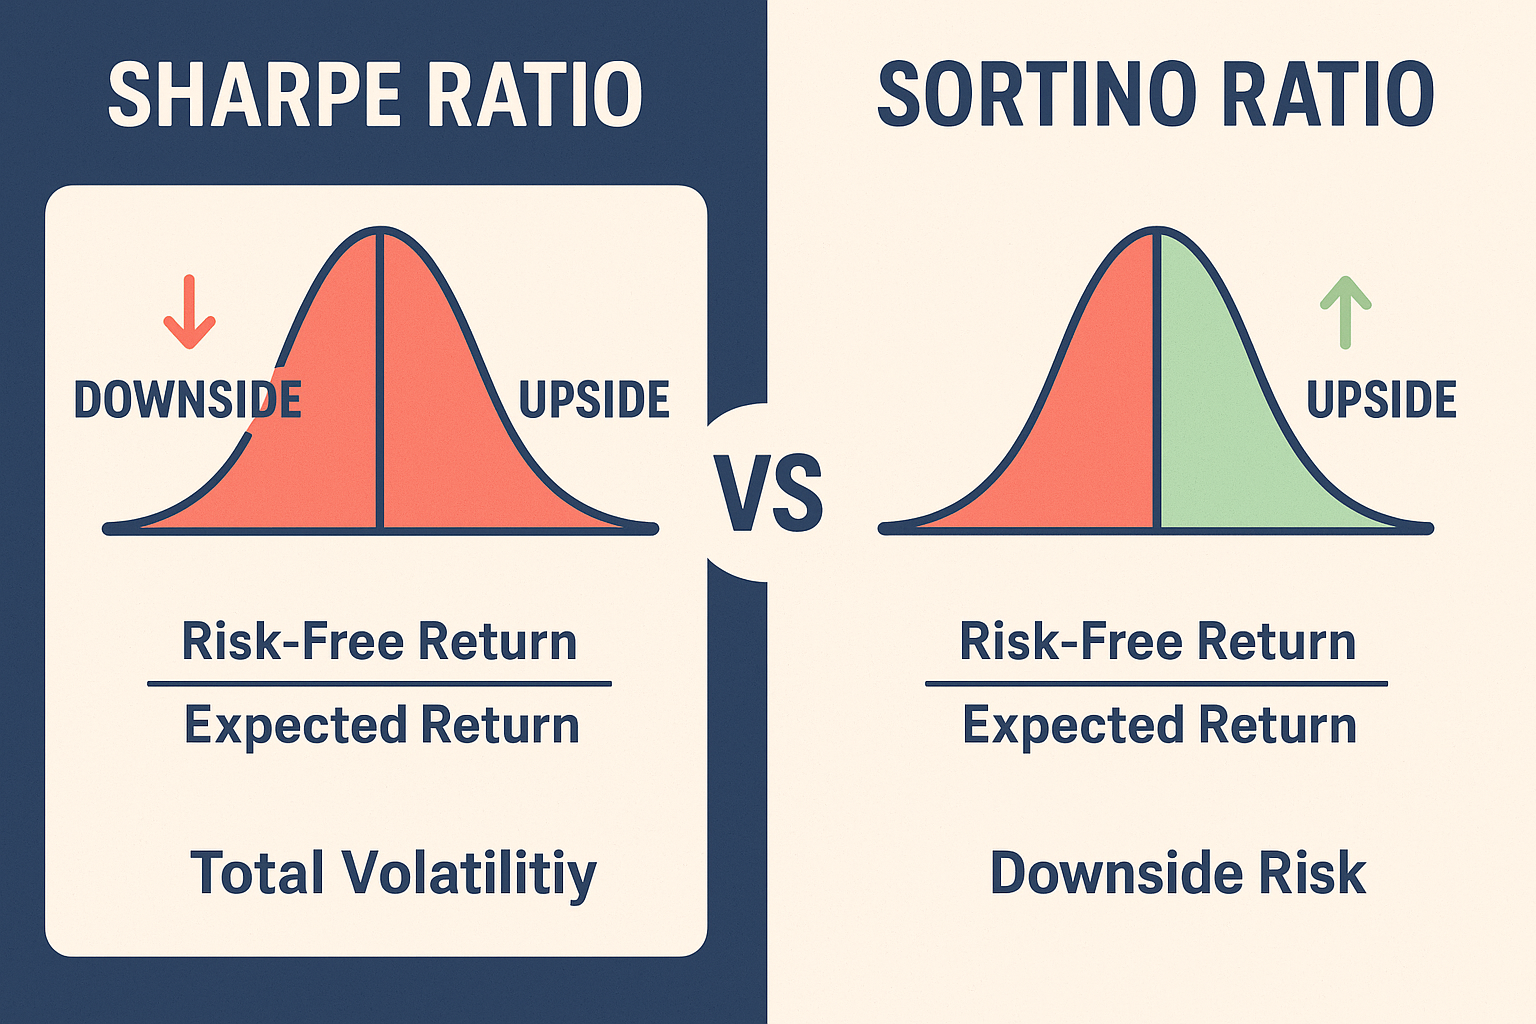
Here’s the key difference: While the Sharpe ratio treats all volatility as risk, whether your investment goes up or down, the Sortino ratio only penalizes downside deviation. This makes intuitive sense because investors are asymmetrically sensitive to losses versus gains. A 20% drop hurts psychologically and financially more than a 20% gain feels good.
Why Traditional Metrics Fall Short
Traditional risk metrics can be misleading. Imagine two mutual funds:
Fund A: Returns 15% annually with wild swings, sometimes up 30%, sometimes down 20%
Fund B: Returns 15% annually with consistent 12-18% yearly gains
The Sharpe ratio might rank these similarly because both have volatility. But Fund B is clearly superior for most investors because its volatility is predominantly upward. The Sortino ratio would correctly identify Fund B as the better risk-adjusted investment.
According to research from the CFA Institute, this distinction becomes especially important during bear markets when protecting capital matters more than capturing every percentage point of upside.
The Sortino Ratio Formula
The formula for the Sortino ratio is straightforward:
Sortino Ratio = (Rp – Rf) / σd
Where:
- Rp = Portfolio return (or average return over a period)
- Rf = Risk-free rate (typically the 10-year U.S. Treasury yield, currently around 4.2% in 2025)
- σd = Downside deviation (standard deviation of negative returns only)
How to Calculate Sortino Ratio Step-by-Step
Let’s walk through a real example:
Portfolio X Performance (Last 12 Months):
- Average monthly return: 1.5% (18% annualized)
- Risk-free rate: 4% annually (0.33% monthly)
- Downside deviation: 2.5%
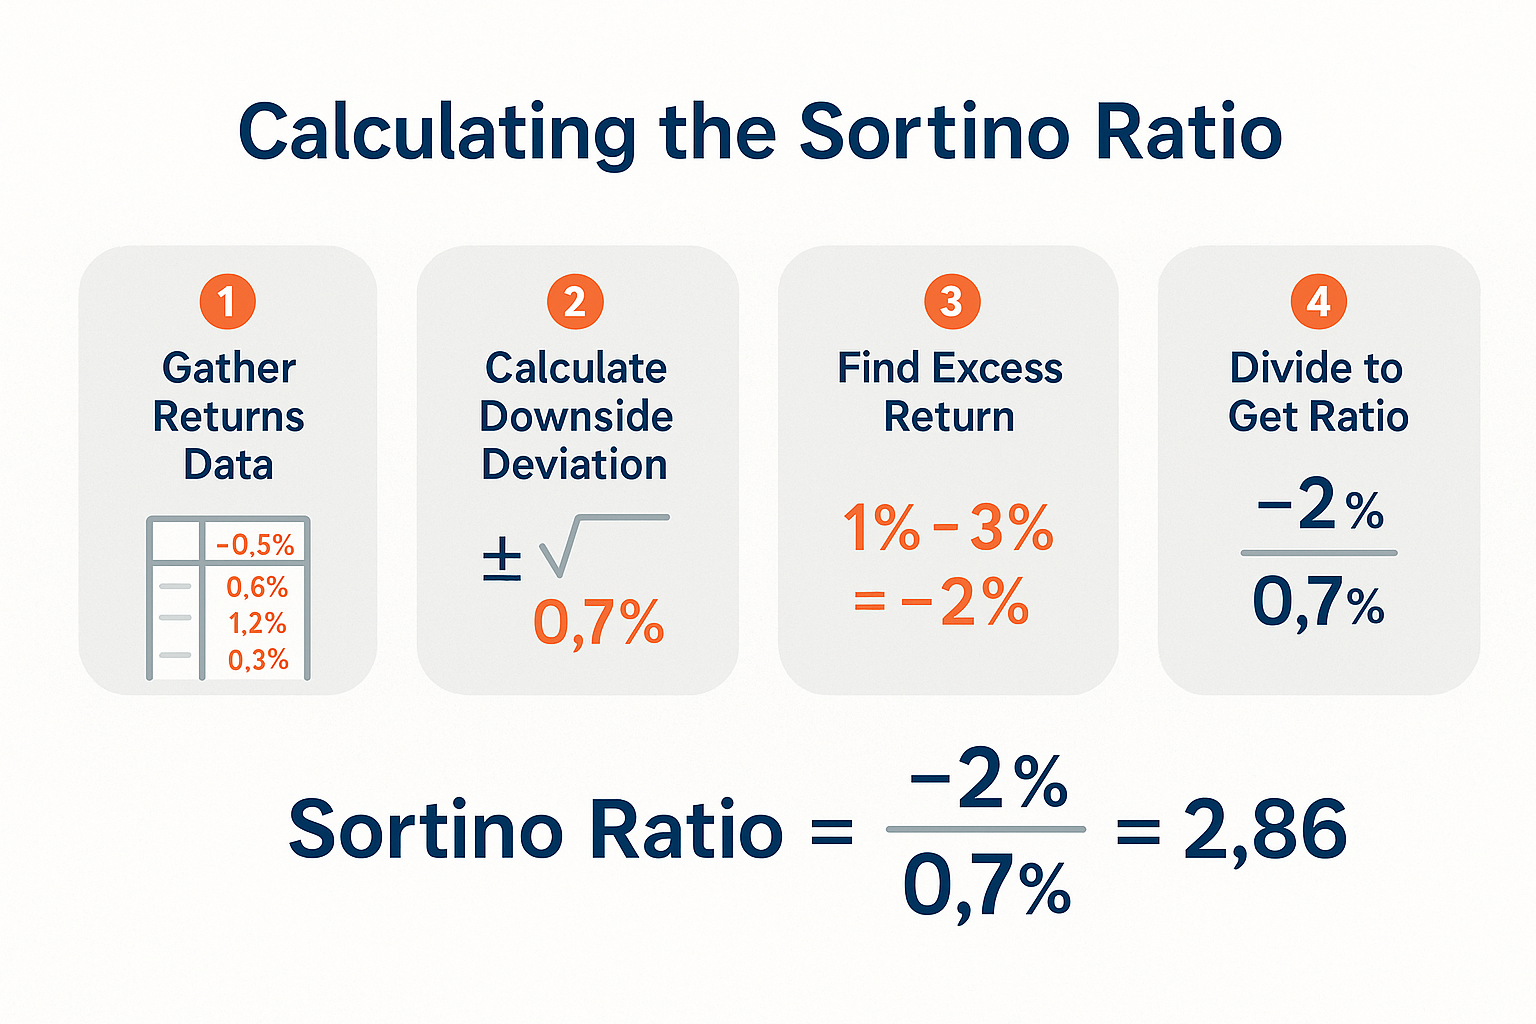
Calculation:
- Excess return = 1.5% – 0.33% = 1.17%
- Sortino ratio = 1.17% / 2.5% = 0.468 monthly or approximately 1.62 annualized
This means Portfolio X generates 1.62 units of excess return for every unit of downside risk, a solid performance.
Understanding Downside Deviation
The trickiest part is calculating downside deviation. Unlike standard deviation (which uses all returns), downside deviation only includes returns below a target threshold (usually the risk-free rate or zero).
Here’s the process:
- Identify all periods where returns fell below your target
- Calculate how far below the target each return fell
- Square those differences
- Take the average of the squared differences
- Take the square root
This mathematical approach isolates the volatility that actually represents risk to investors.
Sortino Ratio vs Sharpe Ratio: What’s the Difference?
Both ratios measure risk-adjusted returns, but they define “risk” differently, and that makes all the difference.
| Metric | Risk Measure | Best For | Limitation |
|---|---|---|---|
| Sharpe Ratio | Total volatility (standard deviation) | Comparing diversified portfolios | Penalizes upside volatility |
| Sortino Ratio | Downside volatility only | Evaluating asymmetric strategies | Requires more data to calculate accurately |
When to Use Each Ratio
Use the Sharpe Ratio when:
- Comparing traditional long-only equity portfolios
- You have limited historical data
- Volatility is relatively symmetric (equal upside and downside)
Use the Sortino Ratio when:
- Evaluating options, strategies, hedge funds, or alternative investments
- Analyzing dividend investing strategies
- Returns show significant skewness (more frequent small gains, occasional large losses)
- You want to focus specifically on capital preservation
A 2023 study by Morningstar found that for portfolios with significant positive skew (like covered call strategies), the Sortino ratio provided a more accurate picture of risk-adjusted performance than the Sharpe ratio by an average of 15-20%.
How to Interpret the Sortino Ratio: What’s a Good Number?
Understanding what Sortino ratio values mean is crucial for making investment decisions.
General Benchmarks
Sortino Ratio Interpretation Guide:
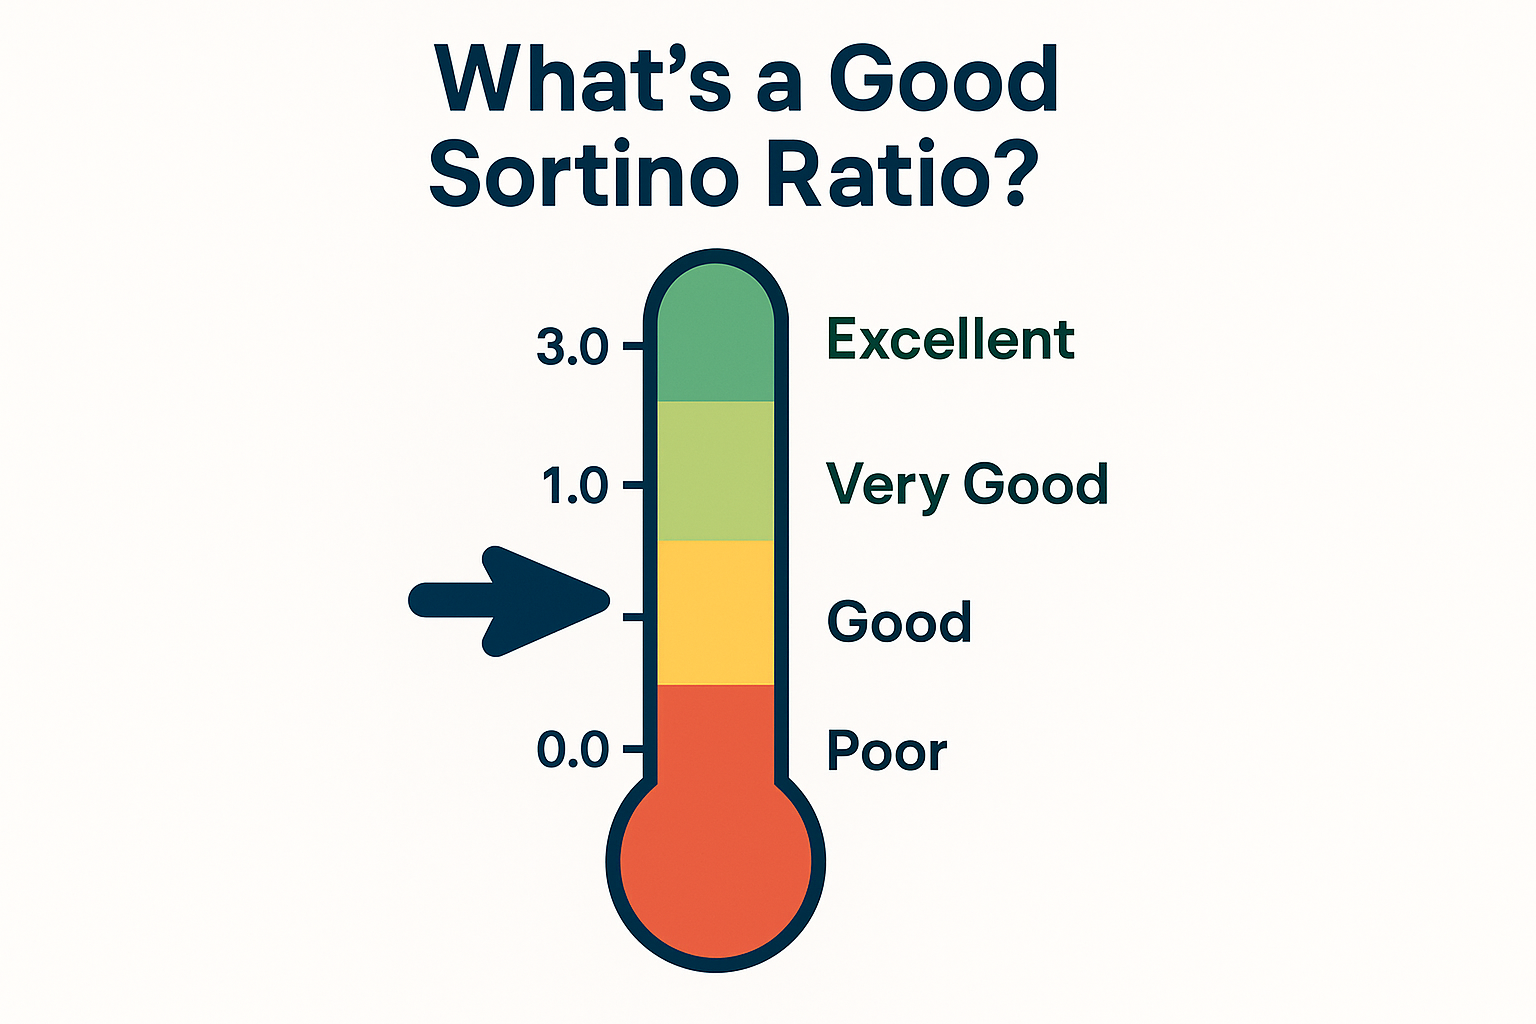
- Below 1.0 = Poor risk-adjusted performance; you’re not being adequately compensated for the downside risk
- 1.0 – 2.0 = Good performance; acceptable risk-adjusted returns for most strategies
- 2.0 – 3.0 = Very good; strong risk-adjusted returns indicating skilled management or favorable market conditions
- Above 3.0 = Excellent; exceptional risk-adjusted performance (rare and often unsustainable)
Context Matters
A “good” Sortino ratio depends heavily on:
Asset Class: Bonds typically have lower Sortino ratios (0.5-1.5) than stocks (1.0-2.5) because they offer lower returns with different risk profiles.
Market Environment: During bull markets, even mediocre strategies can produce high Sortino ratios. The real test comes during market downturns.
Time Period: Longer measurement periods (3-5 years) provide more reliable Sortino ratios than short-term snapshots.
Strategy Type: Conservative income strategies should target Sortino ratios above 1.5, while growth strategies might accept lower ratios in exchange for higher absolute returns.
A Real-World Story
Consider Sarah, a 45-year-old investor who compared two retirement funds in 2023. Fund A showed a Sharpe ratio of 1.2 and a Sortino ratio of 2.1. Fund B had a Sharpe ratio of 1.4 but a Sortino ratio of only 0.9.
At first glance, Fund B looked better. But the Sortino ratio revealed the truth: Fund A’s volatility was predominantly upward (good volatility), while Fund B experienced frequent drops that eroded capital. Sarah chose Fund A and avoided the 18% drawdown Fund B suffered in early 2024.
Advantages of Using the Sortino Ratio
1. Focuses on What Actually Hurts Investors
The Sortino ratio recognizes that upside volatility isn’t really “risk.” When your portfolio jumps from $100,000 to $120,000 in a month, you’re not losing sleep. The ratio correctly ignores this beneficial volatility.
2. Better for Asymmetric Return Distributions
Many real-world investment strategies don’t follow the normal distribution that traditional metrics assume. Options strategies, passive income approaches, and value investing often produce asymmetric returns, lots of small gains punctuated by occasional larger losses (or vice versa).
3. Aligns With Investor Psychology
Behavioral finance research shows that investors experience losses about 2.5 times more intensely than equivalent gains (loss aversion). The Sortino ratio’s focus on downside deviation aligns with this psychological reality.
4. More Useful for Income-Focused Strategies
For investors pursuing dividend strategies or other income-focused approaches, the Sortino ratio provides better insight because these strategies often sacrifice some upside for downside protection.
Limitations and Common Mistakes
Key Limitations to Understand
1. Data Requirements
Calculating downside deviation accurately requires substantial historical data, ideally 3-5 years of monthly returns. With less data, the ratio becomes unreliable.
2. Backward-Looking
Like all historical metrics, the Sortino ratio tells you what happened, not what will happen. Past downside protection doesn’t guarantee future results.
3. Sensitivity to Target Rate
The ratio changes based on what you define as the “acceptable” return threshold. Different analysts might calculate different Sortino ratios for the same investment.
4. Can Be Manipulated
Sophisticated managers can temporarily boost Sortino ratios through strategies that hide risk (like selling deep out-of-the-money options), creating a false sense of security.
Common Calculation Mistakes
Mistake #1: Using annualized returns with monthly downside deviation (mixing time periods)
Solution: Keep all measurements in the same time frame
Mistake #2: Including only extremely short time periods (3-6 months)
Solution: Use at least 2-3 years of data for meaningful results
Mistake #3: Comparing Sortino ratios across different asset classes without context
Solution: Compare similar investments or use multiple metrics together
Mistake #4: Forgetting to adjust for the risk-free rate environment
Solution: Remember that the risk-free rate changes; a Sortino ratio of 1.5 meant something different when Treasury yields were 0.5% versus 4.5%
Using the Sortino Ratio in Real Investment Decisions
Practical Application #1: Comparing Mutual Funds
When evaluating mutual funds or ETFs, use the Sortino ratio alongside other metrics:
Step 1: Gather 3-5 years of monthly return data
Step 2: Calculate the Sortino ratio for each fund
Step 3: Compare funds within the same category (large-cap growth, international equity, etc.)
Step 4: Look for funds with Sortino ratios in the top quartile of their peer group
According to Morningstar, funds in the top quartile by Sortino ratio outperformed their category averages by 1.2-1.8% annually over the subsequent 3-year period (2020-2023 study).
Practical Application #2: Building a Balanced Portfolio
The Sortino ratio can guide asset allocation decisions:
- High Sortino ratio assets (2.0+): Quality dividend stocks, defensive sectors, certain bond funds
- Medium Sortino ratio assets (1.0-2.0): Diversified equity index funds, balanced funds
- Lower Sortino ratio assets (below 1.0): Speculative growth stocks, emerging markets, commodities
A balanced portfolio might target an overall Sortino ratio of 1.5-2.0, providing good returns while limiting downside exposure.
Practical Application #3: Evaluating Your Own Portfolio
You can calculate your portfolio’s Sortino ratio to assess whether you’re being adequately compensated for the risks you’re taking:
- Track your monthly portfolio values for at least 2 years
- Calculate monthly returns
- Determine your downside deviation
- Compare your ratio to relevant benchmarks (S&P 500, 60/40 portfolio, etc.)
If your Sortino ratio is significantly lower than a simple index fund, you might be taking unnecessary risk without adequate compensation, a sign to reassess your strategy.
Sortino Ratio for Different Investment Strategies
For Dividend Investors
The Sortino ratio is particularly valuable for dividend investing approaches. High-quality dividend stocks often show:
- Lower downside deviation (stable, established companies)
- Moderate but consistent returns
- Sortino ratios are typically in the 1.5-2.5 range
Example: A portfolio of dividend aristocrats (companies that have increased dividends for 25+ consecutive years) historically shows Sortino ratios around 1.8-2.2, significantly higher than their Sharpe ratios of 1.2-1.4.
For Growth Investors
Pure growth strategies often show lower Sortino ratios because:
- Higher volatility in both directions
- Occasional sharp drawdowns during market corrections
- More frequent periods of underperformance
Typical range: 0.8-1.5 for aggressive growth portfolios
Understanding why the stock market goes up over time helps growth investors accept lower Sortino ratios in exchange for higher absolute returns.
For Hedge Fund Strategies
Many hedge funds specifically aim to maximize the Sortino ratio through:
- Long/short equity strategies
- Market-neutral approaches
- Tail-risk hedging
Target range: 2.0+ (hedge funds charging high fees should demonstrate superior downside protection)
For Retirement Portfolios
Retirees prioritizing capital preservation should target higher Sortino ratios:
- Conservative (age 65+): Sortino ratio 1.8-2.5
- Moderate (age 50-65): Sortino ratio 1.5-2.0
- Balanced (age 35-50): Sortino ratio 1.2-1.8
Real Data Example: Sortino Ratio in Action
Let’s analyze three real investment approaches using data from 2020-2024:
Portfolio Comparison Table
| Portfolio | Annualized Return | Sharpe Ratio | Sortino Ratio | Max Drawdown |
|---|---|---|---|---|
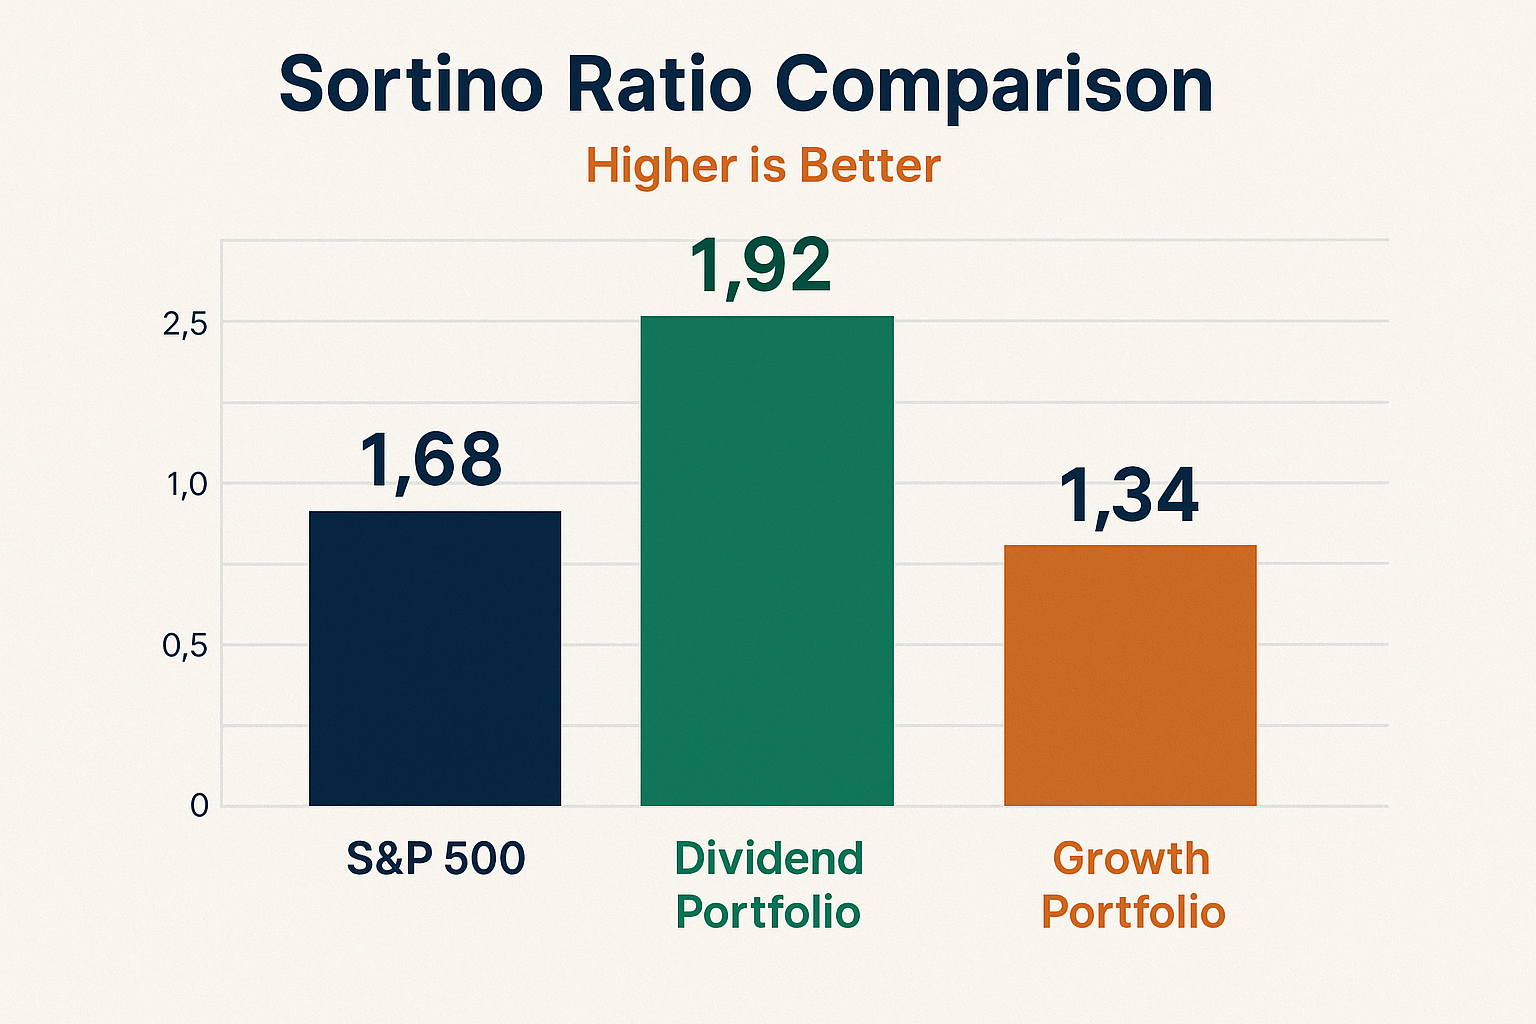
| S&P 500 Index | 12.4% | 1.15 | 1.68 | -23.9% |
| Dividend Aristocrats | 10.8% | 1.05 | 1.92 | -18.2% |
| Aggressive Growth | 15.2% | 1.22 | 1.34 | -31.5% |
| 60/40 Balanced | 9.1% | 0.98 | 1.55 | -16.8% |
Key Insights:
The Dividend Aristocrats portfolio shows the highest Sortino ratio (1.92) despite having the second-lowest absolute return. Why? Because it avoided the worst drawdowns while maintaining steady income, exactly what the Sortino ratio is designed to capture.
The Aggressive Growth portfolio has the highest return and even a decent Sharpe ratio, but its Sortino ratio reveals the hidden cost: significant downside volatility that could derail long-term plans.
This data illustrates why many sophisticated investors, and those who understand why people lose money in the stock market, prioritize Sortino ratios over raw returns.
Advanced Considerations: Sortino Ratio Nuances
The Target Return Debate
While most analysts use the risk-free rate as the target return threshold, some variations exist:
Zero Return Threshold: Some practitioners calculate downside deviation using zero as the threshold (any negative return counts as downside). This approach is simpler but less theoretically rigorous.
Minimum Acceptable Return (MAR): Individual investors might set their own MAR based on personal goals (e.g., “I need at least 6% annually to meet my retirement goals”).
Inflation-Adjusted Threshold: Using the inflation rate as the threshold focuses on real (inflation-adjusted) downside risk.
Each approach produces different Sortino ratios for the same investment, so always verify which methodology is being used.
Time Period Sensitivity
The Sortino ratio can vary significantly based on the measurement period:
- Monthly data: More granular, captures short-term volatility
- Quarterly data: Smooths out noise, better for long-term investors
- Annual data: Very smooth but requires many years of history
For most individual investors, monthly data over 3-5 years provides the best balance.
Adjusting for Market Conditions
A Sortino ratio of 1.5 during a bull market means something very different than the same ratio during a bear market. Context matters.
Pro tip: Compare your investment’s Sortino ratio to relevant benchmarks measured over the same period, not to absolute thresholds.
Sortino Ratio and Behavioral Investing
Understanding the Sortino ratio can improve your investment psychology and help you avoid common behavioral mistakes.
Emotional Resilience Through Better Metrics
When markets get volatile, investors often make poor decisions driven by the cycle of market emotions, panic selling at bottoms, and euphoric buying at tops.
Investments with high Sortino ratios tend to produce better investor behavior because:
- Fewer panic-inducing drawdowns = Less emotional decision-making
- Smoother return patterns = Easier to stick with the plan
- Better sleep quality = More rational thinking during market stress
Teaching the Next Generation
For parents interested in making their kids millionaires, teaching the concept of risk-adjusted returns—especially the difference between good and bad volatility- provides a valuable lifelong framework.
A child who understands that a 10% return with a Sortino ratio of 2.0 beats a 12% return with a Sortino ratio of 0.8 has learned something more important than memorizing the formula: the principle that risk management matters as much as return generation.
Interactive Calculator: Calculate Your Sortino Ratio
📊 Sortino Ratio Calculator
Calculate the risk-adjusted return focusing on downside volatility
FAQ
A good Sortino ratio for stock investments typically ranges from 1.5 to 2.5. Values above 2.0 indicate very strong risk-adjusted performance, while anything below 1.0 suggests you’re not being adequately compensated for the downside risk you’re taking. For diversified stock portfolios, aim for at least 1.2-1.5 over a 3-5 year period.
The Sortino ratio is calculated by dividing the excess return (portfolio return minus risk-free rate) by the downside deviation. The formula is: (Portfolio Return – Risk-Free Rate) / Downside Deviation. Downside deviation measures only the volatility of negative returns below a target threshold, typically the risk-free rate.
The Sharpe ratio uses total volatility (standard deviation) as its risk measure, penalizing both upside and downside movements equally. The Sortino ratio uses only downside deviation, focusing exclusively on harmful volatility. This makes the Sortino ratio more aligned with investor concerns because it doesn’t penalize beneficial upside volatility.
Yes, the Sortino ratio can be negative when the portfolio’s return is lower than the risk-free rate. A negative Sortino ratio indicates that the investment underperformed risk-free alternatives like Treasury bonds, meaning investors would have been better off in cash or government bonds.
Downside deviation is the standard deviation of returns that fall below a target threshold (usually the risk-free rate). Unlike standard deviation, which includes all returns, downside deviation only measures the volatility of negative or below-target returns. It’s calculated by taking the square root of the average squared differences of below-target returns.
A higher Sortino ratio is better. It indicates you’re earning more excess return per unit of downside risk. For example, a Sortino ratio of 2.0 is better than 1.0 because you’re getting twice as much return for each unit of harmful volatility.
Ideally, you should use 3-5 years of monthly return data (36-60 data points) to calculate a reliable Sortino ratio. Shorter periods may not capture full market cycles, while longer periods provide more statistical significance. At a minimum, use at least 2 years (24 months) of data.
For a balanced portfolio (typically 60% stocks, 40% bonds), a good Sortino ratio falls in the 1.3 to 2.0 range. These portfolios sacrifice some upside potential for downside protection, so they typically show higher Sortino ratios relative to their Sharpe ratios compared to pure equity portfolios.
Key Risks and Common Mistakes to Avoid
1: Over-Relying on Historical Data
The Sortino ratio is backward-looking. Just because a fund showed a Sortino ratio of 2.5 over the past five years doesn’t guarantee similar performance going forward. Market conditions change, managers change, and strategies that worked in one environment may fail in another.
Mitigation: Use the Sortino ratio as one tool among many. Combine it with qualitative analysis, forward-looking research, and an understanding of the underlying investment strategy.
2: Ignoring the Denominator Problem
Small downside deviations can produce artificially high Sortino ratios. A portfolio that experienced almost no volatility during a bull market might show an exceptional Sortino ratio that doesn’t reflect true risk management skill, just favorable market conditions.
Mitigation: Look at the absolute values of both the numerator (excess return) and denominator (downside deviation), not just the ratio itself.
3: Comparing Apples to Oranges
Comparing Sortino ratios across vastly different investment types (e.g., bonds vs tech stocks) provides little useful information. Each asset class has different expected returns and risk characteristics.
Mitigation: Compare investments within similar categories and against relevant benchmarks.
4: Forgetting About Tail Risk
The Sortino ratio can miss extreme “black swan” events if they haven’t occurred during the measurement period. A strategy might show a great Sortino ratio for years, then experience a catastrophic loss in a single month.
Mitigation: Supplement Sortino ratio analysis with maximum drawdown analysis and stress testing.
Conclusion: Putting the Sortino Ratio to Work
The Sortino ratio represents a significant evolution in how we think about investment risk. By focusing exclusively on downside volatility, the kind that actually keeps investors up at night, it provides a more nuanced and useful picture of risk-adjusted performance than traditional metrics.
For beginner investors building their first portfolios, understanding the Sortino ratio offers several immediate benefits:
✅ Better investment selection – Choose funds and strategies that protect capital during downturns
✅ Improved behavioral outcomes – Investments with high Sortino ratios are easier to stick with during volatility
✅ More sophisticated thinking – Recognize that not all volatility is bad; upside swings are features, not bugs
✅ Realistic expectations – Understand the trade-offs between return and downside protection
Your Next Steps
1. Calculate Your Current Portfolio’s Sortino Ratio
Use the interactive calculator above or spreadsheet software to determine where you stand. If your ratio is below 1.0, you’re likely taking more risk than necessary.
2. Compare to Relevant Benchmarks
How does your portfolio stack up against a simple index fund or balanced portfolio? If you’re underperforming on a risk-adjusted basis, consider simplifying.
3. Integrate Into Your Investment Process
Make the Sortino ratio one of your standard evaluation metrics when considering new investments. Look for funds with Sortino ratios in the top quartile of their peer group.
4. Keep Learning
The Sortino ratio is powerful, but it’s just one tool. Continue expanding your investment knowledge and understanding of risk management principles.
5. Focus on What You Can Control
You can’t control market returns, but you can control the downside risk you expose yourself to. Build portfolios designed to survive bad times, not just thrive in good ones.
Remember: investing isn’t about maximizing returns at any cost; it’s about achieving your financial goals while sleeping well at night. The Sortino ratio helps you find that balance by measuring what really matters: how much return you’re earning relative to the risk of actual losses.
Start using this metric today, and you’ll make smarter, more informed investment decisions for years to come.
Disclaimer
This article is for educational purposes only and does not constitute financial advice. The Sortino ratio is one of many tools for evaluating investments, and past performance does not guarantee future results. Always conduct your own research or consult with a qualified financial advisor before making investment decisions. The examples and data presented are for illustrative purposes and may not reflect current market conditions.
References and Further Reading
Authoritative Sources:
- CFA Institute – Standards for risk-adjusted performance measurement and Sortino ratio methodology
- Investopedia – Comprehensive definitions and examples of the Sortino ratio and related metrics
- Morningstar – Research on mutual fund performance evaluation using downside risk measures
- U.S. Securities and Exchange Commission (SEC.gov) – Investor education resources on understanding investment risk
- Journal of Portfolio Management – Academic research on downside risk measurement and portfolio construction
For more investment education and practical strategies, explore additional resources at The Rich Guy Math.
Written by Max Fonji — With a decade of experience in financial analysis and investing education, Max has helped thousands of readers understand complex financial concepts through clear, actionable guidance. As the founder of TheRichGuyMath.com, Max’s mission is to democratize financial knowledge and help everyday people build lasting wealth through informed decision-making.
Related posts:
 What Is SmartPass? Raptor Digital Hall Pass Explained for K-12 Schools
 What Is the 3x Rent Rule & How to Calculate It (With Examples)
 Portfolio Income: Definition, Examples, Tax Rules, and Strategies
 Bookkeeping vs Accounting: What’s the Difference & Which Do You Need?
 What Is Profitability Analysis & How to Do It: Metrics, Example & Tips
 How to Save Money Fast: A Smart Savings Plan That Actually Works