Imagine you’re running a lemonade stand that’s doing really well. You want to grow bigger—maybe add more stands in different neighborhoods. But here’s the million-dollar question: How fast can you grow without running out of money or needing to borrow from your parents? This exact challenge faces every business, from small startups to Fortune 500 companies. The answer lies in understanding the Sustainable Growth Rate (SGR)—a powerful financial metric that tells you the maximum speed at which a company can grow using only its own profits, without taking on additional debt or issuing new stock.
Whether you’re an aspiring investor trying to understand what investing is all about or a business owner planning your next move, mastering the Sustainable Growth Rate will give you a crystal-clear picture of realistic growth expectations. Let’s dive into this essential concept and break it down in plain English.
TL;DR
- Sustainable Growth Rate (SGR) measures the maximum growth rate a company can achieve using only retained earnings, without raising external capital or increasing debt.
- The basic SGR formula is: SGR = ROE × (1 – Dividend Payout Ratio), where ROE represents return on equity and the retention ratio shows what percentage of profits are reinvested.
- SGR helps investors identify companies with realistic growth plans and spot red flags when actual growth significantly exceeds sustainable levels.
- Companies growing faster than their SGR must either take on debt, issue new shares, or improve operational efficiency to fund expansion.
- SGR has limitations—it assumes constant financial ratios and doesn’t account for external factors like market conditions, competitive dynamics, or management changes.
What Is Sustainable Growth Rate?
In simple terms, Sustainable Growth Rate means the maximum rate at which a company can expand its sales, earnings, and dividends using only the profits it keeps and reinvests in the business.
Think of SGR as your company’s natural speed limit. Just like a car has a maximum safe speed based on its engine and design, every business has a maximum growth rate based on its profitability and how much money it puts back into operations.
The Sustainable Growth Rate answers a fundamental question for stock market investors: Can this company keep growing at its current pace without needing outside money?
Why SGR Matters for Investors
Understanding SGR is crucial because:
- Reality Check: It separates ambitious projections from achievable goals
- Financial Health Indicator: Companies consistently growing faster than their SGR may be accumulating dangerous levels of debt
- Dividend Sustainability: It shows whether a company can maintain or increase dividends while still growing
- Investment Decision Tool: Helps identify undervalued companies with strong internal growth capacity
According to research published by the CFA Institute, companies that grow at rates significantly exceeding their sustainable growth rate often face financial distress within 3-5 years unless they successfully raise capital or dramatically improve margins.
The Sustainable Growth Rate Formula
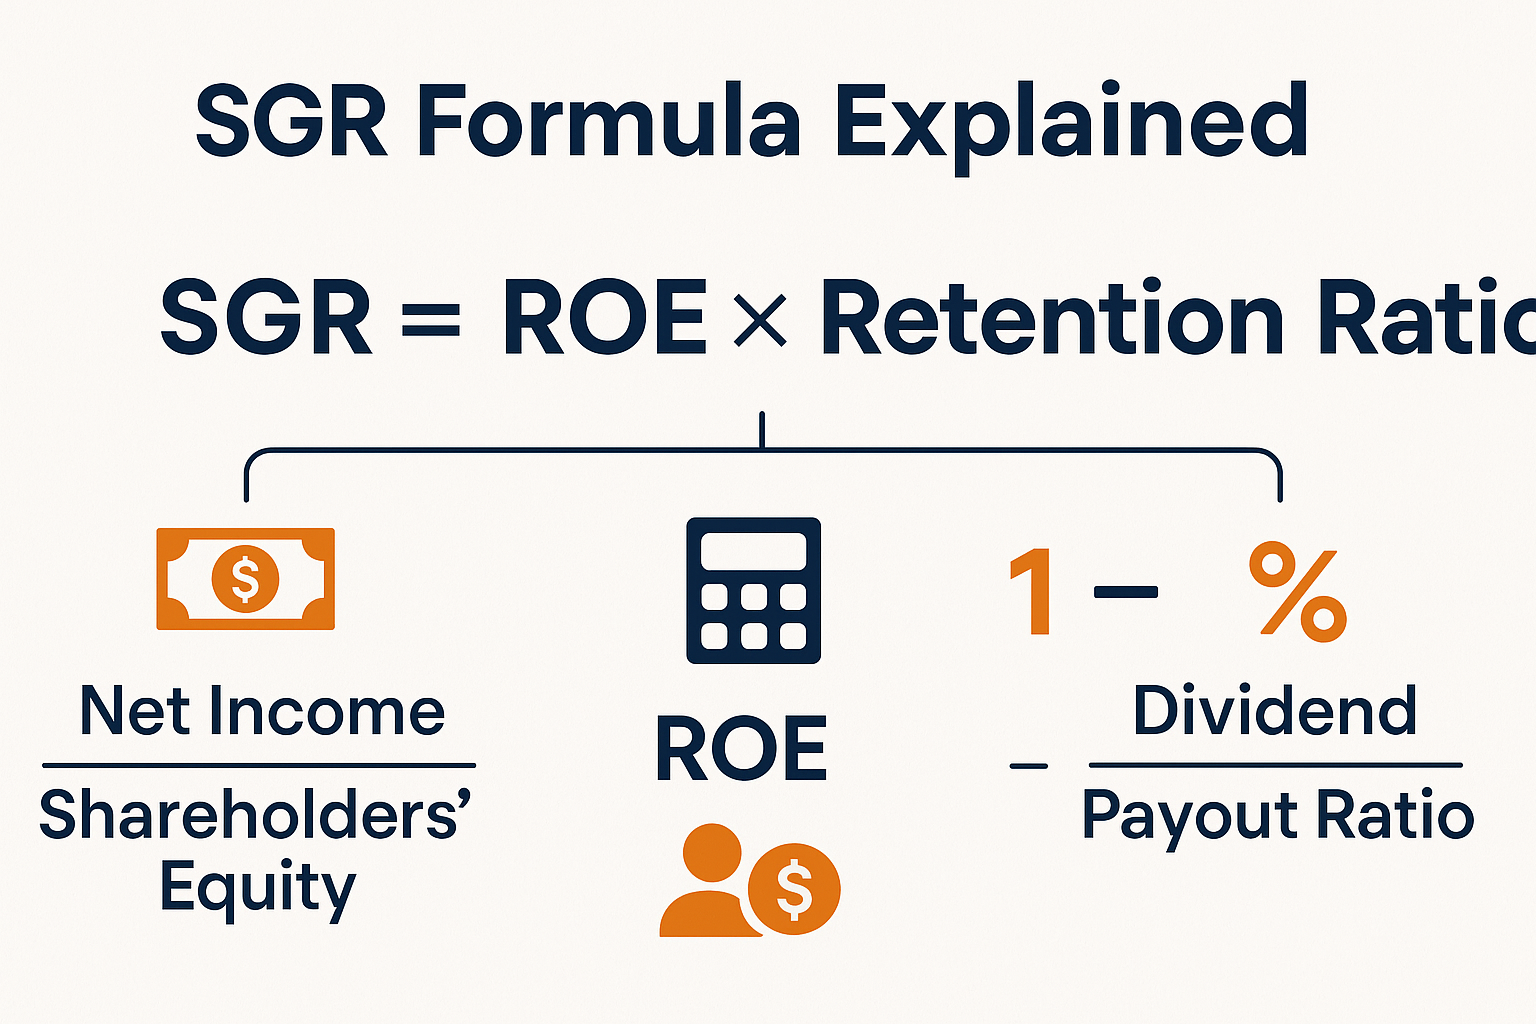
The formula for Sustainable Growth Rate is:
SGR = ROE × Retention Ratio
Or written another way:
SGR = ROE × (1 – Dividend Payout Ratio)
Let’s break down each component:
Return on Equity (ROE)
ROE measures how efficiently a company generates profit from shareholder equity.
ROE Formula: ROE = Net Income ÷ Shareholders’ Equity
A higher Return On Equity means the company is better at turning invested capital into profits. For example, if a company has $100 million in equity and generates $15 million in net income, its ROE is 15%.
Retention Ratio (or Plowback Ratio)
The retention ratio shows what percentage of earnings the company keeps to reinvest in the business rather than paying out as dividends.
Retention Ratio = 1 – Dividend Payout Ratio
Or:
Retention Ratio = (Net Income – Dividends) ÷ Net Income
If a company earns $10 million and pays out $4 million in dividends, it retains $6 million, giving it a retention ratio of 60% (or 0.60).
Alternative SGR Formula
Some analysts use an expanded version that breaks down ROE into its components:
SGR = (Profit Margin × Asset Turnover × Equity Multiplier × Retention Ratio)
This version uses the DuPont analysis framework and provides more detailed insight into what drives sustainable growth.
Step-by-Step SGR Calculation Example
Let’s calculate the Sustainable Growth Rate for a fictional company called TechGrow Inc.
TechGrow Inc. Financial Data (2025):
| Financial Metric | Amount |
|---|---|
| Net Income | $20 million |
| Shareholders’ Equity | $100 million |
| Total Dividends Paid | $6 million |
| Sales Revenue | $200 million |
Step 1: Calculate ROE
ROE = Net Income ÷ Shareholders’ Equity
ROE = $20 million ÷ $100 million = 0.20 or 20%
Step 2: Calculate Retention Ratio
Retention Ratio = (Net Income – Dividends) ÷ Net Income
Retention Ratio = ($20 million – $6 million) ÷ $20 million = $14 million ÷ $20 million = 0.70 or 70%
Step 3: Calculate SGR
SGR = ROE × Retention Ratio
SGR = 0.20 × 0.70 = 0.14 or 14%
What This Means
TechGrow Inc. can sustainably grow at 14% per year without needing to:
- Borrow additional money
- Issue new shares
- Change its dividend policy
- Improve its operational efficiency
If TechGrow wants to grow faster than 14%, it must either:
- Reduce dividend payments (increase retention ratio)
- Improve profitability (increase ROE)
- Take on debt
- Issue new equity
Real-World Example: Comparing Two Companies
Let’s compare two real companies to see how SGR works in practice:
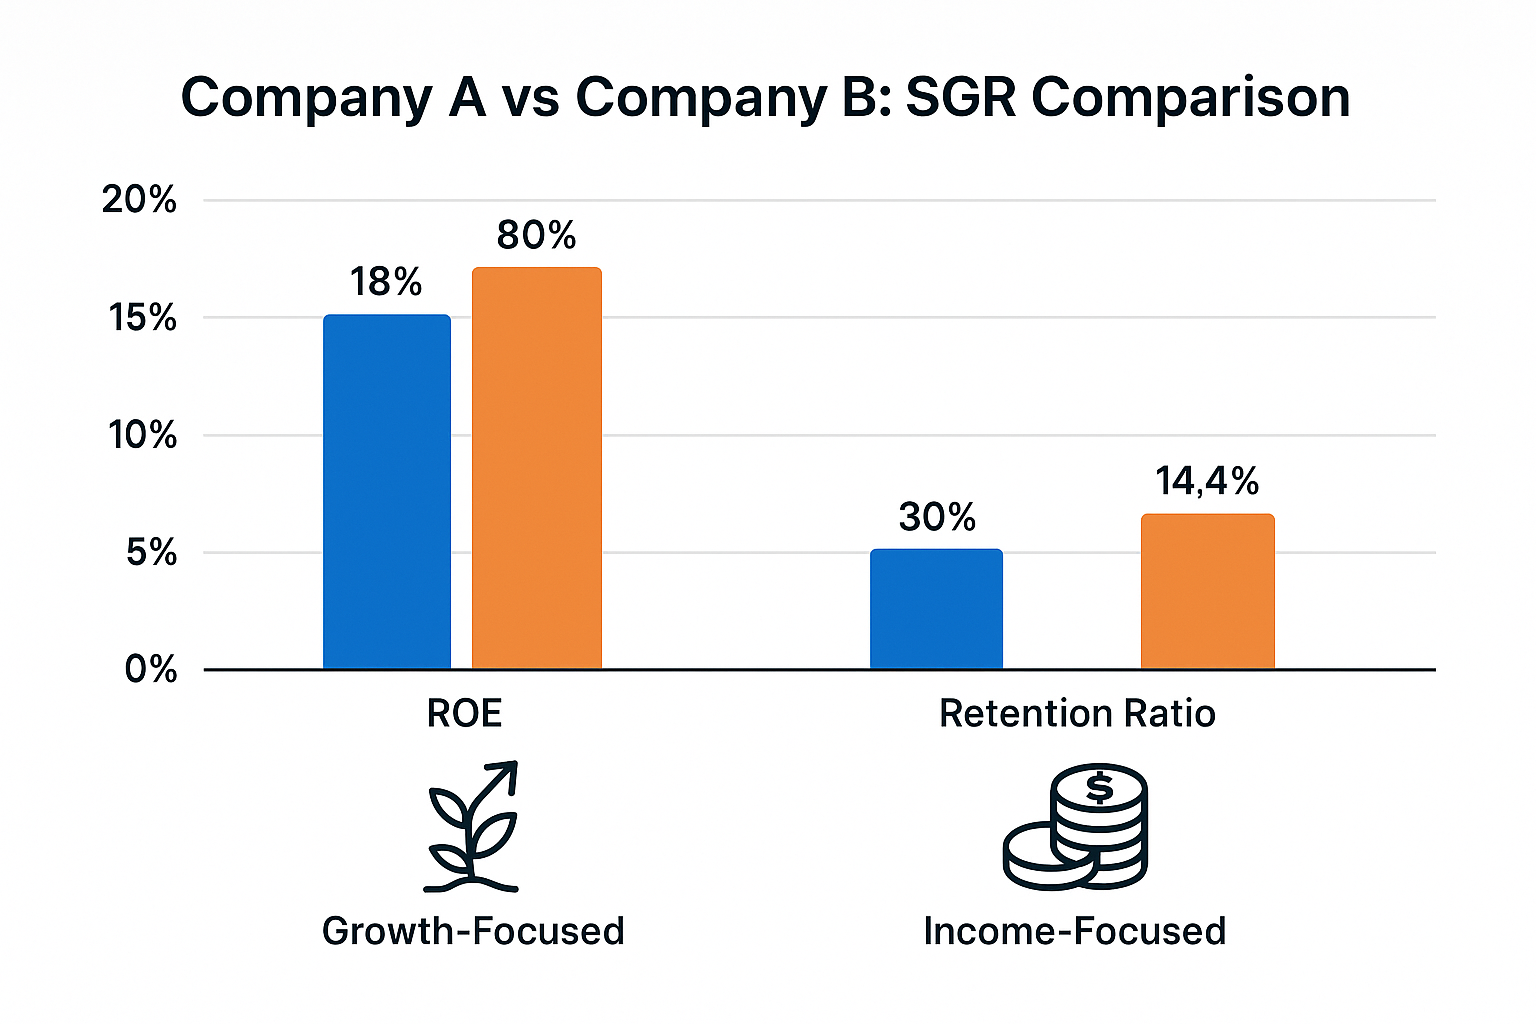
| Metric | Company A (Growth Focus) | Company B (Income Focus) |
|---|---|---|
| ROE | 18% | 15% |
| Dividend Payout Ratio | 20% | 70% |
| Retention Ratio | 80% | 30% |
| Sustainable Growth Rate | 14.4% | 4.5% |
Company A keeps most of its profits to fuel expansion, resulting in a higher SGR. This company appeals to growth investors who want stock market appreciation.
Company B pays most earnings as dividends, limiting its sustainable growth but providing steady income. This appeals to investors interested in earning passive income through dividend investing.
Neither approach is inherently better—it depends on the investor’s goals and the company’s stage of development.
How to Use SGR in Investment Decisions
1. Compare Actual Growth to SGR
A higher actual growth rate than SGR usually indicates the company is funding growth through debt or equity issuance.
This isn’t always bad, but it requires investigation:
- Is the debt level manageable?
- Are new shares diluting existing shareholders?
- Is the growth profitable or just revenue expansion?
2. Identify Value Opportunities
Companies with high SGR but low market valuations may represent buying opportunities. If a company can sustainably grow at 15% but trades at a modest price-to-earnings ratio, it might be undervalued.
3. Assess Dividend Safety
For those seeking high dividend stocks, SGR helps evaluate whether dividends are sustainable. If a company pays out 90% of earnings (10% retention ratio) but needs to grow at 10% to remain competitive, the math doesn’t work—dividends may be at risk.
4. Evaluate Management Effectiveness
Comparing SGR over time shows whether management is improving capital efficiency. Rising SGR suggests better profitability or smarter capital allocation.
📈 Sustainable Growth Rate Calculator
Calculate how fast your company can grow using retained earnings
Advantages of Using Sustainable Growth Rate
1. Simple and Intuitive
Unlike complex financial models, SGR uses just two readily available metrics: ROE and retention ratio. Anyone can calculate it with basic financial statements.
2. Reveals Capital Efficiency
SGR shows how well a company converts retained earnings into growth. High SGR companies are capital-efficient powerhouses.
3. Highlights Dividend Trade-offs
The formula makes the relationship between dividends and growth explicit. Investors can see exactly how dividend policy affects expansion capacity.
4. Early Warning System
When actual growth significantly exceeds SGR for extended periods, it signals potential financial stress ahead—either rising debt levels or equity dilution.
5. Useful Across Industries
SGR works for comparing companies in different sectors, though interpretation varies by industry norms and growth stages.
Limitations of Sustainable Growth Rate
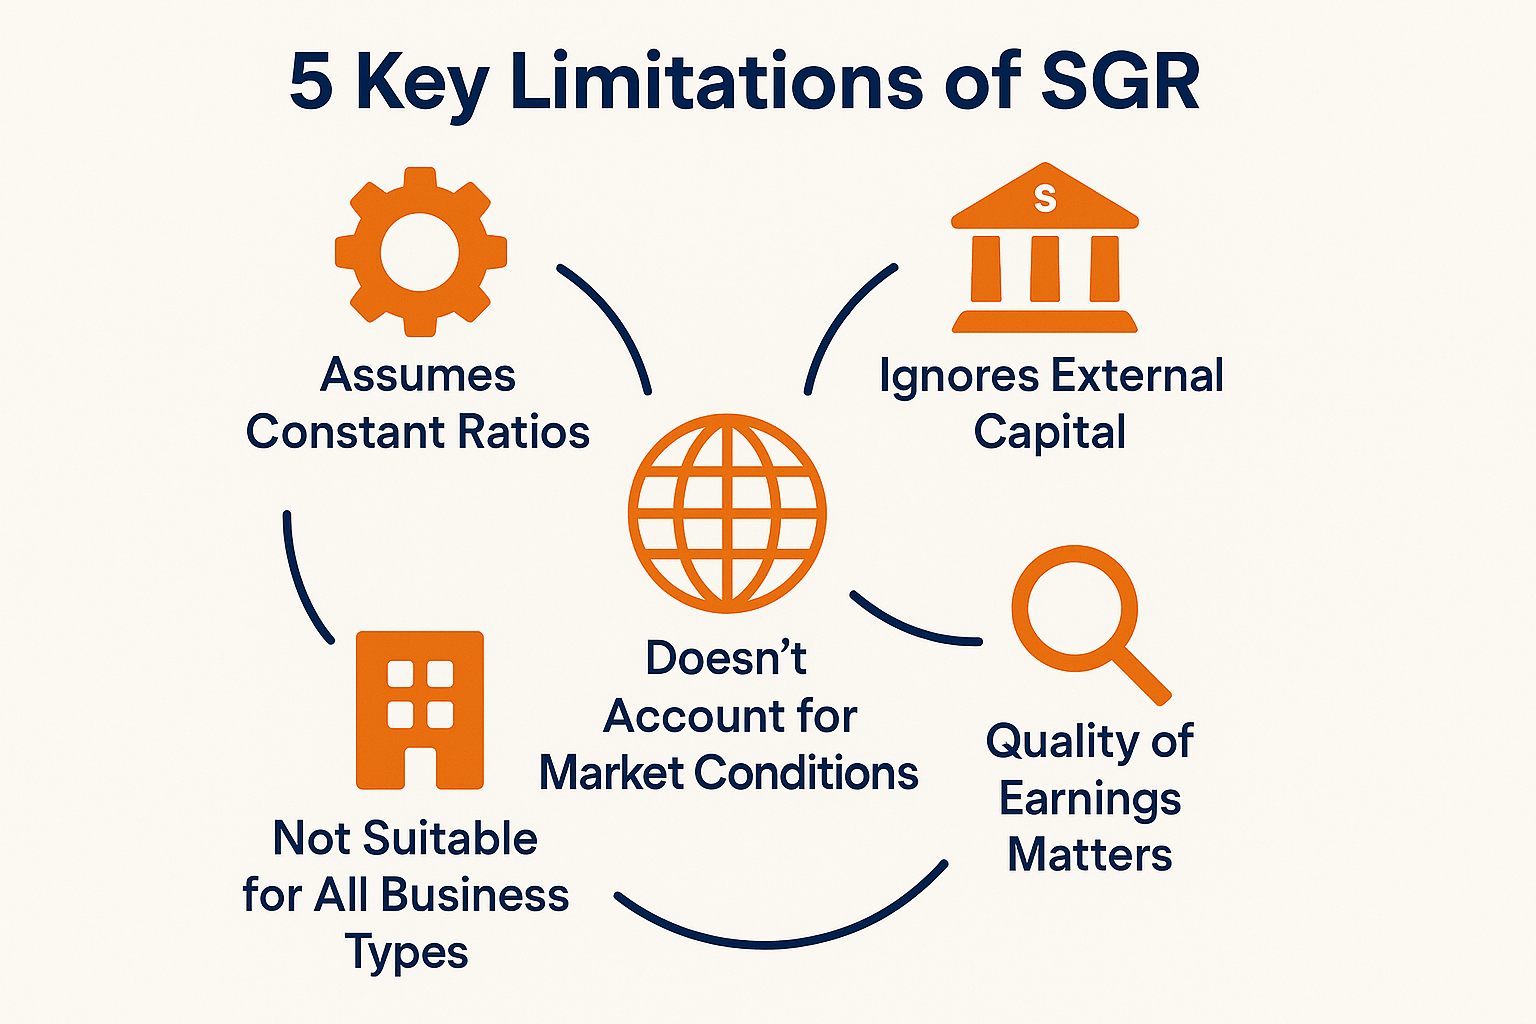
1. Assumes Constant Financial Ratios
The biggest weakness: SGR assumes ROE, profit margins, asset turnover, and financial leverage remain constant. In reality, these metrics fluctuate constantly.
A company improving operational efficiency can grow faster than its historical SGR suggests. Conversely, deteriorating margins can make even modest SGR targets unachievable.
2. Ignores External Capital Sources
SGR only considers retained earnings, ignoring that many successful companies strategically use debt or equity financing to accelerate growth. Amazon, for instance, grew far beyond its SGR by accessing capital markets and created tremendous shareholder value.
3. Doesn't Account for Market Conditions
SGR is an internal metric that ignores external factors:
- Economic recessions
- Industry disruption
- Competitive dynamics
- Regulatory changes
- Market volatility
Understanding what moves the stock market is an essential context that SGR doesn't provide.
4. Quality of Earnings Matters
A company can have high ROE (and therefore high SGR) due to:
- Accounting tricks
- Excessive leverage
- Unsustainable competitive advantages
- One-time gains
Always look beyond the numbers to understand why ROE is what it is.
5. Not Suitable for All Business Types
SGR works best for mature, profitable companies with stable operations. It's less useful for:
- Startups Often have negative earnings
- Turnaround situations: Historical metrics don't reflect future potential
- Cyclical businesses: SGR varies dramatically with economic cycles
- Asset-light businesses: May grow rapidly with minimal capital reinvestment
6. Ignores Share Buybacks
Modern companies increasingly return cash to shareholders through buybacks rather than dividends. SGR doesn't distinguish between these approaches, though buybacks can enhance per-share growth metrics differently than dividends.
Sustainable Growth Rate vs Other Growth Metrics
Sustainable Growth Rate vs. Internal Growth Rate
Internal Growth Rate (IGR) measures maximum growth using only retained earnings, assuming zero external financing of any kind—no debt and no equity.
IGR = (ROA × Retention Ratio) ÷ (1 - ROA × Retention Ratio)
Where ROA = Return on Assets
IGR is more conservative than SGR because it doesn't allow for any increase in debt levels, even if the company maintains its target debt-to-equity ratio.
Sustainable Growth Rate vs. Actual Growth Rate
| Metric | What It Measures | Key Insight |
|---|---|---|
| Sustainable Growth Rate | Maximum growth using retained earnings only | Internal capacity without external funding |
| Actual Growth Rate | Real revenue or earnings growth achieved | What actually happened |
| Comparison | Actual vs. SGR | Reveals funding gap or efficiency gains |
When actual growth exceeds SGR, investigate:
- Has the company taken on debt?
- Did it issue new shares?
- Did ROE improve?
- Was the retention ratio increased?
Common Mistakes When Using Sustainable Growth Rate
Mistake #1: Using SGR as a Standalone Metric
SGR should be one tool among many. Combine it with:
- Cash flow analysis
- Debt levels and trends
- Competitive positioning
- Management quality assessment
- Industry growth rates
Mistake #2: Assuming Higher SGR Is Always Better
A 30% SGR sounds impressive, but if it's driven by an 80% debt-to-equity ratio (high financial leverage boosting ROE), it's risky. Quality matters more than quantity.
Mistake #3: Ignoring Industry Context
A 5% SGR might be excellent for a mature utility company, but concerning for a technology startup. Compare companies to industry peers, not across sectors.
Mistake #4: Forgetting About Growth Quality
Revenue growth means nothing if it's unprofitable. Always check whether growth translates to earnings and cash flow.
Mistake #5: Not Updating Assumptions
Calculate SGR periodically as financial ratios change. Last year's SGR may not reflect current capacity.
How to Improve a Company's Sustainable Growth Rate
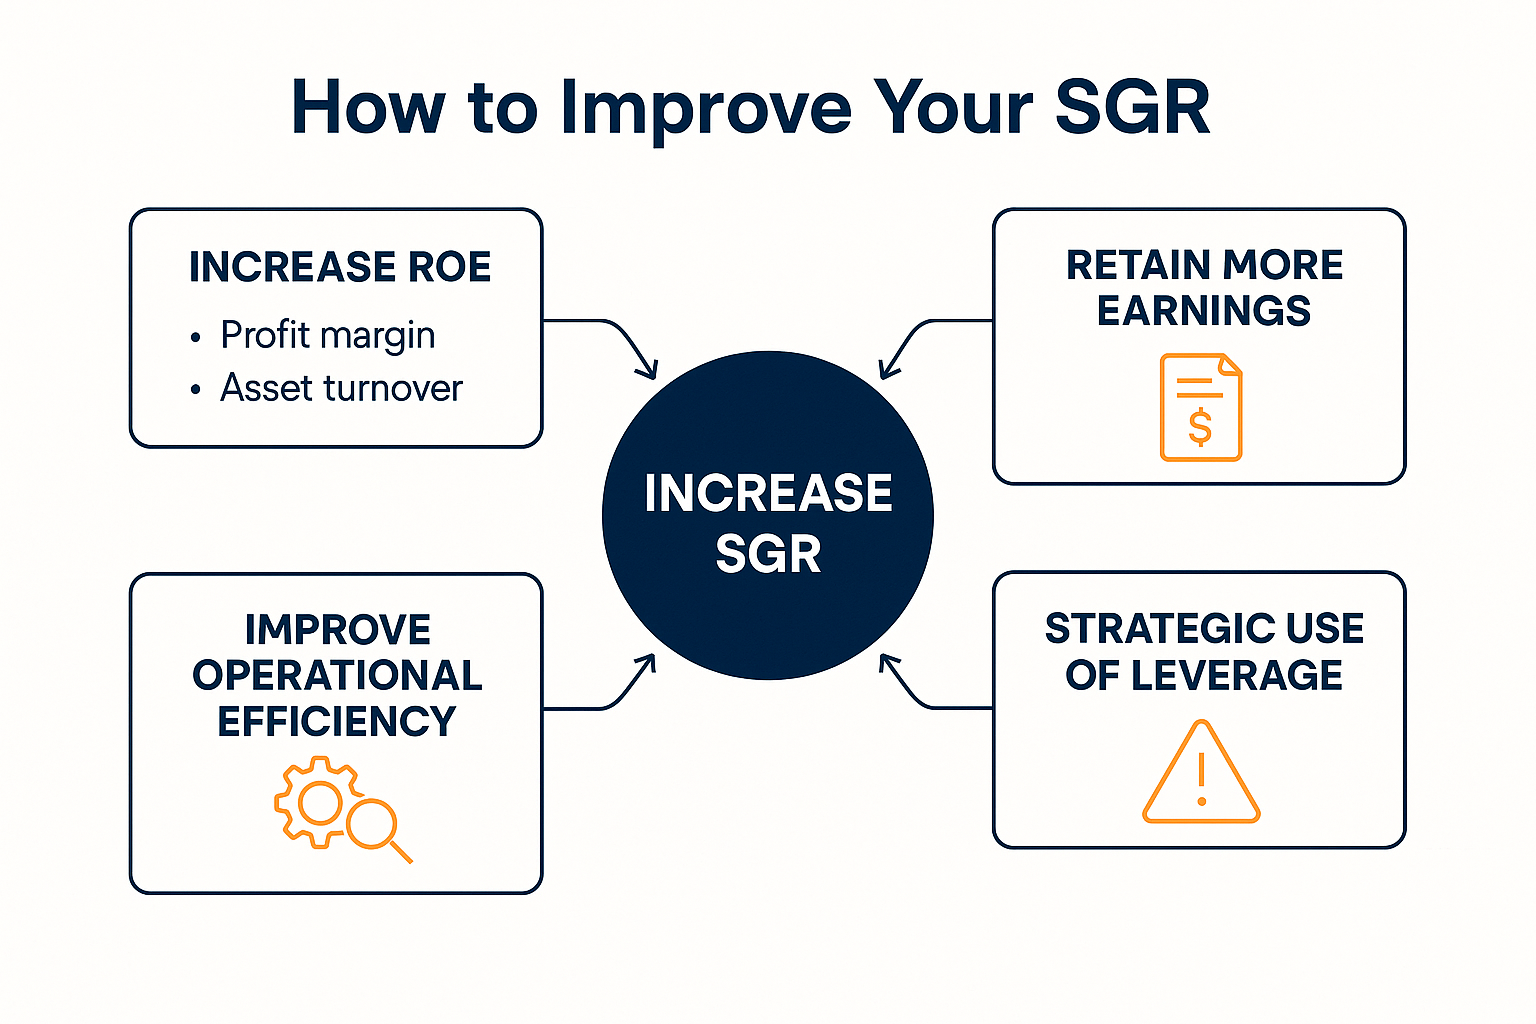
For business owners and managers, here are strategies to increase SGR:
1. Increase ROE
Since SGR = ROE × Retention Ratio, boosting ROE directly increases sustainable growth. Improve ROE by:
- Improving profit margins: Cut costs, increase prices, or improve product mix
- Increasing asset turnover: Generate more sales from existing assets
- Optimizing financial leverage: Use debt strategically (but carefully)
2. Retain More Earnings
Reduce dividend payout to retain more capital for reinvestment. This works if:
- Growth opportunities offer better returns than shareholders could get elsewhere
- The company can deploy capital effectively
- Shareholders understand and support the strategy
3. Improve Operational Efficiency
Better inventory management, faster collections, and streamlined operations free up cash for growth without changing reported ROE or retention ratios.
4. Strategic Use of Leverage
While not technically part of "sustainable" growth, prudent use of debt can fund expansion when internal resources fall short. The keyword is prudent—excessive debt creates financial fragility.
Real-World Data: Sustainable Growth Rate Across Industries (2025)
Different industries have vastly different sustainable growth rates based on capital intensity, profitability, and business models:
| Industry | Typical ROE | Typical Retention Ratio | Approximate SGR Range |
|---|---|---|---|
| Technology (Software) | 20-30% | 80-100% | 16-30% |
| Consumer Staples | 15-25% | 40-60% | 6-15% |
| Utilities | 8-12% | 30-50% | 2-6% |
| Financial Services | 10-15% | 50-70% | 5-10% |
| Healthcare | 12-18% | 60-80% | 7-14% |
| Retail | 15-20% | 50-70% | 7-14% |
Source: Analysis based on S&P 500 sector data and industry reports from Morningstar and Bloomberg
Technology companies typically have the highest SGR because they combine high ROE with high retention (low dividend payout). Many tech companies pay no dividends at all, reinvesting everything into R&D and expansion.
Utilities have low SGR because they're mature, capital-intensive businesses that pay out most earnings as dividends to income-focused investors.
This is why understanding why the stock market goes up requires looking beyond single metrics to broader economic and business factors.
Using Sustainable Growth Rate to Find Investment Opportunities
Strategy 1: High SGR + Low Valuation
Look for companies with:
- SGR above 12%
- Price-to-earnings ratio below industry average
- Consistent profitability
- Strong competitive position
This combination suggests the market may be undervaluing the company's growth capacity.
Strategy 2: SGR Improvement Trend
Companies showing rising SGR over 3-5 years demonstrate:
- Improving profitability
- Better capital allocation
- Strengthening competitive position
This trend often precedes stock price appreciation.
Strategy 3: Actual Growth Below SGR
When a quality company grows slower than its SGR, it may be:
- Building cash reserves for a strategic acquisition
- Waiting for better growth opportunities
- Undervalued by the market
- Facing temporary headwinds
This can represent a buying opportunity if the fundamentals remain strong.
For more investment strategies, explore these smart moves for building wealth.
Sustainable Growth Rate in Different Business Stages
Startup Phase
- Often negative or undefined (no profits yet)
- SGR is less relevant; focus on revenue growth and the path to profitability
- External funding essential
Growth Phase
- Rising SGR as profitability improves
- High retention ratios (minimal or no dividends)
- May still need external capital to fund rapid expansion
- Actual growth often exceeds SGR
Mature Phase
- Stable, predictable SGR
- Balanced dividend policy
- Actual growth typically aligns with SGR
- Focus shifts to capital efficiency
Decline Phase
- Falling SGR due to decreasing ROE
- May increase dividends (lower retention) as growth opportunities diminish
- SGR becomes less relevant as the company focuses on cash generation
Practical Tips for Investors
1: Calculate SGR Yourself
Don't rely on third-party calculations. Get financial data from company reports or the SEC's EDGAR database (sec.gov) and calculate SGR yourself to ensure accuracy.
2: Look at 5-Year Trends
One year's SGR can be misleading. Calculate SGR for the past 5 years to see whether the company's growth capacity is improving, stable, or declining.
3: Compare to Management Guidance
If management projects 20% annual growth but SGR is only 10%, ask:
- How will they fund the gap?
- Is the projection realistic?
- What assumptions are they making?
4: Use SGR for Portfolio Diversification
Balance your portfolio with:
- High-SGR growth companies
- Moderate-SGR dividend payers
- Low-SGR income generators
This approach aligns with creating smart ways to make passive income through diversification.
5: Monitor Debt Levels
If actual growth consistently exceeds SGR, check whether debt is rising. Sustainable debt-fueled growth requires that returns on new investments exceed borrowing costs.
Key Risks and Red Flags
1: Persistent Gap Between Actual and Sustainable Growth
If a company grows at 25% for years while SGR is 10%, eventually something must give:
- Debt becomes unsustainable
- Equity dilution frustrates shareholders
- Growth quality deteriorates
- Financial stress emerges
2: Declining ROE with Maintained Dividends
When ROE falls but the company maintains high dividend payouts, SGR drops rapidly. This combination can't continue indefinitely—either dividends get cut or growth stalls.
3: Artificially Inflated ROE
Be wary of high ROE driven by:
- Excessive leverage: Debt-to-equity ratios above industry norms
- Share buybacks reducing equity: Can boost ROE mechanically without improving operations
- One-time gains: Non-recurring items inflate net income
Always read the notes to financial statements to understand what's driving the numbers.
4: Industry Disruption
Historical SGR becomes meaningless if the industry faces disruption. A company with 15% SGR means nothing if its business model becomes obsolete.
Conclusion: Making Sustainable Growth Rate Work for You
The Sustainable Growth Rate is a powerful yet simple tool that reveals how fast a company can realistically grow using only its own profits. By understanding the relationship between profitability (ROE) and capital retention, investors gain crucial insight into whether growth targets are achievable or require external funding.
Key takeaways to remember:
- SGR = ROE × Retention Ratio – this simple formula tells you maximum growth without external capital
- Compare actual growth to SGR to identify funding gaps or efficiency improvements
- Use SGR alongside other metrics – never rely on a single number for investment decisions
- Understand the limitations – SGR assumes constant ratios and ignores external factors
- Context matters – interpret SGR relative to industry norms and business stage
Your Next Steps
For Investors:
- Calculate SGR for companies in your portfolio or watchlist
- Compare to actual growth rates over the past 3-5 years
- Investigate significant gaps between actual and sustainable growth
- Use SGR as one factor in a comprehensive investment analysis
- Consider how SGR fits with your investment goals (growth vs. income)
For Business Owners:
- Calculate your company's current SGR
- Identify which levers (ROE or retention ratio) offer the most improvement potential
- Set realistic growth targets aligned with sustainable capacity
- Plan financing needs if growth targets exceed SGR
- Monitor trends to ensure sustainable growth remains achievable
For Continued Learning:
- Explore related concepts like Return on Equity, retention ratios, and capital structure
- Study how successful companies have managed growth over time
- Read company annual reports to see how management discusses growth strategies
- Consider taking courses on financial statement analysis and corporate finance
Remember, sustainable growth isn't just about how fast you can grow—it's about growing at a pace that builds long-term value without creating financial fragility. Whether you're investing in the stock market or running a business, understanding your sustainable growth rate helps you make smarter, more informed decisions.
The companies that consistently create wealth aren't always the fastest growers—they're the ones that grow sustainably, efficiently, and profitably over long periods. Master the Sustainable Growth Rate, and you'll have a valuable tool for identifying these wealth-building opportunities.
References and Further Reading
- U.S. Securities and Exchange Commission (SEC): Access company financial statements and filings at sec.gov
- CFA Institute: Research on sustainable growth and corporate finance best practices
- Morningstar: Industry-specific financial data and analysis
- Investopedia: Comprehensive financial education resources on growth metrics
- Federal Reserve Economic Data (FRED): Economic indicators and industry trends
FAQ: Sustainable Growth Rate
A "good" SGR depends on the industry and company stage. Generally, 10-15% is strong for mature companies, while growth companies may target 20%+ SGR. Compare to industry peers rather than using absolute benchmarks.
The formula for Sustainable Growth Rate is: SGR = ROE × (1 - Dividend Payout Ratio). Calculate ROE by dividing net income by shareholders' equity, then multiplying by the percentage of earnings retained (not paid as dividends).
Yes, if a company has a negative ROE (losing money), its SGR will be negative, indicating it's shrinking rather than growing. This signals financial distress unless it's a temporary situation for a startup or turnaround company.
A company growing faster than its SGR must obtain external financing—either debt, new equity, or both. This isn't inherently bad if the capital is deployed profitably, but it increases financial risk and may dilute existing shareholders.
Not necessarily. Very high SGR often comes from high financial leverage or zero dividend payout, both of which carry risks. Quality of growth matters more than quantity. A sustainable 12% SGR with moderate risk often beats a 25% SGR built on excessive debt.
SGR shows the trade-off between dividends and growth. Companies paying high dividends have lower retention ratios, reducing SGR. For dividend investors, look for companies where SGR still allows for modest growth while maintaining attractive dividend yields.
SGR alone doesn't predict stock prices, but it helps identify companies with realistic growth capacity. Combined with valuation metrics and qualitative analysis, it improves investment decision-making. Understanding broader stock market dynamics is equally important.
Disclaimer: This article is for educational purposes only and does not constitute financial advice. The Sustainable Growth Rate is one analytical tool among many, and investment decisions should be based on comprehensive research, personal financial circumstances, and consultation with qualified financial professionals. Past performance does not guarantee future results. All investments carry risk, including potential loss of principal.
Written by Max Fonji — with a decade of experience in financial analysis and investing education, Max is your go-to source for clear, data-backed investing insights. Max specializes in breaking down complex financial concepts into actionable strategies that help everyday investors build wealth confidently.
For more investing guides and financial education, visit our blog and explore additional resources on building wealth through smart financial decisions.