Your 20s are the most powerful decade for wealth creation you’ll ever have—not because you earn the most, but because time itself becomes your greatest asset. Most financial advice tells you to save more, spend less, and invest early. But few explain the actual mathematics that turn modest contributions into life-changing wealth. The difference between someone who starts building wealth at 23 versus 33 isn’t just ten years—it’s often hundreds of thousands of dollars in final net worth.
This guide breaks down the precise formulas, behavioral patterns, and strategic frameworks that separate those who build substantial wealth in their 20s from those who spend decades playing catch-up. Understanding the real math behind compounding, asset allocation, and cash flow management transforms wealth-building from vague aspiration into a predictable outcome.
Key Takeaways
- Time amplifies returns exponentially: Starting to invest at 25 instead of 35 can result in 2-3x more wealth by retirement due to compound growth
- Your savings rate matters more than investment returns early on: In your first decade of investing, how much you save has a greater impact than market performance
- Small percentage differences compound dramatically: A 7% versus 10% annual return over 40 years turns $10,000 into either $150,000 or $450,000
- Wealth-building follows predictable mathematical patterns: Understanding these formulas allows you to forecast and optimize your financial trajectory
- Behavioral consistency beats market timing: Regular contributions through all market conditions historically outperform attempts to time entry points
Why Your 20s Are a Mathematical Advantage
Building wealth in your 20s isn’t about having more money—it’s about having more time. The mathematics of compound growth creates a nonlinear relationship between time and wealth accumulation. This means each additional year of early investing produces disproportionate results. See our full guide wealth
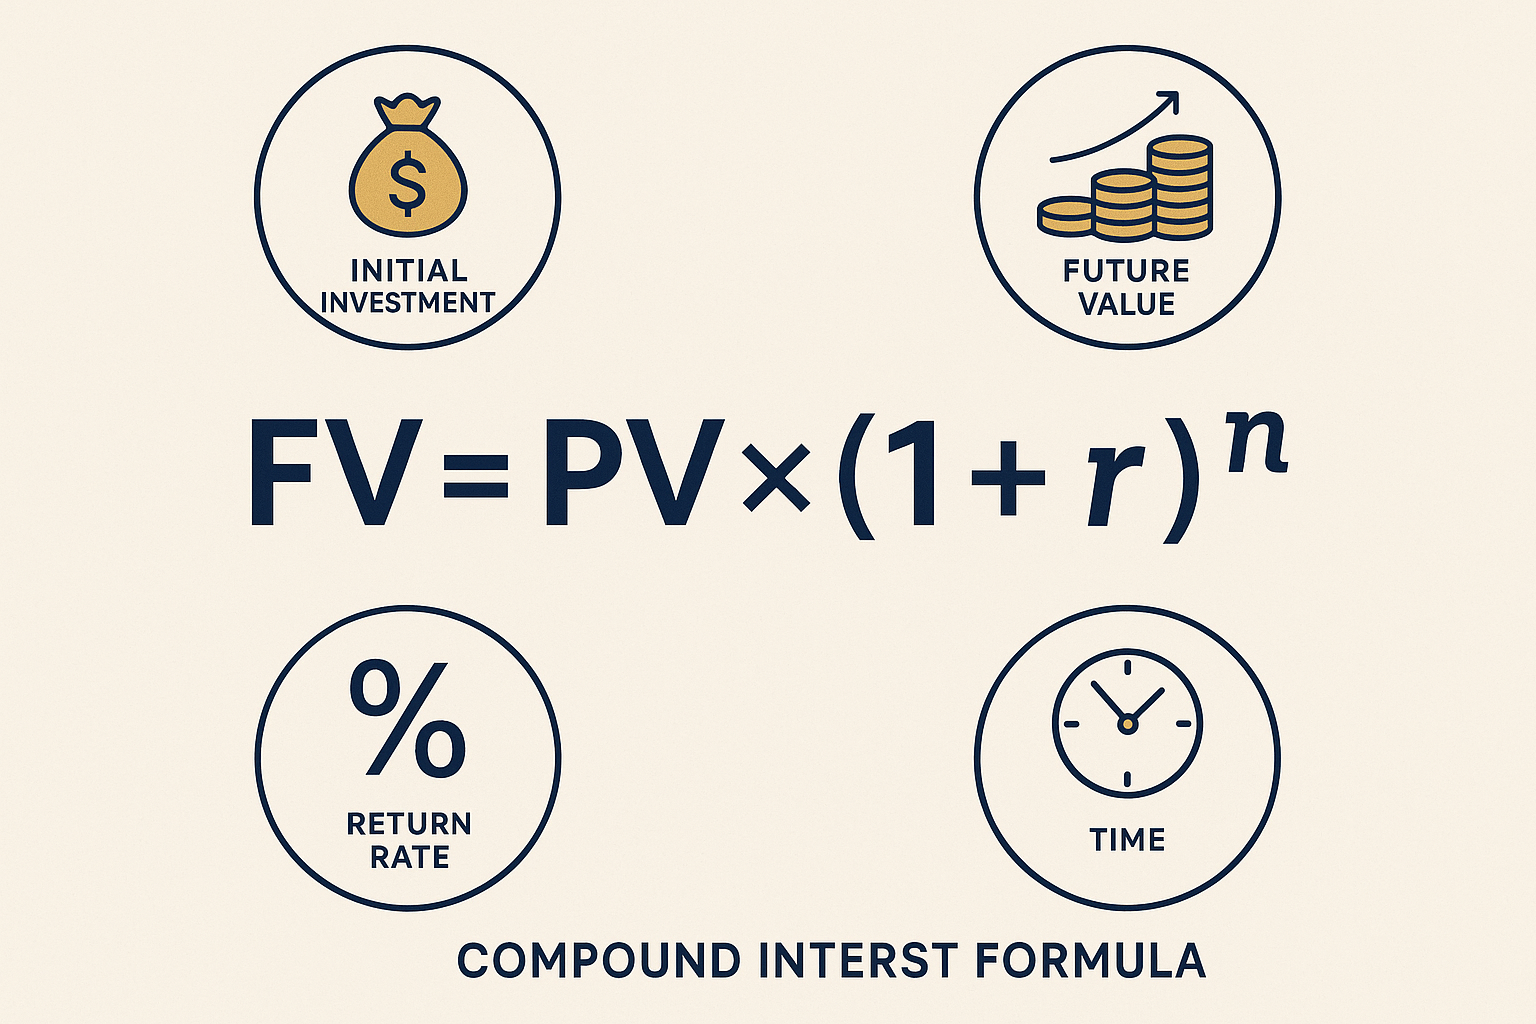
Consider the fundamental compound interest formula:
FV = PV × (1 + r)^n
Where:
- FV = Future Value
- PV = Present Value
- r = Rate of return
- n = Number of periods
The exponent (n) represents time. As this number increases, the effect becomes exponential rather than linear. This is why starting at 25 versus 35 doesn’t just give you 10% more wealth—it often doubles or triples your outcome.
The Rule of 72: Quick Mental Math for Doubling
The Rule of 72 provides instant insight into how long money takes to double:
Years to Double = 72 ÷ Annual Return Rate
At a 7% return, your money doubles every 10.3 years. Starting at age 25, a $10,000 investment doubles approximately four times by age 65, growing to $160,000. Start at 35, and you get only three doublings—just $80,000. Same contribution, half the result.
Insight: The mathematical power of your 20s lies not in earning more, but in accessing more doubling periods.
The Actual Numbers: What Building Wealth Looks Like
Let’s examine real scenarios using verifiable mathematics rather than motivational platitudes.
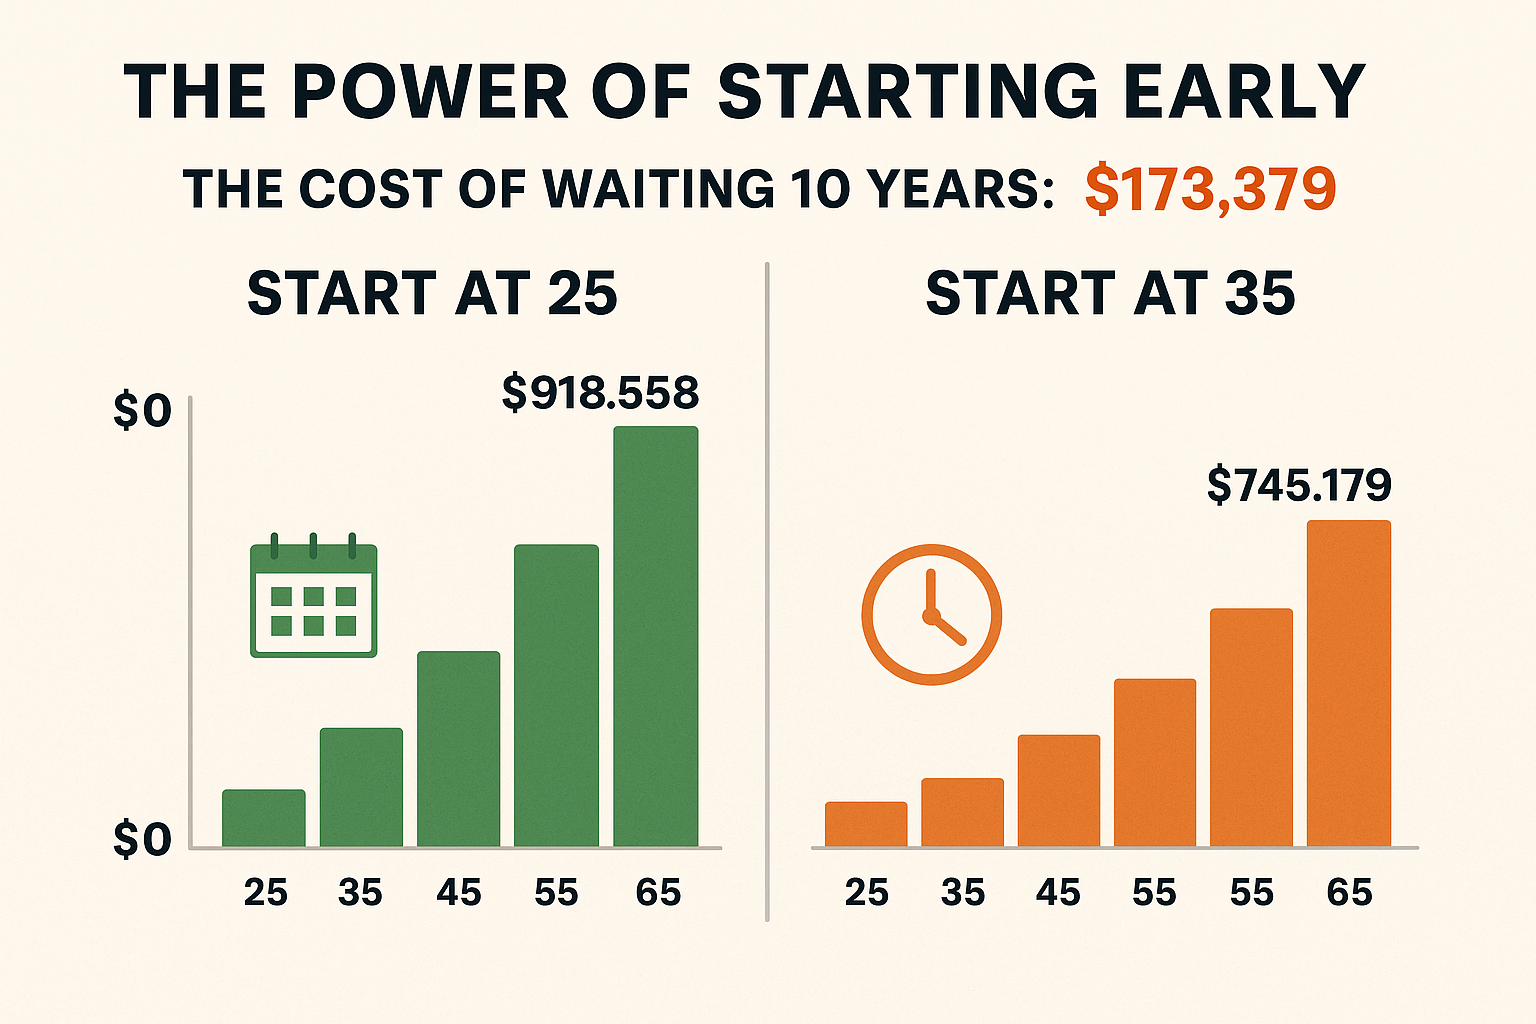
Scenario 1: The Early Starter (Age 25-35)
- Monthly contribution: $500
- Annual return: 8% (historical stock market average)
- Time period: 10 years
- Total contributions: $60,000
- Ending balance: $91,473
After age 35, with no additional contributions, this balance continues growing at 8% annually for 30 more years:
- Age 65 balance: $918,558
Scenario 2: The Late Starter (Age 35-65)
- Monthly contribution: $500
- Annual return: 8%
- Time period: 30 years
- Total contributions: $180,000
- Age 65 balance: $745,179
The early starter contributed $120,000 less but ended with $173,379 more wealth. This $173,379 difference represents the mathematical cost of delaying ten years.
The Breakeven Analysis
For the late starter to match the early starter’s outcome, they would need to contribute approximately $615 monthly instead of $500—a 23% increase—for the entire 30-year period. Total required contributions: $221,400 versus the early starter’s $60,000.
Takeaway: Starting in your 20s reduces the total capital required to reach the same wealth target by 63% compared to starting in your 30s.
Understanding Your Wealth-Building Equation
Building wealth follows a predictable formula with four primary variables you can control:
W = (I × S × R × T) – L
Where:
- W = Wealth accumulated
- I = Income earned
- S = Savings rate (percentage saved)
- R = Rate of return
- T = Time invested
- L = Lifestyle inflation and debt costs
Each variable has different leverage at different life stages. In your 20s, maximizing S (savings rate) and T (time) produces the greatest impact.
Savings Rate: The Most Controllable Variable
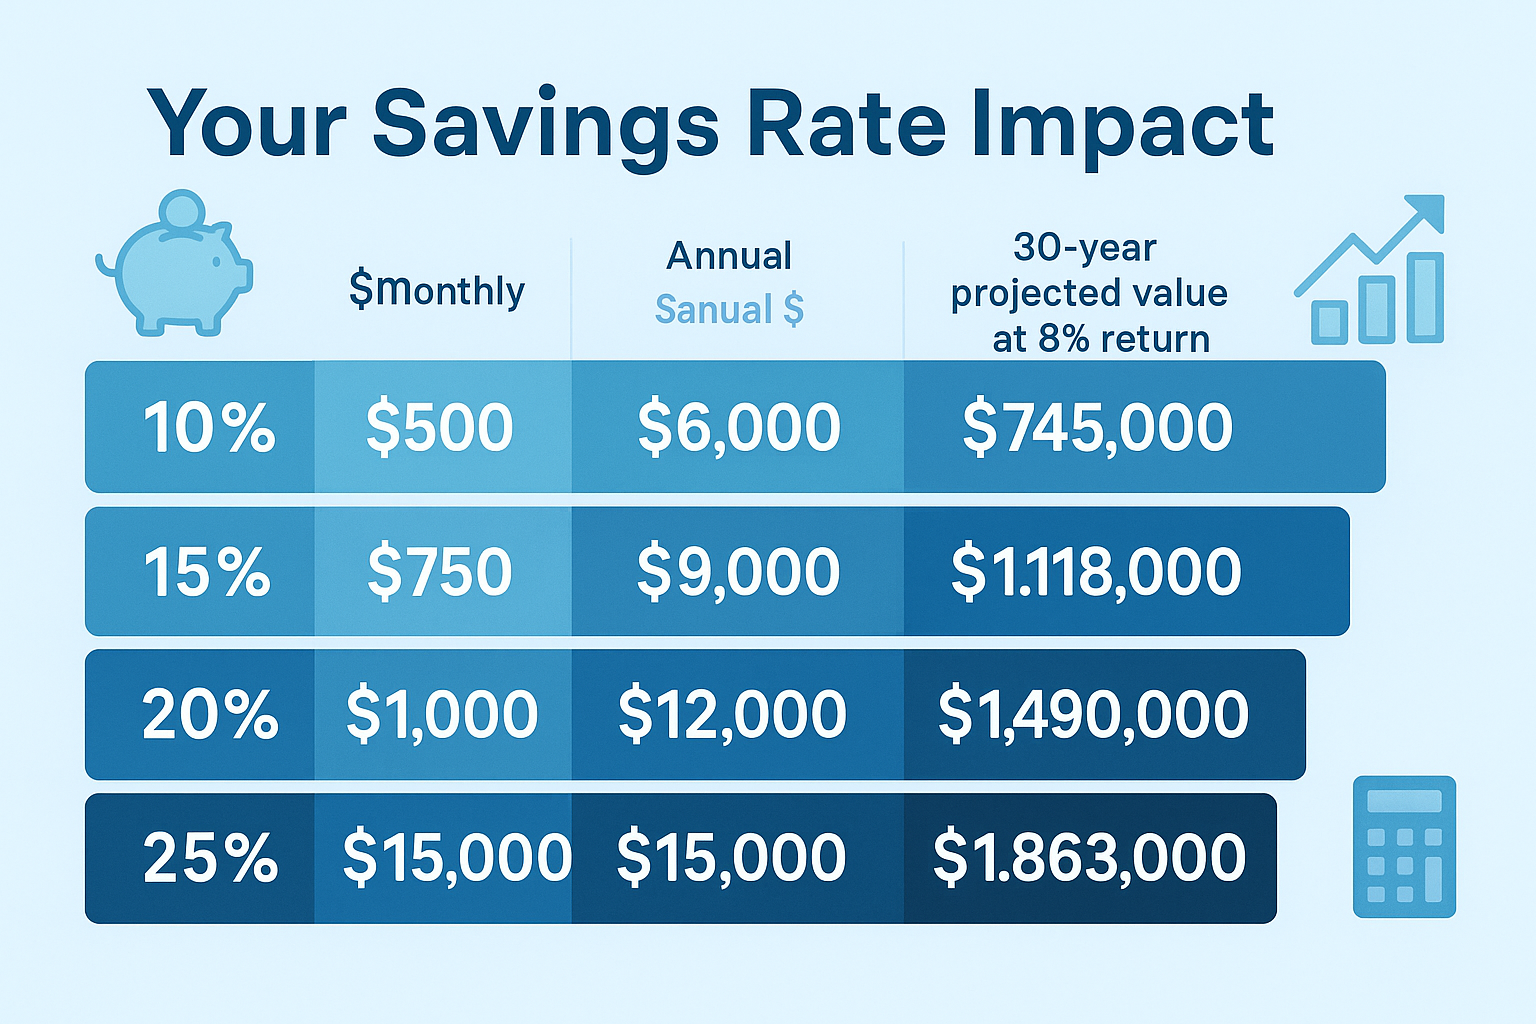
Your savings rate determines how quickly you build investable capital. The mathematics are straightforward but powerful:
| Monthly Income | Savings Rate | Monthly Saved | Annual Invested |
|---|---|---|---|
| $3,500 | 10% | $350 | $4,200 |
| $3,500 | 15% | $525 | $6,300 |
| $3,500 | 20% | $700 | $8,400 |
| $3,500 | 25% | $875 | $10,500 |
Increasing your savings rate from 10% to 20% doesn’t just double your contributions—it accelerates your timeline to financial independence exponentially. According to research from the Federal Reserve, households in the top wealth quartile maintain average savings rates above 20%, while the bottom quartile averages below 5%.
Rate of Return: Asset Allocation Math
Your investment returns depend primarily on asset allocation—how you divide capital between stocks, bonds, and cash equivalents.
Historical annual returns (1926-2024, per Morningstar data):
- Large-cap stocks: 10.2%
- Small-cap stocks: 12.1%
- Corporate bonds: 6.3%
- Government bonds: 5.5%
- Cash/savings accounts: 3.3%
A 100% stock portfolio historically returns approximately 10% annually with higher volatility. A 60/40 stock/bond mix returns approximately 8.5% with moderate volatility. The difference seems small—1.5 percentage points—but compounds dramatically.
$10,000 invested for 40 years:
- At 10% → $452,593
- At 8.5% → $289,599
- Difference: $162,994 (56% more wealth)
For investors in their 20s, the extended time horizon allows for higher stock allocation, capturing this growth premium while having decades to recover from market downturns. Understanding market volatility helps maintain allocation discipline during inevitable corrections.
The Three Phases of Wealth Building in Your 20s
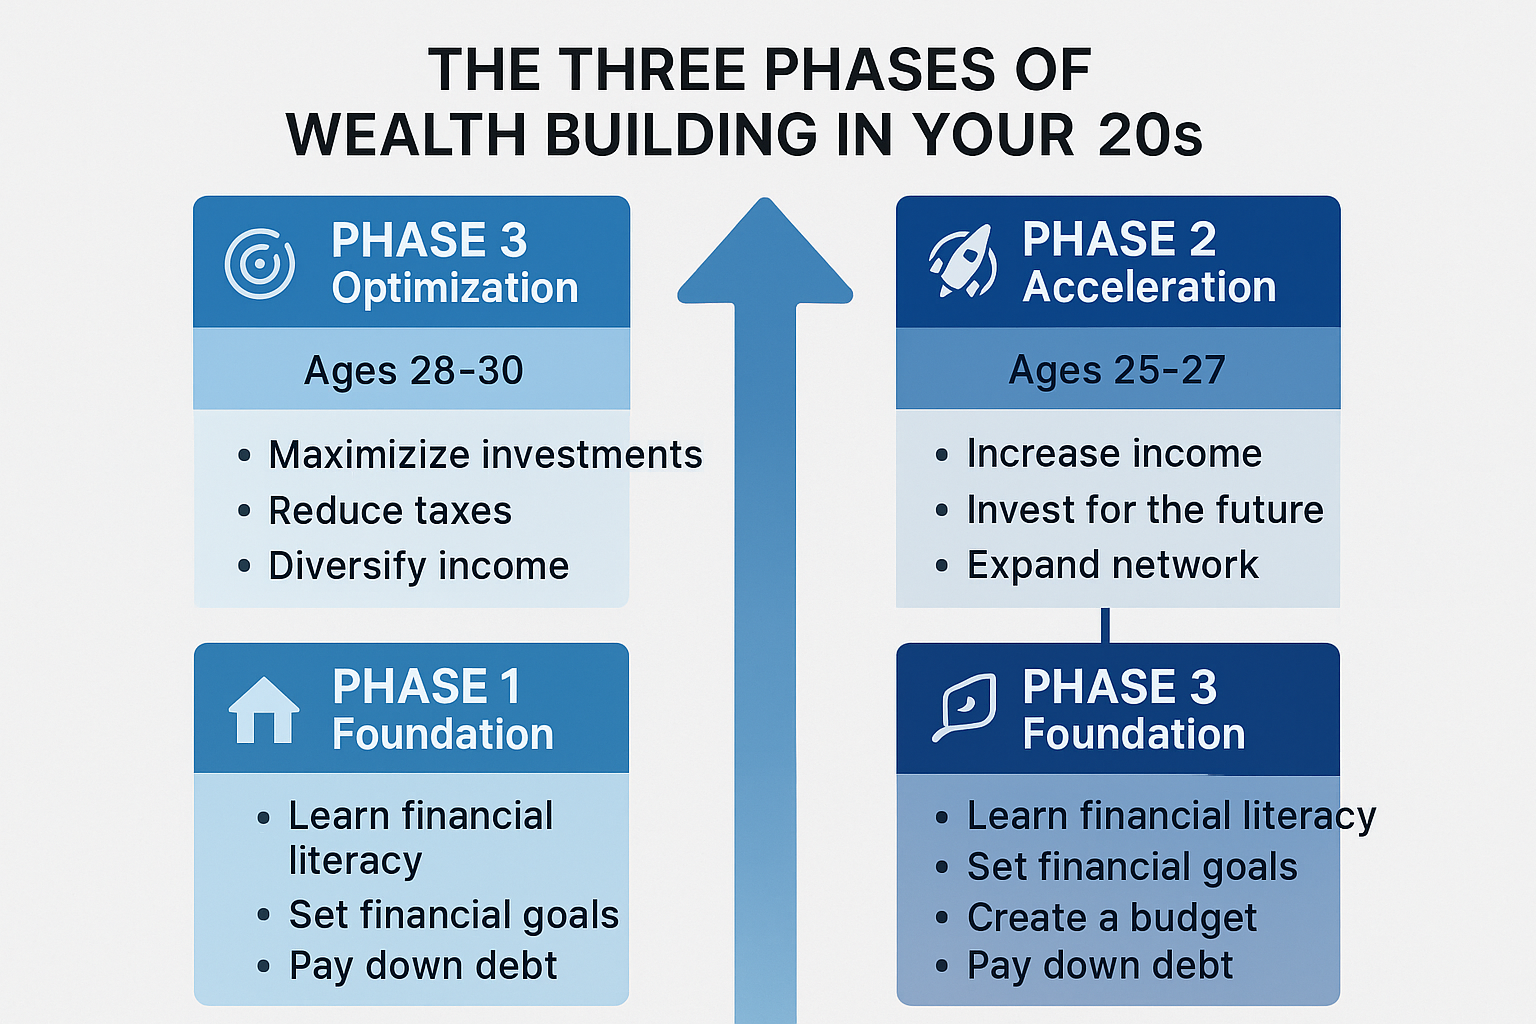
Building wealth in your 20s follows three distinct mathematical phases, each requiring different strategies and mindsets.
Phase 1: Foundation (Ages 20-24) — The Cash Flow Optimization Period
Primary goal: Establish positive monthly cash flow and eliminate high-interest debt.
The mathematics here focuses on the cost of debt versus the benefit of investing. Credit card debt, averaging 19.9% APR, costs more than any realistic investment return can offset.
Debt payoff priority formula:
Rank debts by interest rate, not balance. Pay minimums on all debts, then direct all extra cash to the highest-rate obligation.
Example calculation:
- Credit card: $5,000 at 19.9% APR
- Student loan: $15,000 at 5.5% APR
Paying an extra $200 monthly toward the credit card saves approximately $3,200 in interest and eliminates the debt 24 months faster than minimum payments alone. That same $200 invested at 8% would grow to only $5,200 over the same period—making debt elimination the superior mathematical choice when rates exceed expected investment returns.
Phase 2: Acceleration (Ages 25-27) — The Compounding Initiation Period
Primary goal: Maximize contribution rate and establish automated investing systems.
This phase focuses on the wealth accumulation formula:
Monthly Wealth Growth = (Monthly Contribution) + (Existing Balance × Monthly Return Rate)
Early in this phase, monthly contributions dominate the equation. A $500 contribution adds more to your account than 8% annual returns on a $10,000 balance ($500 versus $67 monthly).
As your balance grows, the second component becomes increasingly significant. By the end of this phase, with a $50,000 balance, that 8% return generates $333 monthly—still less than your $500 contribution, but closing the gap.
Strategic action: Increase contribution amounts by at least 1% of income annually, or redirect half of every raise toward investments.
Phase 3: Optimization (Ages 28-30) — The Strategic Allocation Period
Primary goal: Refine asset allocation and tax optimization strategies.
By this phase, your portfolio balance has reached a size where asset allocation decisions and tax efficiency create measurable wealth differences.
Tax-advantaged accounts follow this priority hierarchy based on mathematical benefit:
- 401(k) up to employer match (100% instant return)
- Health Savings Account (HSA) if eligible (triple tax advantage)
- Roth IRA (tax-free growth for 30+ years)
- 401(k) beyond match (tax-deferred growth)
- Taxable brokerage (flexibility, no contribution limits)
A $6,500 annual Roth IRA contribution at age 28, growing at 8% until age 65, becomes $176,850—completely tax-free. The same amount in a taxable account, assuming 15% capital gains tax, nets only $150,323. The mathematical advantage: $26,527 additional wealth from account selection alone.
Understanding different investment vehicles, including dividend investing strategies and growth-oriented ETFs, allows for strategic allocation across account types.
The Behavioral Mathematics: Why Most People Fail
Building wealth isn’t purely mathematical—behavioral factors create predictable deviations from optimal financial decisions. Understanding these patterns allows you to design systems that compensate for human tendencies.
Lifestyle Inflation: The Hidden Wealth Destroyer
Lifestyle inflation follows a predictable pattern: as income increases, spending rises proportionally or faster, preventing savings rate improvement.
The lifestyle inflation formula:
Effective Savings Rate = (Income Growth Rate) – (Spending Growth Rate)
If income grows 5% annually but spending also grows 5%, your effective savings rate remains constant. Your absolute savings increase, but your financial independence timeline doesn’t accelerate.
The mathematical solution: implement the 50/50 rule for income increases. Direct 50% of every raise, bonus, or income increase toward investments, allowing lifestyle to improve with the remaining 50%.
Example:
- Current income: $50,000
- Current savings: $10,000 (20% rate)
- Raise: $5,000 (10% increase)
- Traditional approach: Maintain 20% rate, save $11,000 (20% of $55,000)
- 50/50 approach: Save $12,500 ($10,000 + 50% of raise)
Over ten years with 4% annual raises, the 50/50 approach accumulates 31% more invested capital than maintaining a constant percentage.
Loss Aversion and Market Timing Failures
Behavioral finance research demonstrates that investors feel losses approximately 2.5 times more intensely than equivalent gains. This asymmetry leads to market timing attempts that statistically reduce returns.
The mathematics are clear: According to Morningstar’s annual Mind the Gap study, the average equity investor underperformed the S&P 500 by 1.7 percentage points annually over the past 20 years, primarily due to poorly timed buying and selling decisions.
$10,000 invested for 20 years:
- S&P 500 return (10%): $67,275
- Average investor return (8.3%): $49,268
- Behavioral cost: $18,007 (27% wealth reduction)
The solution lies in automated, systematic investing that removes emotional decision-making from the equation. Understanding why the stock market goes up over long periods helps maintain discipline during short-term volatility.
Building Multiple Income Streams: The Diversification Math
Relying solely on employment income creates mathematical vulnerability. Building wealth in your 20s includes developing secondary income streams that compound over time.
The Income Diversification Formula
Total Monthly Income = Employment + Passive + Side Business
Each component follows different growth curves and risk profiles:
Employment income: Linear growth, typically 3-5% annually, high security, capped by hours and position
Passive income: Exponential growth potential through passive income strategies, including dividend portfolios
Side business income: Variable growth, higher risk, unlimited upside potential
A diversified income approach might look like:
- Employment: $4,000/month (primary stability)
- Dividend portfolio: $200/month (growing 8-12% annually)
- Side consulting: $600/month (variable, skill-based)
- Total: $4,800/month
The mathematical advantage appears during economic disruptions. Job loss eliminates 83% of income in the single-source scenario but only 67% in the diversified model, providing greater financial resilience.
Dividend Growth Mathematics
Building a dividend portfolio creates a secondary income stream that grows independently of your labor.
Starting with $10,000 in dividend stocks yielding 3%, you generate $300 annually. Reinvesting those dividends and adding $300 monthly creates this growth trajectory:
| Year | Portfolio Value | Annual Dividends | Monthly Dividend Income |
|---|---|---|---|
| 1 | $13,891 | $417 | $35 |
| 5 | $25,734 | $772 | $64 |
| 10 | $56,384 | $1,691 | $141 |
| 15 | $102,847 | $3,085 | $257 |
| 20 | $171,943 | $5,158 | $430 |
By age 45 (starting at 25), this strategy generates $430 monthly in passive income—covering many basic living expenses without touching principal.
Tax Optimization: The Mathematics of Keeping More
Tax efficiency significantly impacts long-term wealth accumulation. Understanding the mathematical difference between tax-deferred, tax-free, and taxable growth is essential.
The Three Tax Treatments
Tax-deferred (Traditional 401k/IRA):
- Contribution reduces current taxable income
- Growth compounds without annual taxation
- Withdrawals taxed as ordinary income
Tax-free (Roth 401k/IRA):
- Contribution uses after-tax dollars
- Growth compounds without taxation
- Withdrawals completely tax-free
Taxable (Brokerage accounts):
- No contribution tax benefit
- Dividends and interest are taxed annually
- Capital gains are taxed when realized
The Roth Advantage in Your 20s
For young investors in lower tax brackets, Roth accounts provide superior mathematical outcomes.
Scenario: $6,500 annual contribution, 8% growth, 40 years
Roth IRA:
- Total contributions: $260,000 (after-tax)
- Age 65 value: $1,767,887
- Tax on withdrawal: $0
- Net wealth: $1,767,887
Traditional IRA (assuming 24% tax bracket at withdrawal):
- Total contributions: $260,000 (pre-tax value: $342,105)
- Age 65 value: $1,767,887
- Tax on withdrawal (24%): -$424,293
- Net wealth: $1,343,594
Roth advantage: $424,293 (31.6% more spendable wealth)
This calculation assumes equal tax brackets at contribution and withdrawal. For those in their 20s, current tax brackets are typically lower than future brackets, making the Roth advantage even more pronounced.
The Emergency Fund Equation: Balancing Safety and Opportunity Cost
Financial advice universally recommends emergency funds, but the mathematics of how much to hold and where to keep it require nuanced analysis.
The Emergency Fund Formula
Minimum Emergency Fund = Monthly Essential Expenses × Income Replacement Months
Essential expenses include only non-discretionary items: housing, utilities, food, insurance, and minimum debt payments.
For most people in their 20s:
- Single, renting, stable employment: 3 months
- Homeowner or less stable employment: 6 months
- Self-employed or single-income household: 9-12 months
Example calculation:
- Monthly essential expenses: $2,200
- Employment stability: Moderate
- Recommended emergency fund: $13,200 (6 months)
The Opportunity Cost Calculation
Money held in emergency savings earns minimal returns—typically 0.5-4.5% in high-yield savings accounts. This creates an opportunity cost versus investing.
$13,200 over 10 years:
- In savings at 4%: $19,566
- Invested at 8%: $28,493
- Opportunity cost: $8,927
However, this cost provides insurance against forced asset sales during emergencies. Selling investments during market downturns to cover unexpected expenses can permanently impair wealth building.
The optimal strategy: Build the emergency fund first (3-6 months), then redirect those monthly contributions toward investments. This sequence prevents the mathematical catastrophe of selling appreciating assets at inopportune times.
Real Estate Mathematics in Your 20s: Rent vs Buy
The rent versus buy decision involves complex mathematics that vary by market, life stage, and opportunity cost.
The Comprehensive Rent vs. Buy Formula
True Cost of Ownership = (Mortgage + Property Tax + Insurance + Maintenance + HOA) – (Tax Benefits + Appreciation) + (Opportunity Cost of Down Payment)
Many analyses ignore the final component—opportunity cost—which significantly impacts the mathematics for young investors.
Scenario: $300,000 home purchase versus continued renting
Buying:
- Down payment: $60,000 (20%)
- Monthly mortgage (30-year, 7%): $1,596
- Property tax: $250/month
- Insurance: $100/month
- Maintenance (1% annually): $250/month
- Total monthly cost: $2,196
Renting:
- Monthly rent: $1,800
- Renter’s insurance: $25/month
- Total monthly cost: $1,825
Monthly difference: $371 (buying costs more)
Additionally, the $60,000 down payment, if invested at 8% for 30 years, grows to $603,569. This opportunity cost rarely appears in rent-versus-buy analyses but represents real wealth foregone.
The mathematical advantage of buying emerges through:
- Forced savings (principal paydown)
- Leverage (controlling $300,000 with $60,000)
- Appreciation (historically 3-4% annually)
- Tax deductions (mortgage interest, property taxes)
Insight: In your 20s, renting often provides superior mathematical outcomes due to flexibility, lower capital requirements, and the ability to invest the down payment difference in higher-returning assets. The buying advantage typically emerges when planning to stay in one location for 7+ years.
Calculating Your Financial Independence Number
Understanding your financial independence (FI) number provides a concrete wealth target and timeline.
The 4% Rule and Your FI Number
The 4% rule, derived from the Trinity Study analyzing historical withdrawal rates, suggests you can safely withdraw 4% of your portfolio annually without depleting principal over a 30-year retirement.
FI Number = Annual Expenses ÷ 0.04
Or simplified:
FI Number = Annual Expenses × 25
If your annual expenses equal $40,000, your FI number is $1,000,000. At this portfolio value, you can withdraw $40,000 annually (4%) indefinitely with high statistical confidence.
Reverse Engineering Your Timeline
Once you know your FI number, you can calculate how long it takes to reach it based on your savings rate and returns.
Using the future value of an annuity formula:
FV = PMT × [((1 + r)^n – 1) / r]
Where:
- FV = Your FI number
- PMT = Monthly contribution
- r = Monthly return rate
- n = Number of months
Example: Reaching $1,000,000 FI number
- Monthly contribution: $1,000
- Annual return: 8% (0.67% monthly)
Solving for n: approximately 360 months (30 years)
Increasing the monthly contribution to $1,500 reduces the timeline to 276 months (23 years)—a 7-year acceleration from a 50% contribution increase.
Takeaway: Your savings rate has exponentially greater impact on your FI timeline than investment returns, especially in the early years.
Common Mathematical Mistakes That Destroy Wealth
Several predictable errors create massive long-term wealth destruction. Understanding the mathematics reveals their true cost.
Mistake 1: Waiting to Invest “Until I Have More Money”
The mathematics of waiting are brutal. Every year delayed represents one fewer doubling period.
Cost of waiting 5 years (starting at 30 instead of 25):
- $500 monthly at 8% for 35 years: $1,146,564
- $500 monthly at 8% for 30 years: $745,179
- Cost of delay: $401,385
To recover this loss, the late starter must contribute $645 monthly instead of $500—a 29% increase—for the entire 30-year period.
Mistake 2: Paying Only Minimum Payments on Debt
Minimum payments on credit cards typically equal 2-3% of the balance, designed to maximize interest paid.
$5,000 credit card balance at 18% APR:
- Minimum payment (3%): $150, declining as balance decreases
- Payoff timeline: 153 months (12.75 years)
- Total interest paid: $3,427
- Total cost: $8,427
Paying $200 monthly instead:
- Payoff timeline: 32 months (2.67 years)
- Total interest paid: $824
- Total cost: $5,824
Savings: $2,603 (31% reduction) plus 10 years of freed cash flow
Mistake 3: Ignoring Investment Fees
Investment fees compound negatively, reducing returns every year.
$100,000 invested for 30 years at 8% gross return:
- With 0.05% fee (index fund): $983,731
- With 1.00% fee (actively managed fund): $761,226
- Fee cost: $222,505 (23% wealth reduction)
The difference between a low-cost index fund and a typical actively managed fund costs nearly a quarter of your final wealth. Understanding market movements helps evaluate whether active management justifies these costs.
Advanced Strategies: Leveraging Tax-Advantaged Accounts
Maximizing tax-advantaged accounts creates mathematical advantages that compound over decades.
The Mega Backdoor Roth Strategy
For high earners exceeding Roth IRA income limits, the mega backdoor Roth allows up to $43,500 in additional after-tax contributions (2025 limits) to be converted to Roth.
Process:
- Contribute after-tax dollars to 401(k) beyond the $23,000 employee limit
- Immediately convert to Roth 401(k) or Roth IRA
- Enjoy tax-free growth on amounts far exceeding standard Roth limits
30-year projection on $43,500 annual mega backdoor Roth contributions at 8%:
- Total contributions: $1,305,000
- Age 65 value: $5,354,174
- Tax on withdrawal: $0
- Tax savings versus taxable account (24% rate): $1,285,002
This strategy requires employer plan support and careful execution, but provides extraordinary tax optimization for those who qualify.
Health Savings Account (HSA) Triple Tax Advantage
HSAs offer the only triple tax advantage in the tax code:
- Tax-deductible contributions
- Tax-free growth
- Tax-free withdrawals for qualified medical expenses
Maximum strategy:
- Contribute the annual maximum ($4,300 individual, $8,550 family in 2025)
- Pay current medical expenses out-of-pocket
- Invest HSA funds aggressively
- Preserve receipts for future tax-free reimbursement
$8,550 annual contribution for 30 years at 8%:
- Total contributions: $256,500
- Age 65 value: $1,051,845
- Completely tax-free for medical expenses (or penalty-free for any purpose after age 65)
Your 20s Wealth-Building Action Plan
Building wealth requires translating mathematical understanding into systematic action. This framework provides a step-by-step implementation guide.
Year 1-2: Foundation Building
- Establish a cash flow positive status (income > expenses)
- Build $1,000 starter emergency fund
- Eliminate high-interest debt (>8% interest rate)
- Open and fund a Roth IRA with at least $500
- Contribute to 401(k) up to employer match
Year 3-5: Acceleration Phase
- Increase emergency fund to 3-6 months’ expenses
- Maximize Roth IRA contributions ($6,500-7,000 annually)
- Increase 401(k) contributions by 1% every 6 months
- Develop one additional income stream
- Achieve 15-20% overall savings rate
Year 6-10: Optimization Phase
- Maximize all tax-advantaged accounts (401k, IRA, HSA)
- Open a taxable brokerage account for additional investments
- Implement tax-loss harvesting strategies
- Achieve 25%+ savings rate
- Calculate and track progress toward the FI number
- Consider real estate or alternative investments
Each phase builds on previous accomplishments, creating mathematical momentum that accelerates wealth accumulation. For additional strategic approaches, explore these smart financial moves that complement core wealth-building principles.
Conclusion: The Mathematics of Starting Now
Building wealth in your 20s isn’t about luck, inheritance, or exceptional income—it’s about understanding and applying fundamental financial mathematics consistently over time. The formulas are simple: compound growth, savings rate optimization, tax efficiency, and time horizon maximization.
The real math reveals an uncomfortable truth: every month you delay costs thousands in future wealth. But it also reveals an empowering reality: modest, consistent actions create extraordinary long-term results when given sufficient time to compound.
Your 20s provide the single greatest wealth-building advantage you’ll ever possess—not more money, but more time. The question isn’t whether you can afford to start building wealth now. The mathematics proves you can’t afford not to.
Next steps:
- Calculate your current savings rate using the formulas above
- Open a Roth IRA this week if you haven’t already
- Automate at least $100 monthly into your investment account
- Increase this amount by 1% of your income every quarter
- Track your progress toward your financial independence number
The mathematics is clear. The path is proven. The only variable remaining is your decision to begin.
For those ready to dive deeper into specific investment strategies, explore comprehensive guides on stock market fundamentals and building sustainable passive income streams.
💰 Wealth Building Calculator
See the real math behind building wealth in your 20s
About the Author
Written by Max Fonji, founder of TheRichGuyMath.com—a finance educator and investor who explains the "math behind money" in simple, actionable terms. With experience in investment strategy, personal finance, and wealth-building systems, Max helps readers understand how financial decisions create lasting results. His approach combines rigorous financial analysis with accessible teaching, empowering readers to make data-driven wealth-building decisions.
Disclaimer
Disclaimer: The content on TheRichGuyMath.com is for educational purposes only and does not constitute financial or investment advice. All mathematical examples use historical averages and hypothetical scenarios for illustration—actual results will vary based on market conditions, individual circumstances, and investment choices. Always consult a qualified financial professional before making financial decisions. Past performance does not guarantee future results.


