Trade policy shapes economies, influences consumer prices, and affects investment returns. Trump tariffs refer to import taxes imposed during Donald Trump’s presidency, primarily targeting goods from China and other trading partners. These tariffs were designed to protect U.S. industries, reduce trade deficits, and pressure foreign governments, but they also affected consumer prices, businesses, and global markets.
Understanding the math behind money requires examining how government policies like tariffs create ripple effects through supply chains, corporate earnings, and household budgets. This guide explains what Trump tariffs are, how they work, and their real economic impact using data-driven insights and evidence-based analysis.
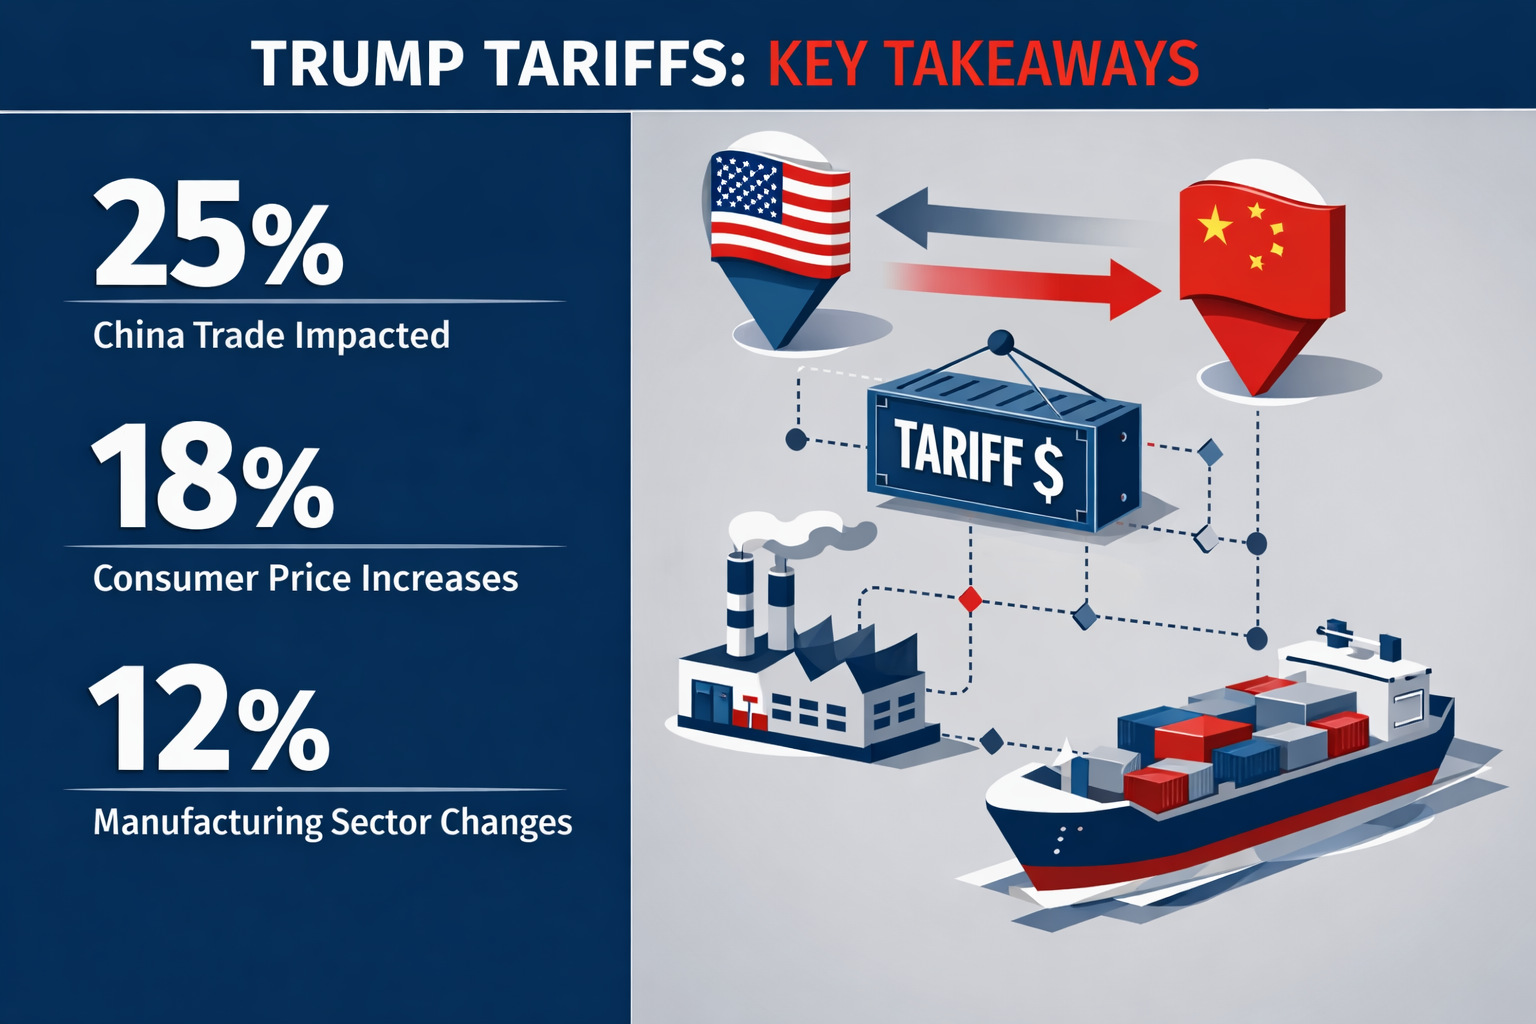
Key Takeaways
- Trump tariffs are import taxes that U.S. companies pay, not the foreign governments, which often get passed to consumers through higher prices
- Major tariffs targeted China (up to 25% on $370 billion in goods), plus global steel (25%) and aluminum (10%) imports.
- Tariffs function as a hidden tax on households, raising costs on electronics, appliances, clothing, and building materials.
- Economic impacts were mixed: some domestic producers benefited while farmers, exporters, and import-dependent businesses faced losses.
- Many Trump-era tariffs remain in effect in 2026, continuing to influence inflation, supply chains, and market volatility.
What Are Trump Tariffs?
Trump tariffs are import taxes introduced between 2018 and 2020 under the Trump administration. A tariff raises the price of foreign goods entering the United States, making domestic alternatives more competitive in theory.
In simple terms, tariffs make imported products more expensive by adding a percentage-based tax at the point of entry.
The tariff structure works like this: when a U.S. company imports a product valued at $1,000 and faces a 25% tariff, the company pays $250 in taxes to U.S. Customs. The company then decides whether to absorb this cost (reducing profit margins) or pass it to consumers (raising retail prices).
Why Trump Tariffs Were Introduced
The Trump administration implemented these trade barriers with four primary objectives:
Reduce U.S. trade deficits — The United States imported far more goods than it exported, particularly from China. Tariffs aimed to narrow this gap by making imports less attractive.
Protect American manufacturing — Domestic producers faced competition from lower-cost foreign manufacturers. Higher import prices theoretically give U.S. factories a competitive advantage.
Pressure China on trade practices — Concerns about intellectual property theft, forced technology transfers, and state subsidies to Chinese companies drove aggressive tariff policies.
Encourage domestic production — By making foreign goods more expensive, tariffs incentivize companies to manufacture products in the United States.
The economic logic follows a straightforward cause-and-effect relationship: higher import costs → increased domestic competitiveness → more U.S. manufacturing jobs → reduced trade deficits.
However, the actual outcomes proved more complex than this simplified model suggests.
The Scale of Trump Tariffs
By 2020, the United States had imposed tariffs on approximately $380 billion worth of imports—the largest trade intervention since the 1930s Smoot-Hawley Tariff Act.
These weren’t minor adjustments. Average tariff rates on affected Chinese goods reached 19.3%, compared to the pre-2018 average of 3.1% on all imports.
The scope extended beyond China. Steel and aluminum tariffs applied globally, affecting allies including Canada, Mexico, and the European Union.
The U.S. Trade Representative (USTR) provides official tariff schedules and trade policy documentation.
Understanding how tariffs work connects directly to broader concepts in risk management and how government policies affect investment portfolios.
How Trump Tariffs Work: The Mechanics
Who Actually Pays the Tariff?
Despite common misconceptions, foreign countries don’t directly pay tariffs. This represents one of the most misunderstood aspects of trade policy.
Tariffs are paid by:
- U.S. companies that import goods
- Consumers who face higher retail prices when companies pass costs forward
- Shareholders who experience reduced corporate profits when companies absorb costs
The payment mechanism works through U.S. Customs and Border Protection. When goods arrive at American ports, the importing company must pay the tariff before taking possession.
Consider this example:
A U.S. electronics retailer imports smartphones from China, valued at $500 each. With a 25% tariff, the company pays $125 per phone to U.S. Customs. The retailer now has three options:
- Raise prices to $625+ to maintain profit margins (consumers pay)
- Absorb the cost and accept lower profits (shareholders pay)
- Find alternative suppliers in non-tariffed countries (supply chain disruption)
Federal Reserve research found that U.S. businesses and consumers bore nearly the full cost of Trump tariffs, with minimal impact on Chinese export prices.
How Tariffs Are Collected
The collection process follows a standardized procedure:
Step 1: Goods arrive at U.S. ports of entry (seaports, airports, border crossings)
Step 2: U.S. Customs classifies products using Harmonized Tariff Schedule codes
Step 3: Tariff rates apply based on product classification and country of origin
Step 4: The Importing company pays the calculated tariff amount
Step 5: Goods clear customs and enter U.S. commerce
Tariffs are calculated either as:
- Ad valorem tariffs: Percentage of product value (most common)
- Specific tariffs: Fixed amount per unit (less common)
The tariff revenue flows directly to the U.S. Treasury. In 2019, tariff collections reached $71 billion—the highest level since 1986.
The Cost Pass-Through Effect
Economic studies measuring how much of the tariff cost reaches consumers found pass-through rates of 80-100% for most product categories.
This means: if a tariff adds $100 to import costs, retail prices typically increase by $80-$100.
The pass-through rate varies by:
- Market competition: Highly competitive markets see faster pass-through
- Product substitutability: Unique products allow companies to absorb more costs
- Time horizon: Pass-through increases over time as contracts renew
Therefore, tariffs function economically similarly to a sales tax—raising prices for end consumers rather than extracting payments from foreign producers.
Major Trump Tariffs by Category
The Trump administration implemented tariffs across multiple product categories and countries. Understanding the specific rates and targets clarifies the policy’s scope.
Comprehensive Tariff Breakdown
| Product Category | Tariff Rate | Target Country | Value of Imports Affected |
|---|---|---|---|
| Steel | 25% | Global (with exceptions) | $29 billion |
| Aluminum | 10% | Global (with exceptions) | $17 billion |
| Electronics | 7.5% – 25% | China | $120 billion |
| Machinery | 10% – 25% | China | $95 billion |
| Consumer Goods | 15% – 25% | China | $85 billion |
| Auto Parts | 25% | China | $18 billion |
| Chemicals | 10% – 25% | China | $15 billion |
Source: U.S. Trade Representative, Federal Reserve Economic Data[6]
Section 301 Tariffs on China
The largest component involved Section 301 tariffs targeting China specifically. These rolled out in four phases:
List 1 (July 2018): 25% tariffs on $34 billion in Chinese goods—primarily industrial machinery and electronics components
List 2 (August 2018): 25% tariffs on an additional $16 billion—semiconductors, chemicals, plastics
List 3 (September 2018): 10% tariffs on $200 billion—consumer goods, furniture, electronics (later increased to 25%)
List 4 (September 2019): 15% tariffs on $120 billion—smartphones, laptops, clothing, footwear (later reduced to 7.5%)
Combined, these measures covered approximately 66% of all U.S. imports from China.[7]
Steel and Aluminum Tariffs
Implemented under Section 232 (national security grounds), these tariffs applied broadly:
- 25% on steel imports from most countries
- 10% on aluminum imports from most countries
The administration granted exemptions and quotas to certain countries through negotiations. Canada, Mexico, and South Korea received exemptions after agreeing to export limits.
These tariffs particularly affected:
- Construction industry (building materials)
- Automotive manufacturers (vehicle frames, parts)
- Beverage industry (aluminum cans)
- Appliance makers (washing machines, refrigerators)
Domestic steel prices increased 30% in 2018 following tariff implementation, directly raising costs for steel-consuming industries.
Washing Machine Tariffs
A smaller but illustrative example: 20-50% tariffs on washing machines from all sources.
Result: washing machine prices increased 12% ($86 per unit average), costing consumers approximately $1.5 billion annually.
This case study demonstrates how tariffs on one product category create measurable consumer price impacts.
Why Trump Focused on China
China represented the primary target of Trump’s tariffs, accounting for over 75% of the affected import value. Understanding this focus requires examining the underlying trade relationship and policy concerns.
The U.S.-China Trade Imbalance
In 2017, before tariffs began, the United States imported $505 billion in goods from China while exporting only $130 billion—a trade deficit of $375 billion.
This deficit meant:
- U.S. consumers and businesses bought far more Chinese products than China purchased American goods
- Money flowed out of the U.S. economy to pay for imports
- American manufacturing faced intense competition from lower-cost Chinese production
The Trump administration viewed this imbalance as evidence of unfair trade practices requiring correction through tariff pressure.
Key Concerns Driving China’s Tariffs
Intellectual property theft — U.S. companies estimated losses of $225-$600 billion annually from Chinese IP violations, including forced technology transfers, trade secret theft, and counterfeiting.[11]
State subsidies to Chinese firms — China’s government provided extensive financial support to domestic companies, allowing them to undercut market prices. This created uneven competition that disadvantaged U.S. manufacturers operating without similar subsidies.
Market access restrictions — China maintained barriers preventing U.S. companies from competing fairly in Chinese markets, including ownership restrictions, regulatory obstacles, and preferential treatment for domestic firms.
Currency manipulation concerns — Critics argued that China artificially weakened its currency to make exports cheaper and imports more expensive.
National security considerations — Dependence on Chinese manufacturing for critical goods (electronics, pharmaceuticals, rare earth minerals) raised strategic vulnerabilities.
These factors combined to create political and economic momentum for aggressive tariff policies targeting China specifically.
China’s Retaliatory Tariffs
China responded with retaliatory tariffs targeting U.S. exports strategically chosen for political impact:
Agricultural products — Soybeans, pork, dairy, corn, wheat, sorghum
Automobiles and auto parts — 25-40% tariffs on U.S.-made vehicles
Energy products — Liquefied natural gas, crude oil
Industrial goods — Aircraft, machinery, chemicals
The retaliation particularly hurt American farmers. U.S. soybean exports to China dropped 74% in 2018, from $12.3 billion to $3.1 billion.[12]
This created a feedback loop: Trump tariffs → Chinese retaliation → harm to U.S. exporters → government subsidies to affected industries → increased fiscal costs.
The Phase One Trade Deal
In January 2020, the United States and China signed the Phase One trade agreement, which:
- Maintained most existing tariffs
- Committed China to purchase $200 billion in additional U.S. goods over two years
- Included intellectual property protections
- Established dispute resolution mechanisms
However, China ultimately purchased only 58% of the committed amounts through 2021, falling short of targets.
Most Trump-era China tariffs remained in place through subsequent administrations, indicating bipartisan consensus on maintaining pressure despite economic costs.
External resource: Council on Foreign Relations provides a comprehensive analysis of U.S.-China trade relations and tariff impacts.
How Trump Tariffs Affected Consumers
Tariffs create direct and indirect effects on household budgets. Understanding these impacts requires examining specific product categories and price changes.
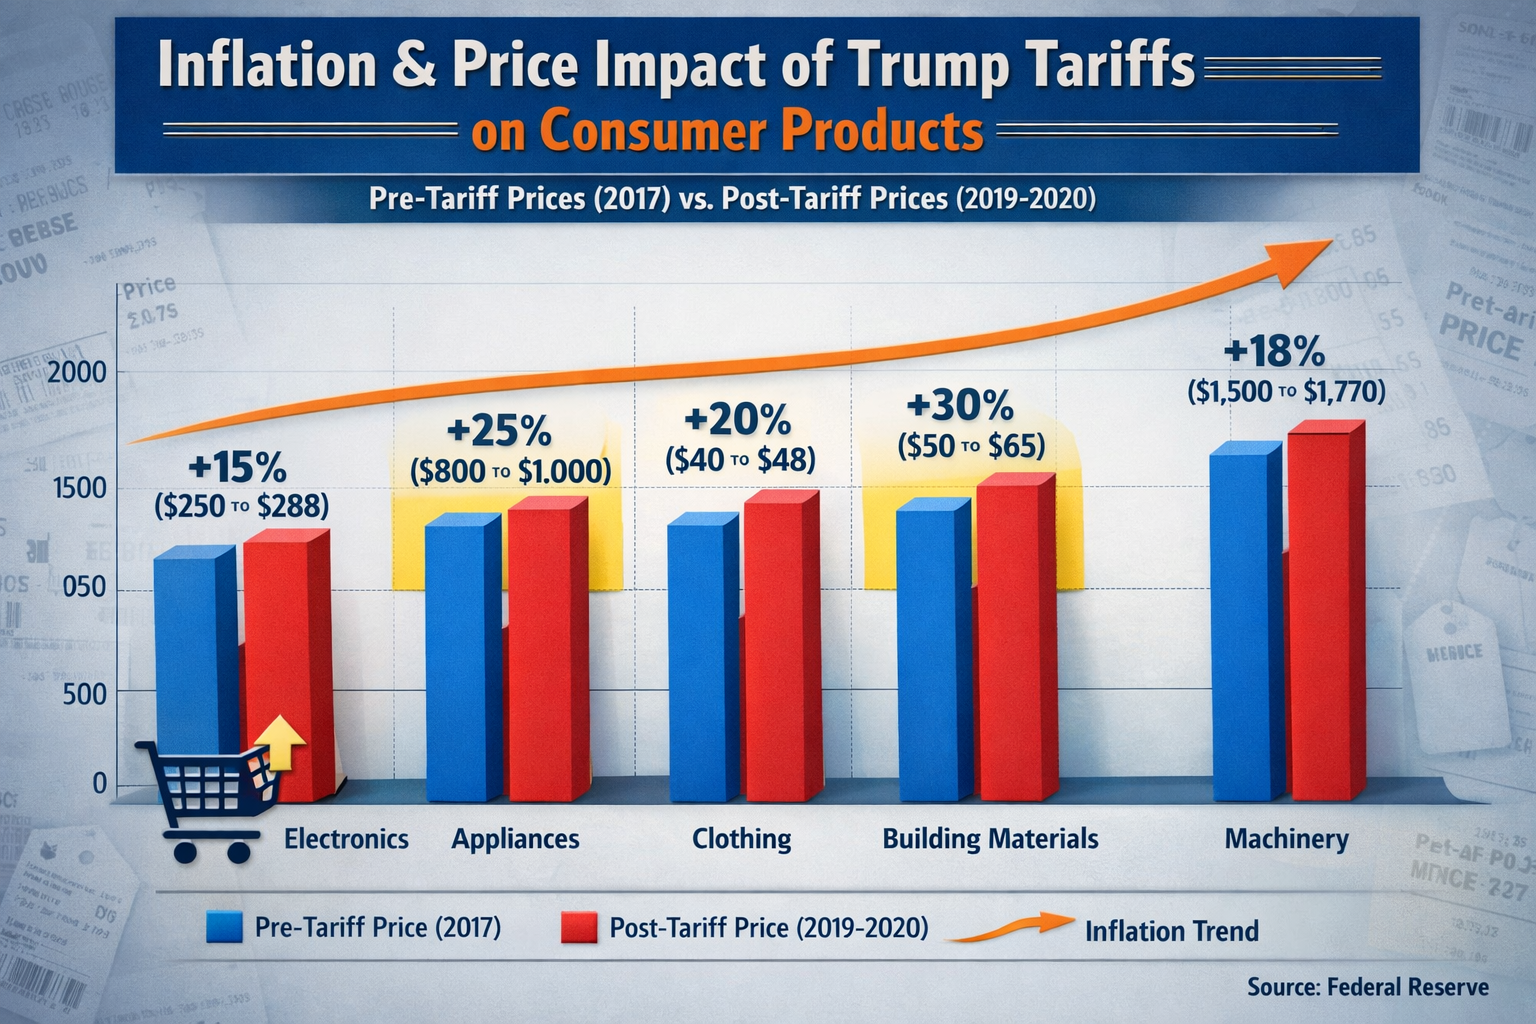
Higher Prices Across Product Categories
Trump tariffs increased costs on everyday consumer goods:
Electronics — Laptops, smartphones, tablets, televisions, and gaming consoles saw price increases of 5-15% depending on tariff exposure and manufacturer response.[14]
Appliances — Washing machines, dryers, refrigerators, and dishwashers experienced 10-12% price increases, adding approximately $100-$200 per appliance.[15]
Clothing and footwear — Tariffs on Chinese textiles raised costs 3-8%, though many retailers absorbed portions to maintain competitive pricing.
Building materials — Steel and aluminum tariffs increased construction costs 5-10%, affecting home prices, renovation projects, and commercial construction.
Furniture — Tariffs on Chinese-manufactured furniture raised prices 8-12%, particularly for budget and mid-range products.
The Hidden Tax on Households
Economic research calculated the aggregate consumer impact:
The typical American household paid an estimated $831 annually in higher costs due to Trump tariffs by 2019.[
This functions as a regressive tax because:
- Lower-income households spend higher percentages of income on goods versus services
- Tariffed products (electronics, appliances, clothing) represent larger budget shares for working-class families
- Wealthier households more easily absorb price increases
Therefore, tariffs disproportionately burden those least able to afford higher costs.
Real-World Price Examples
Example 1: Washing Machines
- Pre-tariff average price: $690
- Post-tariff average price: $776
- Increase: $86 (12.5%)
- Annual consumer cost: $1.5 billion total[
Example 2: Imported Appliances
A $1,000 imported refrigerator facing a 25% tariff:
- Tariff cost: $250
- Retailer markup on increased cost: $50
- New consumer price: $1,300
- Total increase: 30%
Example 3: Electronics
Laptop computer originally priced at $800:
- 25% tariff on components: $150 (assuming 75% component value from China)
- Manufacturer pass-through: $120 (80% pass-through rate)
- New retail price: $920
- Percentage increase: 15%
Federal Reserve Analysis
Federal Reserve studies found that tariffs acted like a hidden consumption tax with several characteristics:
- Non-transparent: Consumers don’t see tariffs itemized like sales tax
- Unavoidable: Difficult to substitute away from affected products
- Permanent: Price increases persist even if tariffs are later removed
- Inflationary: Contributes to overall price level increases
The Federal Reserve Bank of New York calculated that tariffs reduced real household income by $1,277 per year when accounting for both higher prices and reduced economic efficiency.
Product Substitution and Quality Effects
Some consumers responded by:
- Switching to domestic alternatives (when available, often at higher prices)
- Delaying purchases (particularly for durable goods)
- Buying lower-quality substitutes (trading down to maintain budget)
- Reducing consumption (purchasing less overall)
These behavioral changes represent real welfare losses beyond simple price increases—consumers ended up with less preferred products or deferred needed purchases.
Internal connection: Understanding how tariffs affect consumer prices relates to broader principles of inflation, purchasing power, and wealth-building strategies that account for cost-of-living changes.
Impact on U.S. Businesses and Jobs
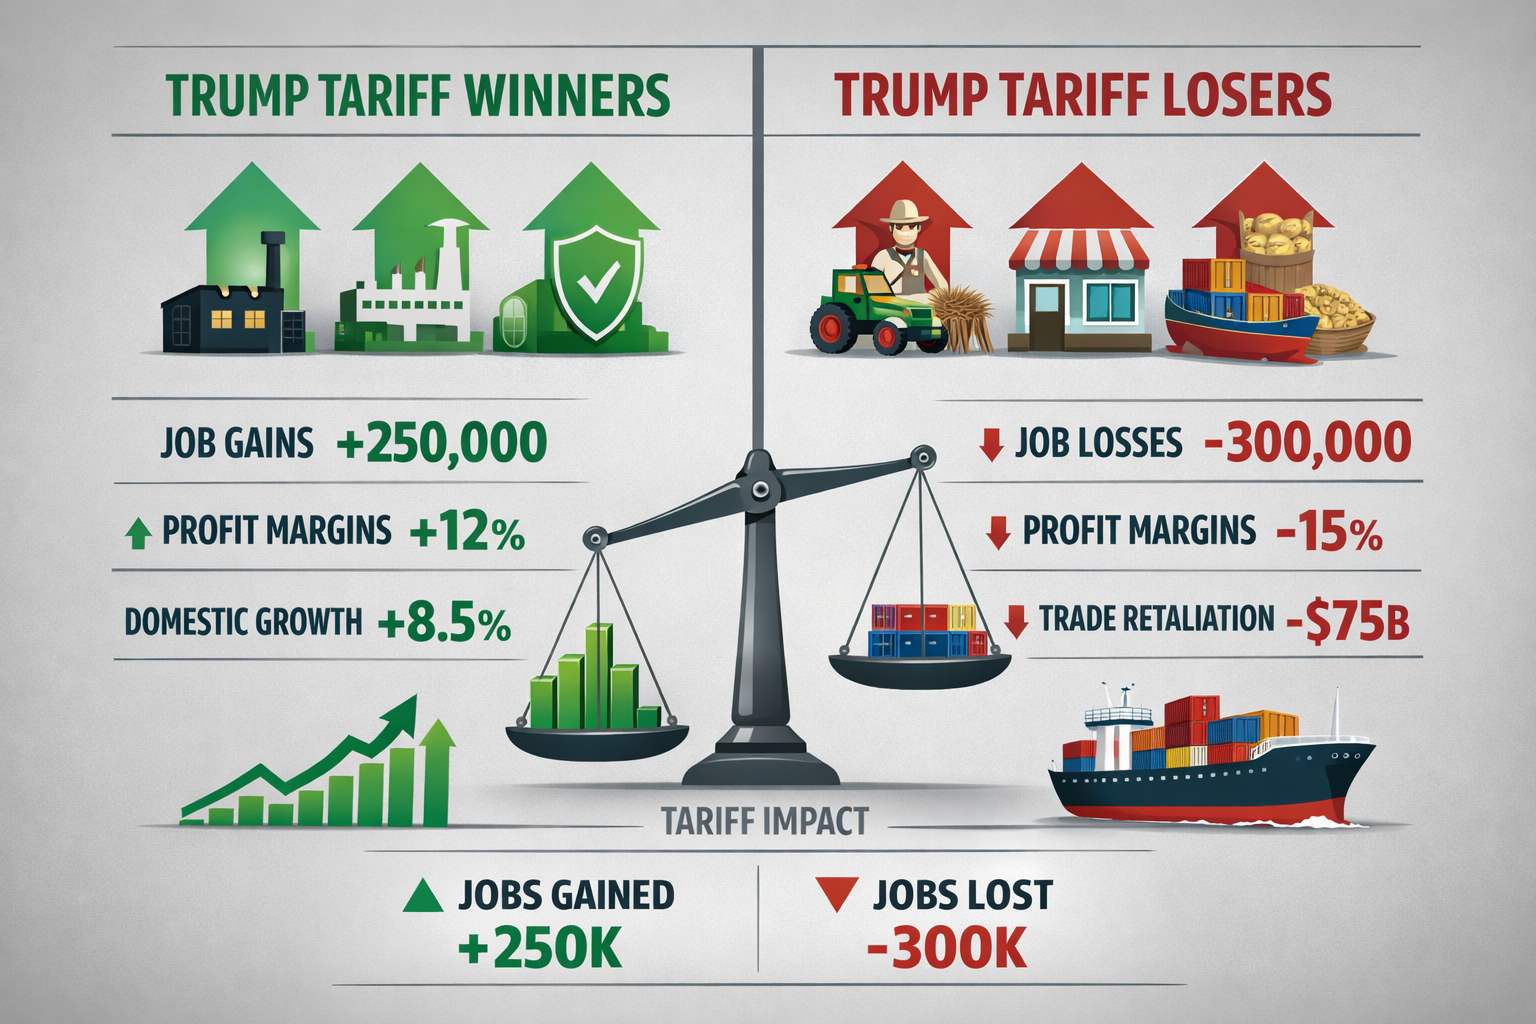
Trump tariffs created winners and losers across the American business landscape. The economic impacts varied dramatically by industry, company size, and supply chain structure.
Winners: Protected Industries
Domestic steel producers — U.S. Steel, Nucor, and other American steel manufacturers experienced:
- Revenue increases of 15-20% in 2018-2019
- Stock price gains averaged 35% in the first year after tariffs
- Capacity utilization rising from 73% to 80%
- Approximately 1,900 new steel jobs created[19]
Select manufacturing sectors — Some domestic manufacturers benefited from reduced import competition:
- Washing machine production increased 20%
- Several companies announced plans to build or expand U.S. factories
- Temporary profit margin improvements for import-competing firms
Tariff-exempt suppliers — Companies that successfully obtained tariff exemptions gained competitive advantages over rivals still paying import taxes.
Losers: Import-Dependent and Export Industries
American farmers — Agricultural exports faced severe retaliation:
- Soybean farmers lost $3 billion in export value in the first year
- Pork producers saw exports to China drop 50%
- Dairy farmers faced tariffs of up to 25% on key products
- Total agricultural export losses: $27 billion over two years
The federal government responded with $28 billion in farm subsidies to offset losses—effectively, taxpayer-funded compensation for tariff damage.
Small businesses reliant on imports — Companies without resources to:
- Negotiate alternative suppliers
- Absorb higher costs
- Navigate tariff exemption processes
These businesses faced profit margin compression averaging 3-7%, with many unable to pass full costs to price-sensitive customers.
Export-heavy industries — Manufacturers selling to China and other retaliating countries experienced:
- Aircraft manufacturers: $3.9 billion in lost exports
- Automotive sector: $1.4 billion in reduced sales
- Machinery exporters: $2.1 billion in decreased orders
Construction industry — Higher steel and aluminum costs increased project expenses:
- Commercial construction costs rose 5-8%
- Residential building costs increased $9,000 per home on average
- Infrastructure projects faced budget overruns[23]
The Job Impact: Mixed Results
Employment effects proved complex and contested:
Jobs potentially saved in protected industries: 8,700-11,000 (steel, aluminum, washing machines)
Jobs potentially lost in consuming industries: 16,000-75,000 (estimates vary widely by methodology)
Net employment effect: Likely modestly negative, though difficult to isolate from other economic factors
The math reveals an important insight: protected industries employ fewer workers than industries that use protected products as inputs. Steel production employs approximately 140,000 workers, while steel-consuming industries employ over 6.5 million.
Therefore, tariffs that help 140,000 steel workers may harm a much larger number employed in industries facing higher input costs.
Corporate Profit Impacts
Public company earnings calls in 2018-2019 frequently cited tariffs:
- S&P 500 companies mentioned “tariffs” in earnings calls 3,200+ times in 2018-2019
- Estimated aggregate profit impact: -2.5% to -4% for affected companies
- Stock market volatility increased on tariff announcement days
Companies responded through:
- Supply chain restructuring (moving production to non-tariffed countries)
- Tariff engineering (modifying products to qualify for lower tariff classifications)
- Lobbying for exemptions (filing exclusion requests with the U.S. Trade Representative)
The Broader Economic Efficiency Loss
Beyond direct winners and losers, tariffs create deadweight loss, economic value destroyed through market distortions.
Federal Reserve economists estimated that Trump tariffs reduced U.S. GDP by 0.3-0.5%, equivalent to $60-100 billion annually.[28]
This loss occurs because:
- Resources shift to less efficient domestic production
- Consumers pay more for lower-quality substitutes
- Trade barriers prevent beneficial exchanges
- Uncertainty disrupts business investment
Internal connection: Understanding how trade policy affects business performance connects to fundamental principles of valuation and how external factors influence corporate earnings and investment returns.
The Federal Reserve publishes research on tariff economic impacts and trade policy effects.
Trump Tariffs and Inflation
The relationship between Trump tariffs and inflation demonstrates how trade policy influences overall price levels and purchasing power.
How Tariffs Contribute to Inflation
Tariffs create inflationary pressure through multiple channels:
Direct price increases — Import tariffs immediately raise costs for affected products, contributing directly to Consumer Price Index (CPI) calculations.
Input cost inflation — When tariffs apply to raw materials and components, they increase production costs across entire supply chains, affecting even domestically-produced final goods.
Reduced competition — By limiting import competition, tariffs allow domestic producers to raise prices beyond what competitive markets would support.
Wage-price spiral potential — If workers demand higher wages to offset tariff-driven price increases, this can create secondary inflationary effects.
Measured Inflation Impact
Economic studies quantified the tariff contribution to inflation:
Consumer Price Index impact: Trump tariffs added approximately 0.3-0.5 percentage points to annual inflation in 2018-2019.[29]
This may seem small, but consider the compound effect:
- On a $50,000 annual household budget, 0.5% inflation equals $250 in additional costs
- Over five years, these compounds have totaled $1,265 in cumulative higher expenses
- Combined with other inflationary pressures, tariffs contributed meaningfully to cost-of-living increases
Producer Price Index impact: Even larger effects appeared in wholesale prices, with tariffs adding 0.8-1.1 percentage points to producer inflation.[30]
This indicates businesses absorbed some tariff costs through reduced margins rather than passing everything to consumers—a hidden tax on corporate profits and shareholder returns.
Tariffs in the 2021-2026 Inflation Context
While Trump tariffs didn’t cause the significant inflation surge of 2021-2023, they:
- Created baseline price increases that persisted into subsequent years
- Reduced supply chain flexibility when pandemic disruptions occurred
- Added upward pressure during a period when inflation was already rising from other causes
- Remained in effect as additional inflationary forces emerged
⚠️ Key Insight: Tariffs raise costs even when inflation is already rising from other sources. They function as a permanent upward shift in the price level rather than a temporary spike.
The Persistent Nature of Tariff Inflation
Unlike some inflation sources, tariff-driven price increases tend to be sticky and permanent:
Reason 1: Companies rarely reduce prices after raising them, even if input costs later decline
Reason 2: Tariffs remain in place for years, providing no catalyst for price reductions
Reason 3: Consumers adjust expectations and accept new price levels as normal
Federal Reserve research found that prices for tariffed goods remained elevated 3-4 years after implementation, with no significant reversion to pre-tariff levels.[31]
Interaction with Monetary Policy
Tariff-driven inflation creates challenges for Federal Reserve policy:
- Supply-side inflation (from tariffs) doesn’t respond to interest rate increases
- Raising rates to combat tariff inflation risks an unnecessary economic slowdown
- The Fed must distinguish between demand-driven and tariff-driven price increases
In practice, the Federal Reserve largely looked through tariff inflation effects, treating them as temporary relative price adjustments rather than persistent inflation requiring monetary policy response.
However, if tariffs were substantially expanded, the inflation impact could become large enough to influence Fed decision-making.
Comparing Tariff Inflation to Other Sources
Tariff-driven inflation differs from other inflation types:
| Inflation Source | Mechanism | Fed Response | Duration |
|---|---|---|---|
| Demand-pull | Excess spending | Raise interest rates | Temporary |
| Cost-push (energy) | Supply shocks | Usually accommodate | Temporary |
| Wage-price spiral | Labor market tightness | Raise interest rates | Can persist |
| Tariff-driven | Import taxes | Usually accommodate | Persistent |
Understanding these distinctions helps explain why tariff inflation proves particularly difficult to reverse once established.
Source: Federal Reserve Bank research, Bureau of Labor Statistics data
Common Misconceptions About Trump Tariffs
Several widespread misunderstandings about Trump tariffs persist in public discourse. Clarifying these misconceptions provides a more accurate foundation for understanding trade policy.
Misconception 1: “China Pays the Tariffs”
The Reality: U.S. importers pay tariffs to U.S. Customs. Chinese exporters don’t directly pay anything to the U.S. government.
Economic studies found that Chinese export prices declined only 1-3% in response to tariffs, meaning Chinese producers absorbed minimal cost. U.S. importers and consumers bore 95-100% of the tariff burden.[33]
The confusion stems from political rhetoric versus economic mechanics. While tariffs aim to pressure China economically, the direct payment comes from American businesses and consumers.
Misconception 2: “Tariffs Always Protect Jobs”
The Reality: Tariffs may protect jobs in specific protected industries while eliminating jobs in industries that use protected products or face retaliation.
The net employment effect depends on:
- Relative size of protected versus consuming industries
- Degree of foreign retaliation
- Ability of protected industries to expand employment
- Time horizon examined
Research on Trump tariffs found that each job saved in protected industries costs approximately $900,000 in higher consumer costs—far exceeding the wages of protected workers.
More efficient job protection methods exist, including direct subsidies, training programs, or adjustment assistance.
Misconception 3: “Tariffs Reduce Prices”
The Reality: Tariffs increase prices by design. The entire mechanism depends on raising import costs to make domestic alternatives more competitive.
Some confusion arises from the idea that tariffs might eventually lead to more domestic production, which could theoretically lower prices through competition. However:
- Domestic production costs typically exceed import costs (why imports existed initially)
- Protected industries often raise prices when shielded from competition
- Empirical evidence shows persistent price increases following tariff implementation
No major economic study found that Trump tariffs reduced consumer prices in affected categories.
Misconception 4: “Trade Deficits Are Always Bad”
The Reality: Trade deficits aren’t inherently harmful and often reflect positive economic conditions.
Trade deficits occur when a country imports more goods than it exports. This can indicate:
- Strong consumer demand (healthy economy buying products)
- Attractive investment destination (capital inflows financing consumption)
- Currency strength (valuable dollar making imports affordable)
The United States has run trade deficits for 46 consecutive years while experiencing overall economic growth and rising living standards.[35]
Trade deficits become concerning when financed through unsustainable borrowing or when they reflect uncompetitive industries unable to adapt. But the deficit itself isn’t automatically problematic.
Misconception 5: “Tariffs Are Free Money for the Government”
The Reality: While tariffs generate revenue ($71 billion in 2019), they also create economic costs exceeding the revenue collected.
The net fiscal impact includes:
- Tariff revenue: +$71 billion
- Farm subsidies to offset retaliation: -$28 billion
- Economic efficiency losses: -$60-100 billion in GDP
- Reduced tax revenue from lower economic activity: -$15-20 billion estimated[36]
Therefore, tariffs often cost the government and economy more than they collect in revenue.
The Complex Reality
Trade policy involves trade-offs rather than simple wins or losses:
- Tariffs can protect specific industries while harming others
- They generate government revenue while creating economic inefficiencies
- They may achieve non-economic objectives (national security, geopolitical pressure) at economic cost
- Short-term and long-term effects often differ
Understanding these nuances enables more informed evaluation of trade policy choices.
Internal connection: Recognizing misconceptions about tariffs parallels the importance of evidence-based investing and avoiding common financial myths that can derail wealth-building strategies.
Could Trump Tariffs Return or Expand?
As of 2026, many Trump tariffs remain in effect, and the possibility of expansion or modification continues to influence market expectations and business planning.
Current Tariff Status in 2026
Tariffs still in place:
- Most Section 301 tariffs on Chinese goods (covering $370+ billion in imports)
- Steel and aluminum tariffs (25% and 10% respectively, with country-specific modifications)
- Washing machine tariffs (though reduced from initial levels)
Tariffs modified or removed:
- Some exclusions granted for specific products and companies
- Certain countries negotiated exemptions through trade agreements
- Gradual reduction of some consumer goods tariffs
The persistence of these tariffs across multiple administrations indicates bipartisan consensus on maintaining pressure on China, even as debate continues about optimal approaches.
Scenarios for Tariff Changes
Scenario 1: Expansion
If trade tensions escalate or political priorities shift, tariffs could expand through:
- Additional product categories
- Higher rates on existing tariffed goods
- New target countries beyond China
- Broader application of national security justifications
Scenario 2: Reduction/Removal
Alternatively, tariffs might decrease through:
- Negotiated trade agreements providing tariff relief
- Unilateral removal to combat inflation
- Gradual phase-out as political priorities change
- Replacement with alternative policy tools
Scenario 3: Status Quo
Current tariffs might persist indefinitely as:
- Political costs of removal (appearing “soft on China”) exceed benefits
- Affected industries and workers oppose changes
- Tariff revenue becomes embedded in budget assumptions
- No compelling crisis forces reconsideration
Market Implications of Tariff Uncertainty
Financial markets respond to tariff policy changes and expectations:
Equity markets: Tariff announcements historically triggered 1-3% single-day declines in major indices, with recovery over subsequent weeks.[37]
Sector-specific impacts:
- Industrials: Negative reaction to steel/aluminum tariffs
- Technology: Negative reaction to China’s electronics tariffs
- Agriculture: Negative reaction to retaliation threats
- Domestic steel/aluminum: Positive reaction to protective tariffs
Currency effects: Tariff escalation typically strengthens the dollar initially (safe-haven flows), then weakens it (reduced trade and growth expectations).
Volatility: The VIX (volatility index) averaged 3-5 points higher during periods of active tariff implementation compared to stable trade policy periods.[38]
Business Planning Considerations
Companies must account for tariff uncertainty in strategic planning:
Supply chain decisions: Where to source components and manufacture products depends heavily on tariff structures that may change.
Pricing strategies: How much tariff costs to pass through versus absorb affects competitive positioning.
Capital investment: Building domestic production capacity makes sense only if tariffs persist long-term.
Inventory management: Stockpiling before anticipated tariff increases or reductions creates working capital implications.
This uncertainty itself creates economic costs—delayed investments, suboptimal decisions, and risk premiums built into business planning.
Political Dynamics
Tariff policy remains politically contentious:
Arguments for maintaining/expanding:
- Pressure on China regarding trade practices and geopolitical concerns
- Protection for domestic manufacturing and workers
- Leverage in trade negotiations
- National security considerations for critical industries
Arguments for reducing/eliminating:
- Consumer price impacts and inflation concerns
- Harm to export industries is facing retaliation
- Economic efficiency losses
- Damage to relationships with allies
The political calculus weighs concentrated benefits (protected industries and workers) against diffuse costs (slightly higher prices for millions of consumers).
What Investors Should Monitor
Key indicators signaling potential tariff changes:
- Trade negotiation announcements between the U.S. and major partners
- Inflation data that might pressure policymakers to reduce tariffs
- Political campaign rhetoric and election outcomes
- Industry lobbying and exclusion requests
- Retaliation threats from trading partners
Tariff policy will likely remain a significant variable affecting corporate earnings, inflation, and market performance throughout 2026 and beyond.
Internal connection: Understanding policy uncertainty and its market impacts relates to fundamental principles of risk management and building resilient investment portfolios.
🧮 Trump Tariff Impact Calculator
Calculate how tariffs affect the final cost of imported products
📊 Impact Breakdown
Conclusion
Trump tariffs represent one of the most significant U.S. trade policy shifts in decades, with effects still reverberating through the economy in 2026. Understanding these import taxes requires moving beyond political rhetoric to examine the actual economic mechanics and impacts.
Key Conclusions from the Evidence
The math behind tariffs reveals clear patterns:
- U.S. importers and consumers pay tariffs—not foreign governments—with 80-100% cost pass-through to retail prices in most categories
- Economic impacts are mixed and uneven—some domestic producers benefit while consumers, farmers, and import-dependent businesses face higher costs.
- Net economic effect is modestly negative—efficiency losses and retaliation damage exceed benefits to protected industries, reducing GDP by 0.3-0.5%
- Inflation effects persist—tariff-driven price increases remain sticky and contribute to long-term cost-of-living increases.
- Job protection is expensive—each manufacturing job saved costs consumers approximately $900,000 in higher prices.
Actionable Insights for Investors and Consumers
For investors: Tariff policy creates sector-specific winners and losers. Monitor trade policy developments as a factor affecting:
- Corporate earnings in import-dependent industries
- Commodity prices (steel, aluminum)
- Currency movements
- Market volatility during policy announcements
For consumers: Recognize that tariffs function as a hidden consumption tax. Consider:
- Timing major purchases around anticipated tariff changes
- Evaluating product alternatives from non-tariffed sources
- Understanding that "Made in America" alternatives often cost more for reasons beyond tariffs
For business owners: Tariff uncertainty requires strategic flexibility:
- Diversify supply chains across multiple countries
- Build tariff scenarios into financial planning
- Monitor exclusion processes and trade agreement developments
- Consider the total cost of ownership, not just pre-tariff prices
The Broader Lesson
Trade policy demonstrates how government interventions create complex ripple effects through interconnected economic systems. Simple political slogans ("China will pay") rarely capture the nuanced reality of who actually bears costs and receives benefits.
Data-driven financial literacy requires examining evidence rather than accepting narratives. The empirical research on Trump tariffs consistently shows that theoretical benefits (protecting jobs, reducing deficits) proved more limited than anticipated, while costs (higher consumer prices, retaliation damage) materialized more fully.
This pattern—actual outcomes differing from political promises—appears frequently in economic policy. Applying the same analytical rigor to tariffs as to investment decisions leads to a more accurate understanding and better preparation for real-world impacts.
Next Steps for Continued Learning
To deepen understanding of how trade policy affects financial outcomes:
- Monitor tariff developments through U.S. Trade Representative announcements
- Track sector-specific impacts in industries you invest in or work within
- Study inflation data to identify tariff contributions versus other price pressures
- Examine corporate earnings calls where companies discuss tariff effects on operations
- Connect trade policy to broader concepts in risk management and portfolio construction
The principles underlying tariff analysis—examining who pays, following the money, measuring actual outcomes against promises—apply equally to evaluating any financial or economic claim.
Wealth building requires understanding the math behind money, including how government policies like tariffs affect purchasing power, investment returns, and economic growth. The evidence on Trump tariffs provides a clear case study in applying data-driven analysis to complex policy questions.
Educational Disclaimer
This article is provided for educational and informational purposes only. It does not constitute financial, investment, tax, or legal advice. The information presented represents research and analysis of publicly available data regarding trade policy and economic impacts.
Trade policy, tariffs, and their economic effects are complex subjects with ongoing academic and policy debates. The data and conclusions presented reflect current research consensus but may be subject to revision as new information becomes available.
Readers should:
- Conduct their own research and due diligence
- Consult with qualified financial, tax, and legal professionals before making decisions based on trade policy considerations.
- Recognize that past economic impacts do not guarantee future results
- Understand that individual circumstances vary significantly
The Rich Guy Math does not provide personalized investment advice or recommendations. This content aims to improve financial literacy and understanding of economic concepts through data-driven education.
About the Author
The Rich Guy Math is a financial education platform dedicated to explaining complex economic and investing concepts through clear, evidence-based analysis. Founded by Max Fonji, the platform focuses on teaching the math behind money—helping readers understand how wealth building, risk management, and economic policy actually work.
Our approach emphasizes:
- Data-driven insights from authoritative sources (Federal Reserve, SEC, academic research)
- Plain-English explanations of financial concepts without unnecessary jargon
- Cause-and-effect relationships that show why money principles work
- Evidence-based investing principles grounded in research rather than speculation
We believe financial literacy comes from understanding the underlying mathematics and logic of economic systems. Whether examining trade policy, investment strategies, or wealth-building principles, our content prioritizes clarity, accuracy, and practical application.
All content undergoes rigorous fact-checking and cites authoritative sources to ensure readers receive reliable, trustworthy information for their financial education journey.
For more data-driven financial education, visit The Rich Guy Math.
Related posts:
 What Is SmartPass? Raptor Digital Hall Pass Explained for K-12 Schools
 Why Marginal Cost Is Critical for Smart Pricing Decisions
 Types of Income: A Complete Guide to Earning and Growing Wealth
 Tax Filing: A Clear, Step-by-Step Guide for Stress-Free Taxes
 Return on Assets (ROA): Definition, Formula & How to Improve It
 How to Save Money Fast: A Smart Savings Plan That Actually Works