Picture this: You’ve just opened your brokerage account, feeling excited about your first stock purchase. Fast forward six months, and you’re staring at a portfolio down 30%, wondering what went wrong. You’re not alone—over 90% of individual investors underperform the market, and many lose significant amounts of money. But here’s the truth: most stock market losses aren’t caused by bad luck or market crashes. They’re the result of predictable, avoidable mistakes that beginners make over and over again.
Understanding why people lose money in the stock market is the first step toward protecting your hard-earned capital and building lasting wealth. This comprehensive guide reveals the most common pitfalls that drain investment accounts and, more importantly, shows you how to avoid them.
TL;DR
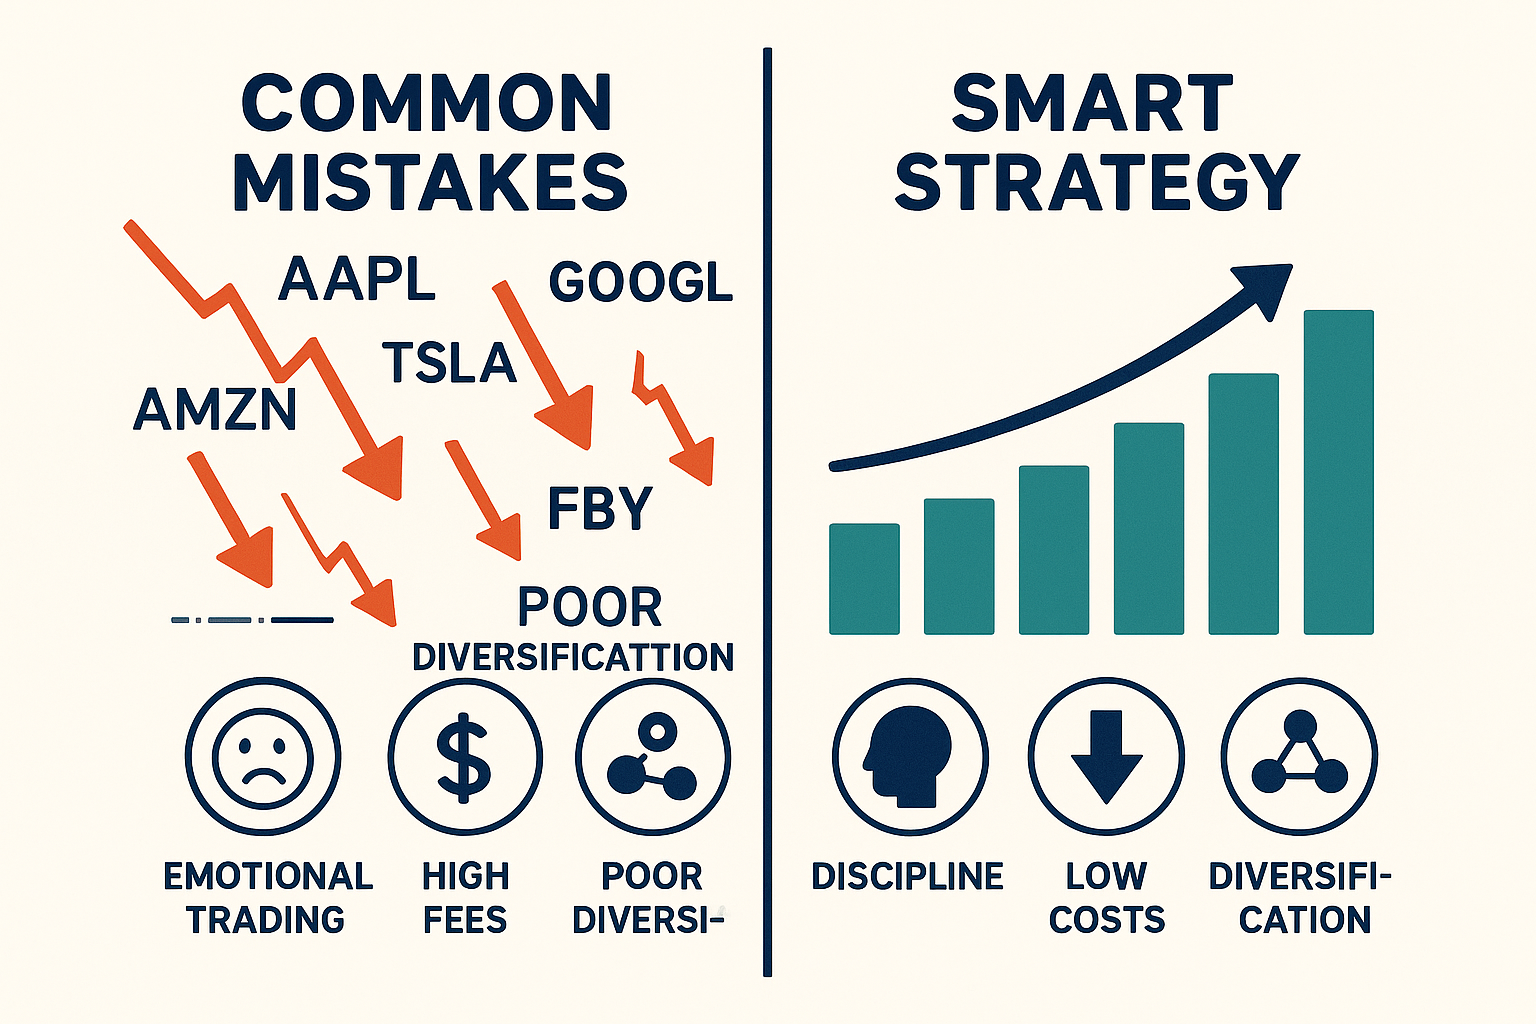
- Emotional trading is the #1 reason why people lose money in the stock market—fear and greed drive poor decisions that destroy returns
- Lack of diversification concentrates risk dangerously, making portfolios vulnerable to single-stock collapses
- Timing the market consistently fails; even professionals can’t predict short-term movements reliably
- High fees and frequent trading silently erode returns through commissions, taxes, and bid-ask spreads
- Following hot tips and hype without research leads to buying overvalued stocks at peak prices
What Does It Mean to Lose Money in the Stock Market?
In simple terms, losing money in the stock market means your investments decline in value below what you originally paid, resulting in a negative return on your capital. This can happen through:
- Capital losses: When you sell stocks for less than your purchase price
- Opportunity cost: When your investments underperform safer alternatives or market benchmarks
- Erosion from fees: When trading costs and management fees consume your returns
Understanding the mechanics of losses helps investors recognize warning signs before small mistakes become costly disasters. According to research from Morningstar, the average equity fund investor earned just 7.7% annually over the past 20 years, while the S&P 500 returned 9.5%, a gap caused primarily by poor timing and behavioral mistakes.
The Psychology Behind Stock Market Losses
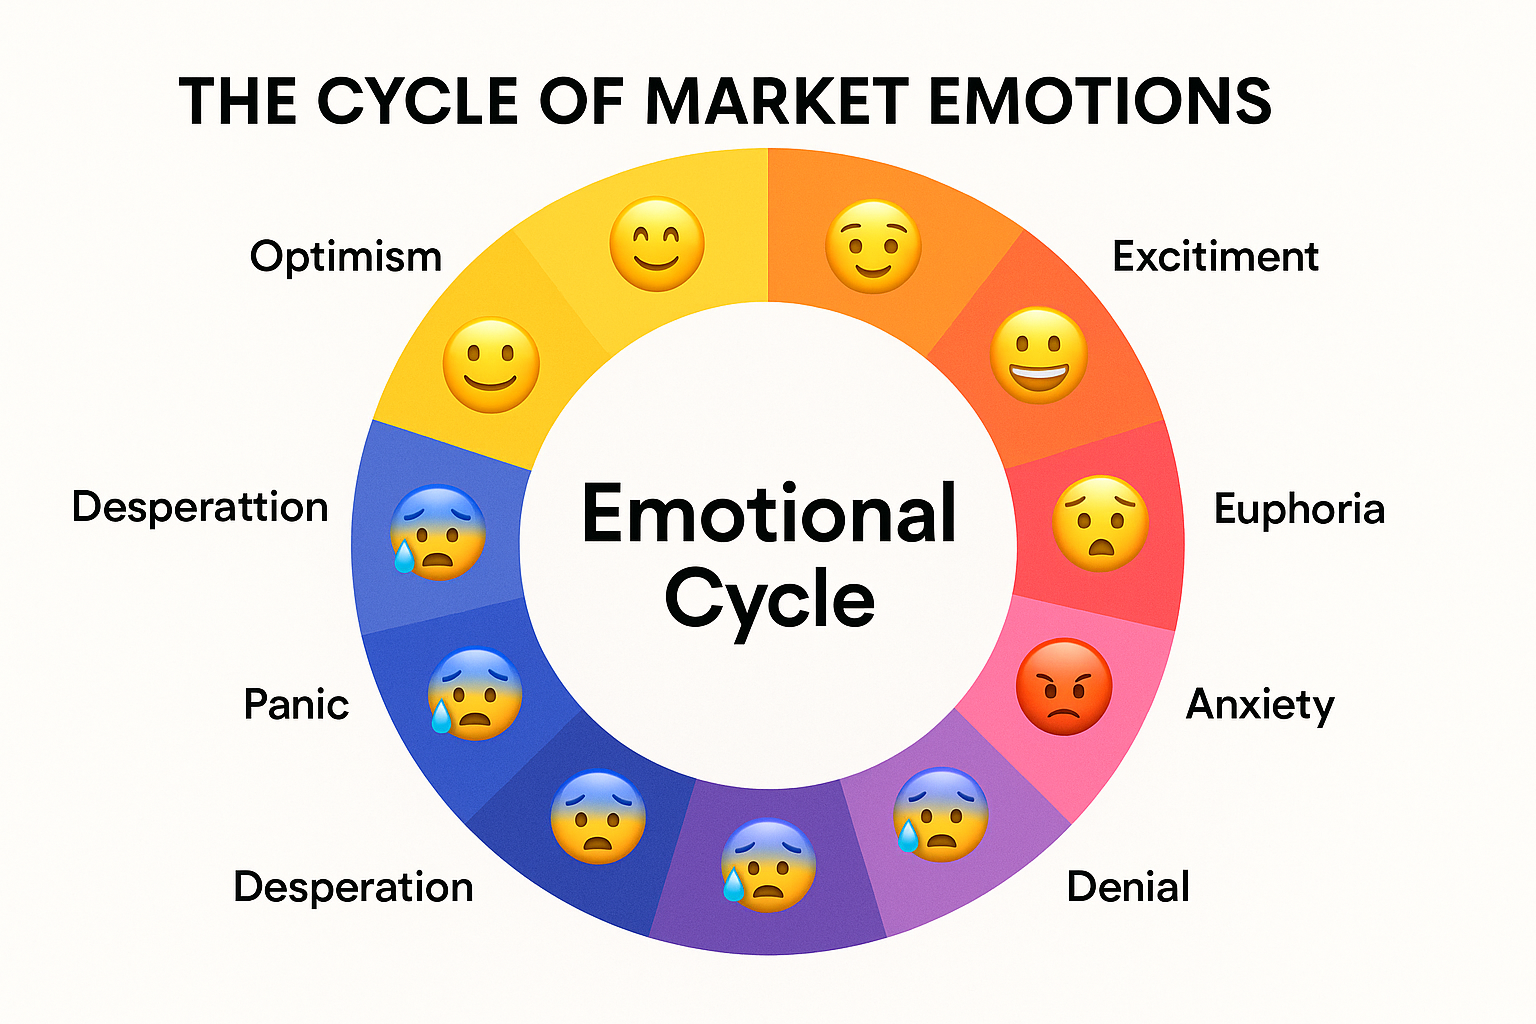
The Cycle of Market Emotions
One of the most powerful forces driving investment losses is human psychology. The cycle of market emotions describes how investors’ feelings swing from optimism to panic, often at exactly the wrong times.
Here’s how the emotional cycle destroys wealth:
- Optimism → Investors feel confident as prices rise
- Excitement → Early gains fuel overconfidence
- Thrill → Maximum bullishness at market peaks
- Euphoria → “This time is different!” mentality
- Anxiety → First signs of decline trigger worry
- Denial → “It’s just a temporary dip”
- Fear → Losses accelerate, panic sets in
- Desperation → Portfolio down significantly
- Panic → Capitulation and selling at the bottom
- Despondency → Swearing off stocks entirely
“The investor’s chief problem and even his worst enemy is likely to be himself.” — Benjamin Graham
This emotional rollercoaster explains why individual investors consistently buy high (during euphoria) and sell low (during panic), the exact opposite of successful investing.
Fear and Greed: The Twin Destroyers
Greed causes investors to:
- Chase “hot” stocks without research
- Ignore valuation fundamentals
- Concentrate positions in speculative plays
- Use excessive leverage or margin
Fear causes investors to:
- Sell quality investments during temporary downturns
- Miss recovery rallies by staying in cash
- Avoid stocks entirely after experiencing losses
- Make reactive decisions based on headlines
Both emotions override rational decision-making and lead to wealth destruction.
1: Lack of a Clear Investment Strategy
The Problem with “Winging It”
Many investors jump into the stock market without a coherent plan, essentially gambling rather than investing. Without a clear strategy, you’re vulnerable to every market whim, hot tip, and emotional impulse.
A solid investment strategy should define:
| Strategy Component | What It Answers | Example |
|---|---|---|
| Investment Goals | Why am I investing? | Retirement in 25 years, $2M target |
| Time Horizon | When will I need this money? | Long-term (20+ years) |
| Risk Tolerance | How much volatility can I handle? | Moderate (comfortable with 20% drawdowns) |
| Asset Allocation | How should I divide my portfolio? | 70% stocks, 25% bonds, 5% cash |
| Selection Criteria | What investments will I choose? | Low-cost index funds and dividend stocks |
| Rebalancing Rules | When will I adjust holdings? | Annually or when allocation drifts 5%+ |
The Cost of Not Having a Plan
Research from Dalbar’s Quantitative Analysis of Investor Behavior shows that investors without clear strategies underperform the market by an average of 3-4% annually. Over 30 years, this difference transforms $100,000 into $574,000 instead of $1,006,000—a loss of over $430,000!
Solution: Develop a written investment plan before making your first trade. Review it quarterly and adjust only when your life circumstances change, not when markets fluctuate.
2: Emotional Decision-Making
Why Emotions Sabotage Returns
Neuroscience reveals that financial losses activate the same brain regions as physical pain. This triggers our fight-or-flight response, causing us to make impulsive decisions that feel right in the moment but devastate long-term returns.
Classic emotional mistakes include:
- Panic selling during corrections: Locking in losses when markets temporarily decline
- FOMO buying: Purchasing overvalued stocks because “everyone else is making money”
- Revenge trading: Trying to quickly recoup losses through risky bets
- Anchoring: Refusing to sell losers because you’re “waiting to break even”
- Confirmation bias: Only seeking information that supports your existing positions
The Data on Emotional Trading
A study published in the Journal of Finance found that individual investors who traded most frequently earned annual returns of 6.5% less than those who traded least frequently, with emotional reactions to market movements being the primary driver.
During the March 2020 COVID-19 crash:
- The S&P 500 fell 34% from peak to trough
- Investors who panic-sold missed the subsequent 75% rally over the next 18 months
- Those who stayed invested or bought during the dip saw portfolio values reach new highs by August 2020
How to Combat Emotional Investing
Create rules-based systems: Automate investments through dollar-cost averaging
Limit portfolio checking: Review holdings monthly or quarterly, not daily
Use stop-losses wisely: Set predetermined exit points before emotions take over
Maintain an emergency fund: Having 6 months of expenses in cash prevents forced selling
Journal your decisions: Writing down your investment rationale creates accountability
Understanding what moves the stock market helps you recognize that short-term volatility is normal, not a reason to panic.
3: Poor Diversification
The “All Eggs in One Basket” Problem
Concentration might build wealth, but diversification protects it. Many investors lose money by putting too much capital into a single stock, sector, or asset class.
Real-world diversification disasters:
- Enron employees: Lost retirement savings concentrated in company stock (2001)
- Tech bubble victims: Portfolios 100% in technology stocks lost 78% (2000-2002)
- Single-stock gamblers: Tesla investors who bought at $400 in 2021 saw shares fall to $100 in 2022
The Math of Diversification
Here’s how concentration amplifies risk:
| Portfolio Type | Number of Stocks | Average Annual Volatility |
|---|---|---|
| Single stock | 1 | 45-60% |
| 5 stocks | 5 | 30-40% |
| 20 stocks | 20 | 20-25% |
| S&P 500 index | 500 | 15-20% |
The formula: Diversification reduces unsystematic risk (company-specific problems) while maintaining exposure to systematic risk (overall market returns).
Building a Properly Diversified Portfolio
A well-diversified portfolio should include:
- Multiple asset classes: Stocks, bonds, real estate, commodities
- Geographic diversity: U.S. and international markets
- Sector balance: Technology, healthcare, finance, consumer goods, etc.
- Market cap variety: Large-cap, mid-cap, and small-cap stocks
- Investment styles: Growth and value stocks
For beginners, dividend investing through diversified funds offers both income and growth while spreading risk across dozens or hundreds of companies.
“Diversification is the only free lunch in investing.” — Harry Markowitz, Nobel Prize-winning economist
4: Trying to Time the Market
The Impossible Dream
Market timing—attempting to predict when to buy low and sell high—sounds logical but proves nearly impossible in practice. Even professional fund managers with teams of analysts rarely succeed consistently.
Why timing the market fails:
- You must be right twice: When to sell AND when to buy back
- The best days are unpredictable: Missing just the 10 best trading days over 20 years reduces returns by more than 50%
- Transaction costs add up: Each trade incurs fees, spreads, and potential tax consequences
- Emotional bias: We tend to sell after declines (low) and buy after rallies (high)
The Data Against Market Timing
Research from Fidelity Investments analyzed returns from 2003-2023:
| Investment Approach | $10,000 Grew To |
|---|---|
| Stayed fully invested | $64,844 |
| Missed the 20 best days | $32,665 |
| Missed the 30 best days | $19,011 |
| Missed 30 best days | $12,917 |
Key insight: Seven of the 10 best days occurred within two weeks of the 10 worst days. Attempting to avoid bad days means you’ll almost certainly miss the best days too.
The Superior Alternative: Time IN the Market
Rather than timing the market, focus on time in the market:
- Dollar-cost averaging: Invest fixed amounts regularly regardless of market conditions
- Buy and hold: Maintain positions through market cycles
- Rebalance systematically: Adjust allocations on a schedule, not based on predictions
- Think decades, not days: Long-term trends favor patient investors
Understanding why the stock market goes up over time helps investors maintain perspective during short-term volatility.
5: Chasing Hot Tips and Trends
The Danger of “Can’t Miss” Opportunities
Social media, financial TV, and well-meaning friends constantly promote “the next big thing.” Following these tips without research is one of the fastest ways to lose money.
Common sources of bad advice:
- Social media influencers with no credentials
- TV personalities promoting stocks they own
- Reddit threads and online forums hyping “squeeze” plays
- Email newsletters promising “insider” picks
- Co-workers sharing “guaranteed” winners
Case Study: The Meme Stock Phenomenon
The 2021 meme stock craze illustrates the dangers of hype-driven investing:
- GameStop (GME): Rose from $20 to $483 in weeks, then crashed to $40
- AMC Entertainment: Surged from $2 to $72, fell back to $5
- Losses: Investors who bought near peaks lost 80-90% of their capital
While early participants made money, the majority who chased the trend after media coverage suffered significant losses.
How to Evaluate Investment Ideas
Before acting on any stock tip, ask:
Do I understand the business model?
Is the valuation reasonable compared to earnings and growth?
What is my exit strategy if I’m wrong?
Am I buying because of research or FOMO?
Does this fit my overall investment strategy?
Professional tip: If an opportunity seems too good to be true, it almost always is. Legitimate investments don’t require urgency or secrecy.
6: Ignoring Fees and Costs
The Silent Wealth Killer
Investment fees seem small—1% here, 2% there—but they compound negatively over time, destroying wealth just as surely as compound interest builds it.
Types of investment costs:
| Fee Type | Typical Range | Where It Appears |
|---|---|---|
| Expense ratios | 0.03% – 2.5% | Mutual funds and ETFs |
| Trading commissions | $0 – $10 per trade | Brokerage accounts |
| Advisory fees | 0.5% – 2% | Financial advisors |
| Bid-ask spreads | 0.01% – 0.5% | Every transaction |
| Tax drag | 15% – 37% | Capital gains and dividends |
The Long-Term Impact of Fees
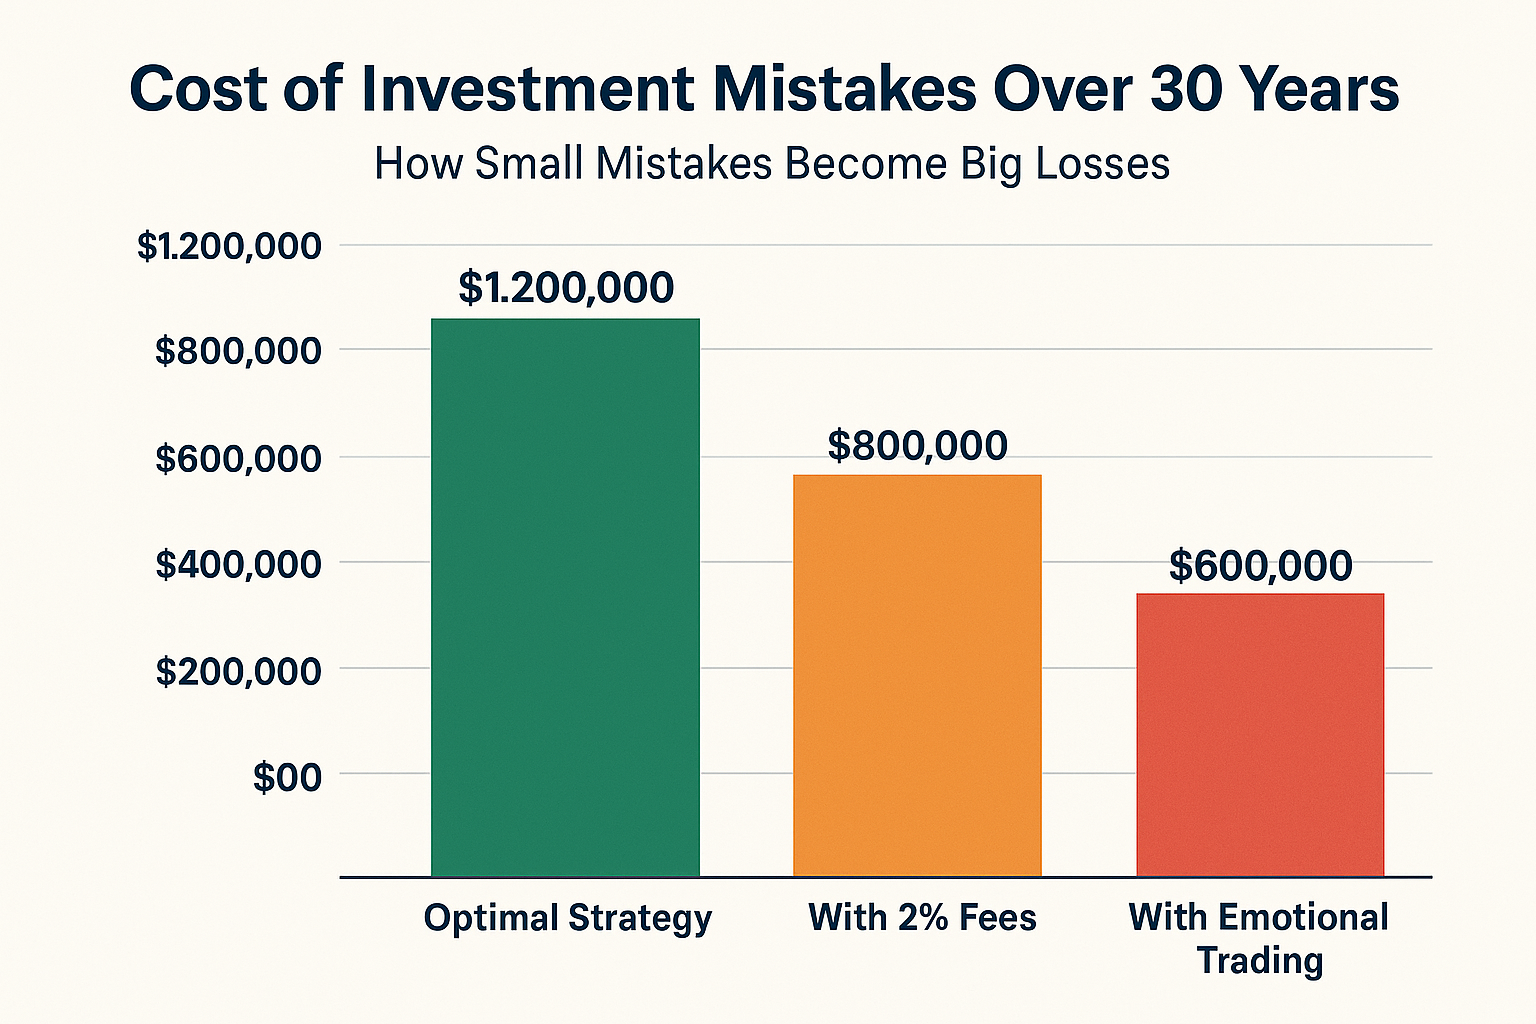
Consider two investors who each invest $10,000 annually for 30 years with 8% gross returns:
- Investor A (0.1% fees): Ends with $1,223,459
- Investor B (2% fees): Ends with $810,627
- Difference: $412,832 lost to fees!
That’s 34% less wealth for the same gross returns—the fee difference consumed over one-third of potential gains.
Minimizing Investment Costs
Strategies to keep more of your returns:
- Choose low-cost index funds: Vanguard, Fidelity, and Schwab offer funds with expense ratios below 0.10%
- Avoid frequent trading: Each transaction incurs costs and potential tax consequences
- Use tax-advantaged accounts: IRAs and 401(k)s defer or eliminate taxes
- Consider commission-free brokers: Most major brokers now offer $0 stock trades
- Tax-loss harvest: Offset gains with strategic losses to reduce tax bills
High dividend stocks can provide income, but always check the total cost of ownership, including fees and tax implications.
7: Overleveraging and Margin Trading
When Borrowed Money Backfires
Margin trading—borrowing money from your broker to buy more stocks—amplifies both gains and losses. While leverage can accelerate wealth building, it more often accelerates wealth destruction for inexperienced investors.
How margin magnifies losses:
Without margin:
- Stock falls 20%
- Your $10,000 becomes $8,000
- Loss: $2,000 (20%)
With a 2:1 margin:
- You control $20,000 in stock with $10,000 of your money
- Stock falls 20%
- Position worth $16,000, you owe $10,000 to the broker
- Your equity: $6,000
- Loss: $4,000 (40% of your capital!)
The Margin Call Nightmare
When your account value falls below the broker’s maintenance requirement, you receive a margin call demanding you either:
- Deposit more cash immediately
- Sell positions (often at the worst possible time)
During the 2008 financial crisis, margin calls forced investors to sell quality stocks at rock-bottom prices, locking in massive losses just before the recovery began.
Leverage Guidelines for Beginners
Avoid margin entirely until you have:
- At least 5 years of investing experience
- A proven track record of profitable trades
- A complete understanding of margin requirements and risks
- Sufficient capital to weather 50%+ drawdowns
Better alternatives to leverage:
- Increase your savings rate
- Invest consistently over time
- Focus on higher-returning asset classes
- Develop additional income streams through passive income strategies
8: Lack of Research and Due Diligence
Buying Blind
Many investors lose money simply because they don’t understand what they own. They buy based on price movements, headlines, or recommendations without examining the underlying business.
Essential research components:
- Financial statements: Revenue, earnings, cash flow trends
- Competitive position: Market share, competitive advantages (moats)
- Management quality: Track record, capital allocation decisions
- Valuation metrics: P/E ratio, PEG ratio, price-to-sales
- Industry dynamics: Growth trends, regulatory environment, disruption risks
The Minimum Research Checklist
Before buying any individual stock, answer these questions:
What does the company actually do?
How does it make money?
Are revenue and earnings growing or shrinking?
What is the competitive landscape?
Does it have sustainable competitive advantages?
Is the current price reasonable relative to earnings and growth?
What could go wrong with this investment?
If you can’t confidently answer these questions, you shouldn’t own the stock.
Research Resources
Free, reputable sources:
- SEC.gov — Official company filings (10-K, 10-Q)
- Morningstar.com — Stock analysis and ratings
- Investopedia — Financial education and definitions
- Company investor relations pages — Earnings calls, presentations
For those who prefer not to research individual stocks, diversified index funds offer instant diversification without requiring deep company analysis.
9: Falling for Confirmation Bias
Seeing What We Want to See
Confirmation bias is the tendency to seek, interpret, and remember information that confirms our existing beliefs while ignoring contradictory evidence. In investing, this leads to:
- Holding losing positions too long because we focus only on positive news
- Dismissing warning signs about our favorite stocks
- Following only sources that share our market outlook
- Interpreting ambiguous data as supporting our thesis
Real-World Example
Imagine you own shares of a struggling retailer:
Confirmation bias in action:
- You notice: “Same-store sales up 2% last quarter!”
- You ignore: Sales only up because of price increases; customer traffic down 15%
- You notice: “CEO says turnaround plan on track”
- You ignore: Three consecutive quarters of declining margins
- You notice: “One analyst raised price target”
- You ignore: Five analysts downgraded the stock
This selective attention keeps you invested in a deteriorating situation, resulting in avoidable losses.
Overcoming Confirmation Bias
Practical strategies:
- Actively seek contradictory opinions: Read bear cases for stocks you own
- Create decision journals: Document your thesis and revisit it objectively
- Use devil’s advocates: Ask someone to argue against your position
- Set predetermined exit criteria: “I’ll sell if X, Y, or Z happens”
- Review losers honestly: Analyze what you missed in your original analysis
“The first principle is that you must not fool yourself—and you are the easiest person to fool.” — Richard Feynman
10: Neglecting Tax Implications
The Tax Trap
Taxes can consume 15-37% of your investment gains if you’re not strategic. Many investors focus solely on gross returns while ignoring the after-tax reality.
How taxes erode returns:
| Holding Period | Tax Treatment | Rate (Federal) |
|---|---|---|
| Less than 1 year | Short-term capital gains (ordinary income) | 10% – 37% |
| More than 1 year | Long-term capital gains | 0% – 20% |
| Dividends (qualified) | Preferential rate | 0% – 20% |
| Dividends (non-qualified) | Ordinary income | 10% – 37% |
Example: A high earner in the 37% bracket who frequently trades pays 37% on short-term gains vs 20% on long-term gains—a 17-percentage-point difference!
Tax-Efficient Investing Strategies
Maximize after-tax returns:
- Hold investments longer: Qualify for long-term capital gains rates
- Use tax-advantaged accounts: IRAs and 401(k)s defer or eliminate taxes
- Asset location: Put high-turnover investments in retirement accounts, tax-efficient index funds in taxable accounts
- Tax-loss harvesting: Sell losers to offset gains and reduce tax bills
- Consider municipal bonds: Tax-free income for high earners
- Avoid unnecessary distributions: Mutual fund distributions can trigger unexpected taxes
Tax-aware investing tip: A 7% return taxed at 37% nets only 4.4%, while the same return taxed at 20% nets 5.6%—a 27% difference in after-tax wealth accumulation!
11: Overconfidence and the Dunning-Kruger Effect
When Beginners Think They’re Experts
The Dunning-Kruger effect describes how people with limited knowledge overestimate their competence. In investing, this manifests as:
- Beginners who make lucky early gains, believing they’ve “cracked the code”
- Dismissing proven strategies (like indexing) as “too simple”
- Taking excessive risks due to inflated confidence
- Ignoring professional advice and research
The Confidence-Competence Curve
Typical investor journey:
- Beginner: Low confidence, limited knowledge (appropriate caution)
- Dangerous zone: Some success → overconfidence → excessive risk-taking
- Humbling experience: Market teaches expensive lessons
- Realistic assessment: Balanced confidence based on actual competence
- Mastery: Deep knowledge with appropriate humility
Most costly mistakes happen in stage 2, when confidence exceeds competence.
The Data on Overconfidence
Studies show:
- Male investors trade 45% more than female investors due to overconfidence, reducing their returns by 2.65% annually
- Frequent traders underperform buy-and-hold investors by 6.5% annually
- Individual investors who believe they have “above average” skill earn below-average returns 80% of the time
Cultivating Appropriate Humility
Reality checks:
Track your actual returns vs. benchmarks (most investors don’t)
Study investing history—your “brilliant insight” has probably been tried and failed
Remember that professionals with decades of experience still make mistakes
Accept that you can’t predict the future with certainty
Focus on what you can control: costs, diversification, behavior
12: Following the Herd Mentality
The Comfort of Crowds
Humans are social creatures who feel safe in numbers. Unfortunately, in investing, the crowd is usually wrong at extremes—most bullish at tops and most bearish at bottoms.
Herd behavior manifestations:
- Buying popular stocks everyone is talking about (usually overvalued)
- Selling when “everyone knows” the market is going lower
- Avoiding unloved sectors even when valuations are attractive
- Investing in whatever asset class has recently performed best
Historical Examples of Herd Disasters
The Dot-Com Bubble (1999-2000)
- Herd mentality: “Internet stocks only go up”
- Peak: NASDAQ reached 5,048 in March 2000
- Result: 78% decline by October 2002
- Lesson: Following the crowd into overvalued tech stocks destroyed wealth
The Housing Bubble (2005-2007)
- Herd mentality: “Real estate never goes down.”
- Peak: Housing prices reached all-time highs in 2006
- Result: 50%+ declines in many markets
- Lesson: “Everyone” being bullish is often a warning sign
Contrarian Thinking (Done Right)
Being contrarian doesn’t mean automatically doing the opposite of the crowd. It means:
Thinking independently: Form opinions based on research, not popularity
Seeking value where others see risk: Buy quality assets when they’re unloved
Maintaining discipline: Stick to your strategy when others panic or are euphoric
Being patient: Wait for opportunities rather than chasing momentum
“Be fearful when others are greedy, and greedy when others are fearful.” — Warren Buffett
13: Ignoring Risk Management
The Missing Safety Net
Risk management isn’t about avoiding risk entirely—it’s about understanding, measuring, and controlling the risks you take. Investors who ignore risk management eventually face catastrophic losses.
Essential risk management principles:
- Position sizing: Never put more than 5-10% of your portfolio in a single stock
- Stop-losses: Predetermine exit points to limit losses
- Portfolio stress testing: Ask “What if?” scenarios (recession, inflation spike, etc.)
- Correlation awareness: Ensure your “diversified” holdings don’t all fall together
- Liquidity management: Maintain cash for emergencies and opportunities
The Risk-Reward Framework
Every investment should be evaluated through a risk-reward lens:
| Investment Type | Potential Annual Return | Potential Loss | Risk Level |
|---|---|---|---|
| FDIC savings account | 0.5% – 5% | ~0% | Very Low |
| Investment-grade bonds | 3% – 6% | -5% to -15% | Low |
| Dividend stocks | 6% – 10% | -20% to -40% | Moderate |
| Growth stocks | 8% – 15%+ | -40% to -70% | High |
| Speculative stocks | -100% to +500%+ | -100% | Very High |
Key principle: Only take risks you’re compensated for. If two investments offer similar returns, choose the one with lower risk.
Building a Risk Management Plan
Your plan should include:
- Maximum allocation to any single position (e.g., 5%)
- Maximum allocation to any sector (e.g., 25%)
- Cash reserve percentage (e.g., 5-10%)
- Rebalancing triggers (e.g., when allocation drifts 5%+)
- Exit criteria for individual holdings
- Total portfolio drawdown limit you can psychologically handle
14: Misunderstanding Volatility
Volatility ≠ Risk (But It Feels That Way)
Volatility measures price fluctuations, not permanent loss of capital. However, investors often confuse short-term price swings with actual risk, leading them to sell quality investments during temporary downturns.
The volatility paradox:
- High-quality stocks experience 20-30% drawdowns regularly
- These temporary declines feel like losses
- Investors sell to “stop the pain”
- They lock in actual losses and miss the recovery
Historical Volatility Data
The S&P 500 historical performance shows:
- Average annual return: +10.5% (1928-2025)
- Years with positive returns: 73% of the time
- Average intra-year decline: -14% (even in positive years!)
- Declines of 10%+: Occur every 1-2 years on average
- Declines of 20%+: Occur every 3-4 years on average
Critical insight: Volatility is the price you pay for higher long-term returns. Avoiding volatility means accepting lower returns.
Managing Volatility Without Selling
Instead of panic-selling during volatility:
- Adjust your asset allocation: If volatility bothers you, hold more bonds/cash
- Stop checking daily: Review your portfolio monthly or quarterly
- Focus on income: Dividend-paying stocks provide cash flow regardless of price
- Rebalance into weakness: Use volatility to buy more at lower prices
- Remember your time horizon: Short-term noise doesn’t matter for long-term goals
How to Avoid Losing Money: A Practical Action Plan
The Winning Formula
After understanding why people lose money in the stock market, here’s your comprehensive action plan to avoid these pitfalls:
Step 1: Develop Your Investment Foundation
- Define clear financial goals with specific timelines
- Determine your true risk tolerance (not what you hope it is)
- Create a written investment policy statement
- Build an emergency fund (6 months of expenses minimum)
Step 2: Choose the Right Strategy
- For most beginners: Start with low-cost index funds
- Advanced investors: Add individual stocks only after mastering fundamentals
- Consider your time commitment: Passive strategies require less maintenance
- Match strategy to personality: Active trading requires emotional discipline most lack
Step 3: Implement Smart Portfolio Construction
- Diversify across asset classes, sectors, and geographies
- Use low-cost index funds as your core holdings
- Keep individual stock positions to 5-10% maximum
- Rebalance systematically (annually or when drifts exceed 5%)
Step 4: Control Costs and Taxes
- Minimize expense ratios (target below 0.20%)
- Reduce trading frequency to minimize taxes and fees
- Maximize tax-advantaged account contributions
- Implement tax-loss harvesting in taxable accounts
Step 5: Master Your Psychology
- Create rules-based systems to remove emotion
- Limit portfolio monitoring to reduce anxiety
- Maintain a decision journal to learn from mistakes
- Find an accountability partner or join an investor community
Step 6: Commit to Continuous Learning
- Read investing classics (The Intelligent Investor, A Random Walk Down Wall Street)
- Follow reputable sources (SEC.gov, Morningstar)
- Learn from mistakes (yours and others’)
- Stay humble and question your assumptions
The Role of Professional Guidance
When to Consider Professional Help
While self-directed investing works for many, professional guidance can prevent costly mistakes:
Consider a financial advisor if you:
- Have complex tax situations
- Lack of time for investment management
- Need help with comprehensive financial planning
- Want accountability and behavioral coaching
- Have significant wealth requiring specialized strategies
Types of professional advisors:
| Advisor Type | Compensation | Best For |
|---|---|---|
| Fee-only fiduciary | Flat fee or % of assets | Unbiased advice |
| Commission-based | Product commissions | Specific product needs |
| Robo-advisor | Low % of assets | Hands-off index investing |
| CFA/CFP professional | Various models | Comprehensive planning |
Warning signs of bad advisors:
- Promising guaranteed returns
- Pushing expensive, proprietary products
- Not acting as a fiduciary
- Excessive trading or churning
- Lack of transparency about fees
Real Success Stories: Learning from Winners
What Successful Investors Do Differently
While we’ve focused on mistakes, let’s examine what successful long-term investors have in common:
Warren Buffett’s Approach:
- Invests in businesses he understands
- Holds for decades, not days
- Focuses on intrinsic value, not price movements
- Maintains significant cash reserves for opportunities
- Keeps costs minimal
Index Fund Investors:
- Accept market returns rather than trying to beat them
- Minimize costs through low-fee funds
- Rebalance systematically
- Ignore short-term noise
- Stay invested through all market conditions
Dividend Growth Investors:
- Focus on companies with sustainable competitive advantages
- Prioritize growing income over price appreciation
- Reinvest dividends during the accumulation phase
- Build portfolios that weather economic cycles
- Think in decades, not quarters
Common threads among successful investors:
- Long-term perspective (10+ years minimum)
- Emotional discipline during volatility
- Low costs and tax efficiency
- Diversification is appropriate to goals
- Continuous learning and adaptation
Conclusion: Protecting Your Capital and Building Wealth
Understanding why people lose money in the stock market is your first line of defense against becoming a cautionary tale. The good news? Nearly all the pitfalls we’ve covered are completely avoidable through education, discipline, and the right strategy.
The key takeaways to remember:
Emotional discipline beats intelligence — Your ability to control fear and greed matters more than your IQ
Costs compound negatively — Every percentage point in fees is a percentage point stolen from your future wealth
Diversification protects capital — Never bet everything on any single investment, sector, or theme
Time in the market beats timing — Long-term, patient investors consistently outperform market timers
Research prevents disasters — Understanding what you own is non-negotiable for successful investing
Your Next Steps
Ready to start building wealth while avoiding common pitfalls? Here’s your action plan:
- This week: Create your written investment policy statement defining goals, risk tolerance, and strategy
- This month: Open or optimize your brokerage account, focusing on low-cost providers
- This quarter: Build a diversified portfolio using index funds or carefully researched individual stocks
- This year: Establish systematic investing habits, review quarterly, and educate yourself continuously
Remember, successful investing isn’t about getting rich quickly—it’s about not losing money foolishly while letting compound growth work its magic over decades. The investors who protect their capital, control their emotions, minimize costs, and stay disciplined are the ones who ultimately build lasting wealth.
The stock market has created more millionaires than any other wealth-building vehicle in history. By avoiding the common pitfalls outlined in this guide, you position yourself to be among them rather than among the casualties.
Start your journey with knowledge, continue with discipline, and finish with wealth. The choice and the power are entirely yours.
References and Further Reading
Authoritative Sources:
- U.S. Securities and Exchange Commission (SEC) — Official regulatory filings and investor education
- Morningstar — Independent investment research and analysis
- Investopedia — Comprehensive financial education resource
- Dalbar’s Quantitative Analysis of Investor Behavior — Annual study of investor returns vs. market returns
- Journal of Finance — Peer-reviewed research on investor behavior and market efficiency
Recommended Reading:
- The Intelligent Investor by Benjamin Graham
- A Random Walk Down Wall Street by Burton Malkiel
- Common Stocks and Uncommon Profits by Philip Fisher
- The Little Book of Common Sense Investing by John Bogle
Interactive Stock Loss Calculator
💸 Stock Market Loss Impact Calculator
See how common investing mistakes affect your wealth over time
Investment Details
Choose a Common Mistake Scenario
Your Results
💡 Key Insight
FAQ: Why People Lose Money in the Stock Market
Emotional decision-making is the primary reason people lose money in the stock market. Fear and greed drive investors to buy high during euphoric market tops and sell low during panic-driven bottoms—the exact opposite of profitable investing. Studies show that emotional trading costs investors 3-6% annually in lost returns compared to simply holding through market cycles.
To calculate stock losses, subtract your current portfolio value from your total invested amount (including all purchases). For example, if you invested $50,000 total and your portfolio is now worth $40,000, your loss is $10,000 or -20%. Remember to include dividends received and any withdrawals in your calculation for an accurate picture. Most brokers provide this calculation automatically in your account summary.
Research suggests that 80-90% of active individual investors underperform the market over 10+ year periods, with many experiencing absolute losses. A study by the University of California found that the average individual investor earned just 4.3% annually while the market returned 8.4%—a gap of over 4% yearly. However, investors who use passive index strategies and maintain discipline have much higher success rates.
Yes, you can lose 100% of your investment if a company goes bankrupt, which is why diversification is critical. However, losing everything across a diversified portfolio is extremely unlikely. Even during the Great Depression, the stock market eventually recovered. The key is never putting all your capital in a single stock and avoiding leverage, which can amplify losses beyond your initial investment.
Beginners can avoid losses by starting with low-cost index funds, investing regularly through dollar-cost averaging, maintaining proper diversification, and avoiding emotional decisions. Focus on learning fundamentals before attempting individual stock selection, keep costs below 0.20%, maintain a long-term perspective of 10+ years, and never invest money you’ll need within five years. Most importantly, accept that volatility is normal and doesn’t require action.
Most professional traders use stop losses of 7-8% for individual stocks and 15-20% for diversified portfolios. However, for long-term investors, stop-losses can be counterproductive, forcing you to sell during temporary volatility and miss recoveries. A better approach is position sizing—never putting more than 5-10% of your portfolio in any single stock—so even if one position falls significantly, your total portfolio impact is limited.
The decision to sell or hold a losing stock should be based on fundamentals, not your purchase price. If the company’s business prospects have deteriorated or you made an analytical mistake, selling prevents further losses. However, if the business remains strong and the price decline is due to temporary market conditions, holding or even buying more may be wise. Your purchase price is irrelevant to the stock’s future performance—avoid the “anchoring” bias of waiting to “break even.”
Disclaimer
This article is for educational purposes only and does not constitute financial advice. The information provided represents general investing principles and common pitfalls but should not be considered personalized investment recommendations.
Every investor’s situation is unique, including their financial goals, risk tolerance, time horizon, and tax circumstances. Before making any investment decisions, consult with qualified financial, tax, and legal professionals who can assess your specific situation.
Past performance does not guarantee future results. All investments carry risk, including the potential loss of principal. The stock market can be volatile, and individual stocks can lose all value. Never invest money you cannot afford to lose or that you’ll need within the next 5 years.
The examples, statistics, and scenarios presented are for illustrative purposes and may not reflect actual future performance. Market conditions change, and strategies that worked historically may not work in the future.
About the Author
Written by Max Fonji — With over a decade of experience in financial markets and investing education, Max founded TheRichGuyMath.com to provide clear, data-backed investing education that cuts through the noise and delivers actionable insights.
Max’s mission is simple: help everyday investors avoid costly mistakes, build sustainable wealth, and achieve financial independence through proven, research-backed strategies. When not writing about investing, Max analyzes market trends, studies behavioral finance, and continuously seeks better ways to explain complex financial concepts in simple terms.
Connect with Max and continue your investing education at TheRichGuyMath.com for more guides on building wealth through smart investing.
Related posts:
 Dividend Portfolio: How to Build One for Steady Passive Income
 What Is Investing? A Beginner’s Guide to Building Wealth the Smart Way
 Adobe Stock: A Powerful Platform for Creators and Designers in 2025
 Best Robo-Advisors in 2026: Top Picks & Comparison
 Margin Investing: How It Works, Risks, Examples, and Smart Strategies
 Robinhood vs Fidelity: Which Brokerage Is Better for Investors?