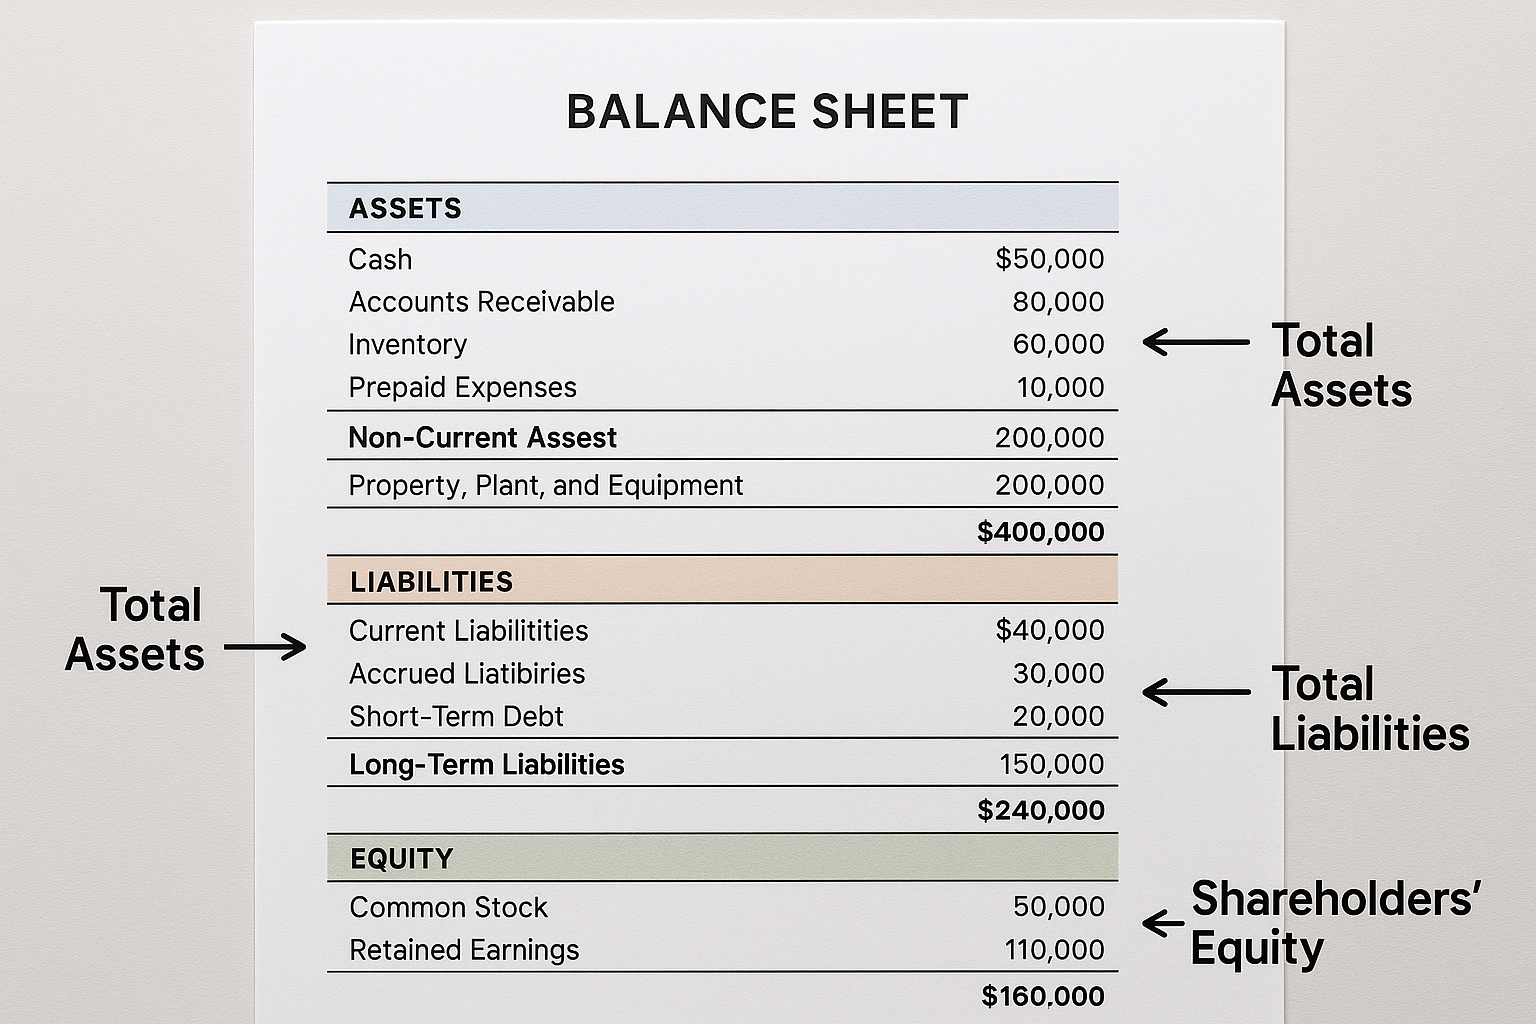
Ever wonder how companies, or even wealthy individuals, truly measure their financial health? The secret lies in a single, powerful document called the balance sheet. Think of it as a financial snapshot that reveals everything you own, everything you owe, and what’s actually yours at any given moment. Whether you’re evaluating a stock investment, managing your personal finances, or just curious about how money really works, understanding the balance sheet is your gateway to financial literacy.
TL;DR
- A balance sheet is a financial statement that shows what you own (assets), what you owe (liabilities), and your net worth (equity) at a specific point in time
- The fundamental equation is: Assets = Liabilities + Equity, which must always balance perfectly
- Assets include cash, investments, property, and anything of value you own; liabilities are debts and obligations you must pay
- Equity represents true ownership; it’s what remains after subtracting all liabilities from assets
- Reading a balance sheet helps investors evaluate company health, make smarter investment decisions, and understand why the stock market goes up over time
What Is a Balance Sheet?
In simple terms, a balance sheet is a financial statement that displays a company’s or an individual’s financial position at a specific moment in time. It’s called a “balance” sheet because it follows the fundamental accounting equation that must always balance:
Assets = Liabilities + Equity
This equation is the foundation of all accounting and finance. Think of it as a mathematical law that governs money, as unchangeable as gravity.
The balance sheet answers three critical questions:
- What do you own? (Assets)
- What do you owe? (Liabilities)
- What’s truly yours? (Equity)
Unlike an income statement that shows performance over a period (like a month or year), the balance sheet is a snapshot, like taking a photograph of your financial situation on December 31st, 2025, at midnight.
Why the Balance Sheet Matters
Understanding the balance sheet is essential for:
- Investors are evaluating whether to buy high-dividend stocks or other securities
- Business owners tracking company growth and financial stability
- Personal finance enthusiasts building wealth and achieving financial independence
- Anyone who wants to make smart moves with their money
According to the SEC (Securities and Exchange Commission), the balance sheet is one of the three required financial statements for publicly traded companies, alongside the income statement and cash flow statement.
The Three Core Components of a Balance Sheet
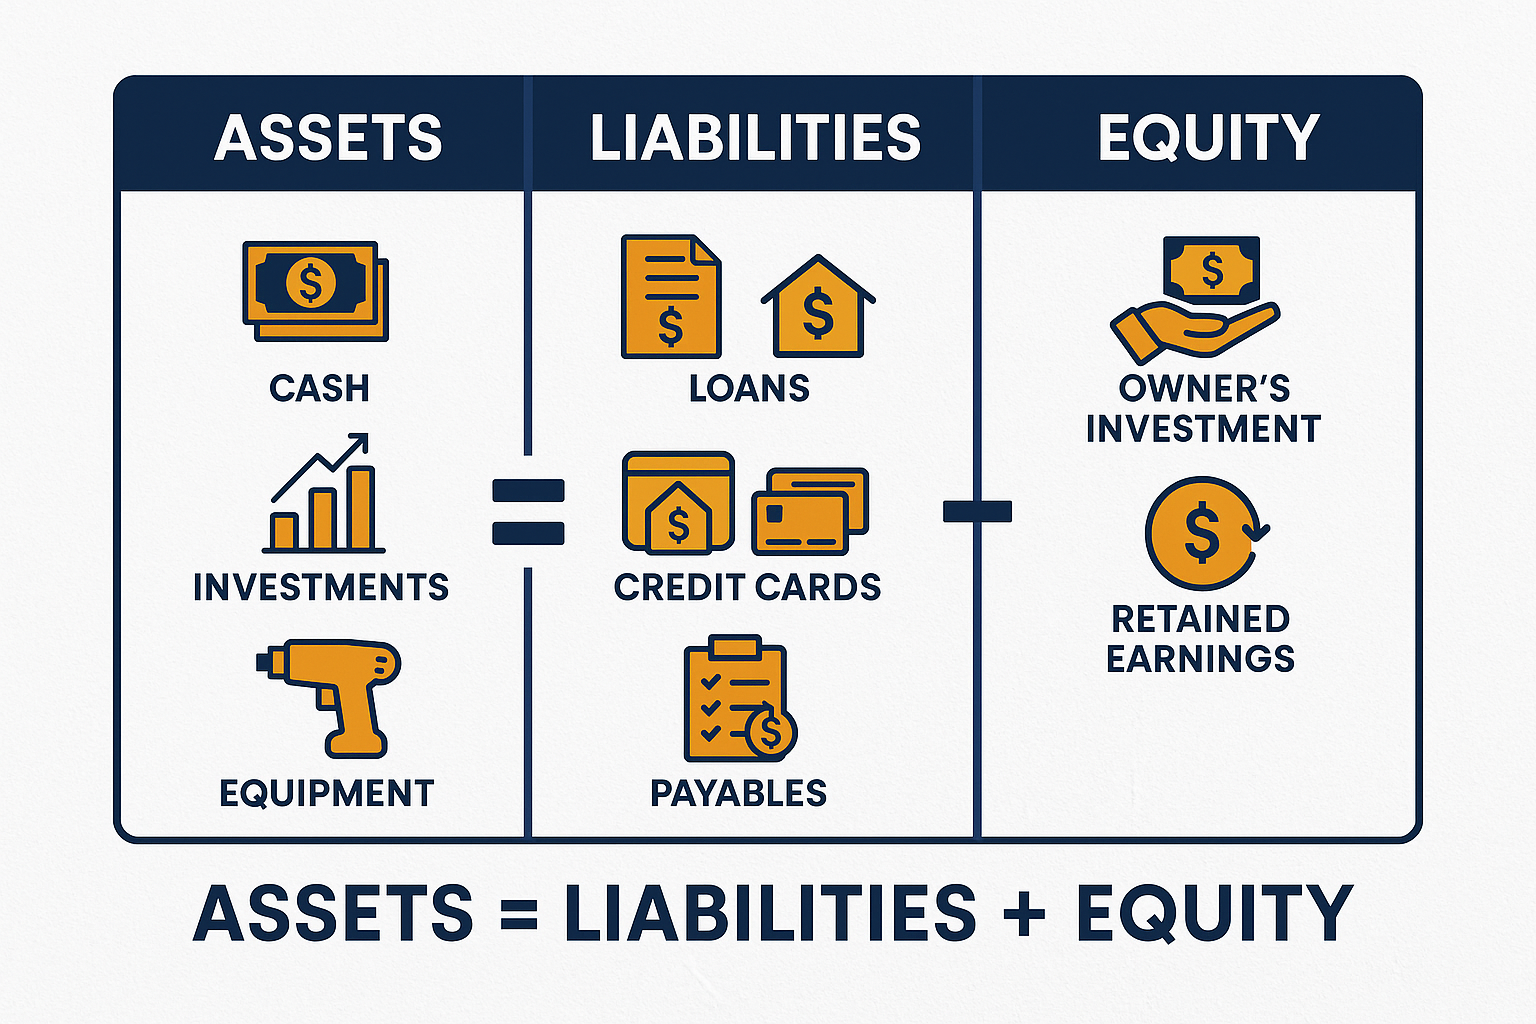
Let’s break down each section of the balance sheet in detail, using examples you can relate to.
1. Assets: What You Own
Assets are resources with economic value that you own or control, which are expected to provide future benefits.
Assets appear on the left side (or top section) of the balance sheet and are typically listed in order of liquidity, meaning how quickly they can be converted to cash.
Types of Assets
Current Assets (can be converted to cash within one year):
- Cash and cash equivalents – Money in checking accounts, savings accounts, money market funds
- Marketable securities – Stocks, bonds, and other investments you can quickly sell
- Accounts receivable – Money owed to you by customers
- Inventory – Products available for sale
- Prepaid expenses – Insurance or rent paid in advance
Non-Current Assets (long-term assets):
- Property, Plant, and Equipment (PP&E) – Buildings, machinery, vehicles, land
- Intangible assets – Patents, trademarks, copyrights, goodwill
- Long-term investments – Stocks held for years, real estate investments
- Deferred tax assets – Future tax benefits
Example: If you own a home worth $300,000, have $50,000 in your investment accounts, $10,000 in checking, and a car worth $15,000, your total assets equal $375,000.
2. Liabilities: What You Owe
Liabilities are financial obligations or debts that you owe to others and must pay back in the future.
Liabilities appear on the right side (or middle section) of the balance sheet, also organized by when they’re due.
Types of Liabilities
Current Liabilities (due within one year):
- Accounts payable – Money you owe to suppliers or vendors
- Short-term loans – Credit card debt, lines of credit
- Accrued expenses – Wages owed to employees, taxes due
- Current portion of long-term debt – The amount of your mortgage or loan due this year
Non-Current Liabilities (long-term obligations):
- Long-term debt – Mortgages, business loans, bonds payable
- Deferred tax liabilities – Taxes owed in the future
- Pension obligations – Retirement benefits owed to employees
- Lease obligations – Long-term rental commitments
Example: Using the same scenario, if you have a $200,000 mortgage, $5,000 in credit card debt, and a $10,000 car loan, your total liabilities equal $215,000.
3. Equity: What’s Truly Yours
Equity (also called shareholders’ equity, owner’s equity, or net worth) represents the residual interest in assets after deducting liabilities.
The formula for equity is: Equity = Assets – Liabilities
Equity appears on the right side (or bottom section) of the balance sheet and represents true ownership.
Components of Equity
For companies:
- Common stock – The par value of shares issued
- Retained earnings – Profits kept in the business rather than paid as dividends
- Additional paid-in capital – Money received from shareholders above par value
- Treasury stock – Company’s own shares bought back (shown as negative)
For individuals:
- Net worth – Simply assets minus liabilities
Example: With $375,000 in assets and $215,000 in liabilities, your equity (net worth) equals $160,000.
This is what you’d truly have if you sold everything and paid off all debts.
Here’s a quick comparison of assets vs liabilities:
| Aspect | Assets | Liabilities |
|---|---|---|
| Definition | Resources owned by a business that provide future economic benefit. | Obligations a business owes to others, representing future economic outflows. |
| Effect on Net Worth | Increases the company’s net worth. | Decreases the company’s net worth. |
| Examples | Cash, inventory, equipment, investments. | Loans, accounts payable, accrued expenses. |
| Financial Statement | Shown on the left side of the balance sheet. | Shown on the right side of the balance sheet. |
| Nature | Represents what the company owns. | Loans, accounts payable, and accrued expenses. |
See our full guide on the difference between assets vs liabilities
The Balance Sheet Equation: Why It Always Balances
The fundamental equation must always balance:
Assets = Liabilities + Equity
This isn’t just accounting magic; it’s logical. Everything you own (assets) was either:
- Borrowed (liabilities), or
- Purchased with your own money (equity)
Let’s verify with our example:
- Assets: $375,000
- Liabilities: $215,000
- Equity: $160,000
Check: $375,000 = $215,000 + $160,000
If the equation doesn’t balance, there’s an error somewhere. This self-checking feature makes the balance sheet incredibly reliable.
Real-World Application
When you’re evaluating stocks for investment, the balance sheet reveals:
- Financial strength – Companies with more assets than liabilities are financially stable
- Leverage – High liabilities relative to equity indicate aggressive borrowing
- Book value – Equity per share shows the theoretical value if the company were liquidated
According to Morningstar, investors who understand balance sheets make better long-term investment decisions and are less likely to lose money in the stock market.
How to Read a Balance Sheet: Step-by-Step Guide
Reading a balance sheet might seem intimidating at first, but follow these steps to decode any balance sheet like a pro.
Step 1: Check the Date
Balance sheets are dated for a specific point in time, usually the last day of a quarter or fiscal year (e.g., “As of December 31, 2025”).
This is crucial because the balance sheet can change daily. A company might have $10 million in cash on December 31st, but only $2 million on January 5th after paying suppliers.
Step 2: Review Total Assets
Start at the top and scan down the asset section:
- Note the total current assets (liquid resources)
- Check total non-current assets (long-term investments)
- Look at total assets (the sum of everything owned)
Quick analysis: Companies with high current assets relative to current liabilities have good liquidity and can handle short-term obligations.
Step 3: Examine Total Liabilities
Move to the liability section:
- Review total current liabilities (debts due soon)
- Check total non-current liabilities (long-term obligations)
- Note total liabilities (everything owed)
Quick analysis: High liabilities aren’t necessarily bad if they’re used to generate revenue, but excessive debt can be risky.
Step 4: Calculate Key Ratios
Use the balance sheet data to calculate important financial ratios:
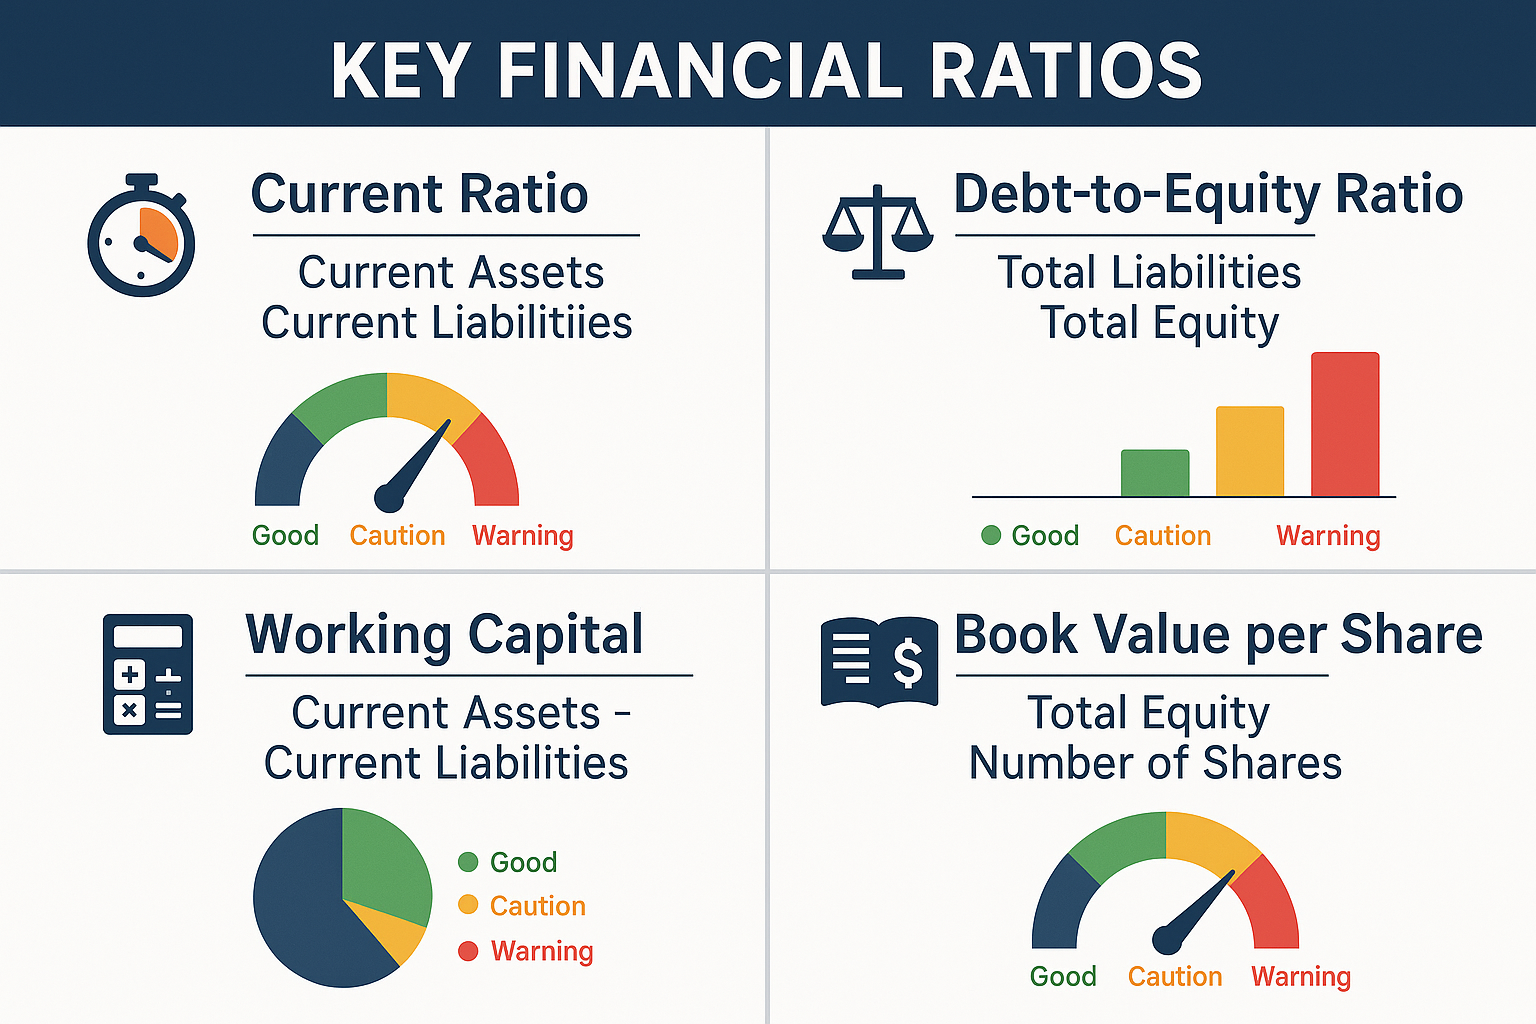
| Ratio | Formula | What It Measures |
|---|---|---|
| Current Ratio | Current Assets ÷ Current Liabilities | Short-term financial health |
| Debt-to-Equity | Total Liabilities ÷ Total Equity | Financial leverage |
| Working Capital | Current Assets – Current Liabilities | Operational efficiency |
| Book Value per Share | Total Equity ÷ Shares Outstanding | Value per stock share |
Step 5: Verify the Equation Balances
Always double-check: Assets = Liabilities + Equity
If it doesn’t balance, there’s an error in the financial statement or your calculation.
Step 6: Compare Over Time
One balance sheet tells you the current situation. Comparing multiple balance sheets (from different quarters or years) reveals trends:
- Are assets growing?
- Is debt increasing faster than equity?
- Is the company building cash reserves or depleting them?
This trend analysis is essential for making informed investment decisions.
Balance Sheet Example: ABC Corporation
Let’s examine a simplified corporate balance sheet:
ABC Corporation Balance Sheet
As of December 31, 2025
ASSETS
Current Assets:
- Cash and Cash Equivalents: $500,000
- Accounts Receivable: $300,000
- Inventory: $200,000
- Total Current Assets: $1,000,000
Non-Current Assets:
- Property, Plant & Equipment: $2,000,000
- Intangible Assets: $500,000
- Total Non-Current Assets: $2,500,000
TOTAL ASSETS: $3,500,000
LIABILITIES
Current Liabilities:
- Accounts Payable: $200,000
- Short-term Debt: $100,000
- Total Current Liabilities: $300,000
Non-Current Liabilities:
- Long-term Debt: $1,200,000
- Total Non-Current Liabilities: $1,200,000
TOTAL LIABILITIES: $1,500,000
EQUITY
- Common Stock: $500,000
- Retained Earnings: $1,500,000
TOTAL EQUITY: $2,000,000
TOTAL LIABILITIES + EQUITY: $3,500,000
| Category | Subcategory / Item | Amount ($) |
|---|---|---|
| ASSETS | ||
| Current Assets | Cash and Cash Equivalents | 500,000 |
| Accounts Receivable | 300,000 | |
| Inventory | 200,000 | |
| Total Current Assets | 1,000,000 | |
| Non-Current Assets | Property, Plant & Equipment | 2,000,000 |
| Intangible Assets | 500,000 | |
| Total Non-Current Assets | 2,500,000 | |
| TOTAL ASSETS | 3,500,000 | |
| LIABILITIES | ||
| Current Liabilities | Accounts Payable | 200,000 |
| Short-term Debt | 100,000 | |
| Total Current Liabilities | 300,000 | |
| Non-Current Liabilities | Long-term Debt | 1,200,000 |
| Total Non-Current Liabilities | 1,200,000 | |
| TOTAL LIABILITIES | 1,500,000 | |
| EQUITY | Common Stock | 500,000 |
| Retained Earnings | 1,500,000 | |
| TOTAL EQUITY | 2,000,000 | |
| TOTAL LIABILITIES + EQUITY | 3,500,000 |
Analysis of ABC Corporation
Strengths:
- Strong current ratio: $1,000,000 ÷ $300,000 = 3.33 (excellent liquidity)
- Healthy equity position: 57% of assets are equity-financed
- Positive working capital: $1,000,000 – $300,000 = $700,000
Considerations:
- Debt-to-equity ratio: $1,500,000 ÷ $2,000,000 = 0.75 (moderate leverage)
- Could use debt strategically to grow if managed properly
This company appears financially healthy and would be attractive for dividend investing.
Personal Balance Sheet: Building Your Own
You don’t need to be a corporation to benefit from a balance sheet. Creating a personal balance sheet is one of the smartest financial moves you can make.
How to Create Your Personal Balance Sheet
List Your Assets:
- Checking and savings accounts
- Investment accounts (401k, IRA, brokerage)
- Real estate (home, rental properties)
- Vehicles
- Valuable possessions (jewelry, art, collectibles)
- Business ownership
- Cash value of life insurance
List Your Liabilities:
- Mortgage(s)
- Car loans
- Student loans
- Credit card debt
- Personal loans
- Medical debt
- Taxes owed
Calculate Your Net Worth:
Net Worth = Total Assets – Total Liabilities
Example Personal Balance Sheet
John’s Personal Balance Sheet – December 31, 2025
Assets:
- Cash/Savings: $25,000
- Investment Accounts: $150,000
- Home Value: $400,000
- Car: $20,000
- Total Assets: $595,000
Liabilities:
- Mortgage: $280,000
- Car Loan: $12,000
- Credit Cards: $3,000
- Total Liabilities: $295,000
Net Worth (Equity): $300,000
Why Track Your Personal Balance Sheet
Monitoring your personal balance sheet helps you:
- Track wealth growth – Are you building net worth over time?
- Identify problem areas – Is debt growing faster than assets?
- Make better decisions – Should you pay off debt or invest?
- Set financial goals – Target specific net worth milestones
- Plan for retirement – Know exactly where you stand
According to the CFA Institute, individuals who regularly track their net worth accumulate significantly more wealth than those who don’t.
Creating this habit can help you make your kid a millionaire by teaching them financial awareness early.
Advantages and Limitations of the Balance Sheet
Advantages
1. Complete Financial Picture
The balance sheet provides a comprehensive view of financial position—everything owned and owed in one place.
2. Enables Ratio Analysis
Critical financial ratios (current ratio, debt-to-equity, etc.) can only be calculated with balance sheet data.
3. Creditworthiness Assessment
Lenders use balance sheets to determine if you or your business can handle additional debt.
4. Tracks Net Worth Growth
Comparing balance sheets over time shows whether wealth is increasing or decreasing.
5. Investment Decision Tool
Investors use balance sheets to evaluate company stability and identify smart investment opportunities.
6. Legal Requirement
Public companies must publish audited balance sheets, ensuring transparency and accountability.
Limitations
1. Point-in-Time Snapshot
The balance sheet only shows one specific moment. Financial position could change dramatically the next day.
2. Historical Cost Basis
Assets are typically recorded at purchase price, not current market value. A building bought for $1 million in 1990 might be worth $5 million today, but still shows as $1 million (minus depreciation).
3. Intangible Assets Undervalued
Brand value, customer loyalty, employee expertise—these valuable assets often don’t appear on balance sheets.
4. Doesn’t Show Profitability
The balance sheet tells you what you have, not whether you’re making money. You need the income statement for that.
5. Subject to Accounting Methods
Different depreciation methods, inventory valuation techniques, and accounting standards can make comparisons difficult.
6. Potential for Manipulation
While audited statements are reliable, creative accounting can sometimes mask problems (though this is illegal and rare in regulated companies).
Balance Sheet vs Income Statement vs Cash Flow Statement
Understanding how the balance sheet relates to other financial statements is crucial for complete financial literacy.
The Three Financial Statements Compared
| Feature | Balance Sheet | Income Statement | Cash Flow Statement |
|---|---|---|---|
| Time Period | Specific point in time | Period of time (month, quarter, year) | Period of time |
| What It Shows | Financial position | Profitability | Cash movements |
| Key Question | What do you own and owe? | Are you making money? | Where is cash coming from and going? |
| Main Components | Assets, Liabilities, Equity | Revenue, Expenses, Net Income | Operating, Investing, Financing Activities |
| Formula | Assets = Liabilities + Equity | Revenue – Expenses = Net Income | Beginning Cash + Changes = Ending Cash |
How They Connect
These three statements are interconnected:
- Net income from the income statement flows into retained earnings on the balance sheet
- Cash on the balance sheet equals the ending cash on the cash flow statement
- Depreciation reduces asset values on the balance sheet and appears as an expense on the income statement
Think of it this way:
- Balance sheet = Your financial photo album
- Income statement = Your performance video
- Cash flow statement = Your bank transaction history
Together, they provide a complete financial story. This comprehensive understanding helps investors navigate the cycle of market emotions with confidence.
How to Interpret the Balance Sheet for Investment Decisions
When evaluating investment companies, the balance sheet reveals critical insights that can make or break your returns.
Key Metrics Investors Examine
1. Working Capital
Formula: Current Assets – Current Liabilities
What it means: Positive working capital indicates the company can cover short-term obligations and operate smoothly.
Interpretation:
- Positive and growing = Healthy operations
- Negative = Potential liquidity crisis
- Declining = Operational challenges
2. Current Ratio
Formula: Current Assets ÷ Current Liabilities
What it means: Measures the ability to pay short-term debts.
Interpretation:
- Above 2.0 = Very liquid, conservative
- 1.5 to 2.0 = Healthy liquidity
- 1.0 to 1.5 = Adequate, but watch closely
- Below 1.0 = Liquidity concerns
3. Debt-to-Equity Ratio
Formula: Total Liabilities ÷ Total Equity
What it means: Shows financial leverage and risk level.
Interpretation:
- Below 0.5 = Conservative, low risk
- 0.5 to 1.5 = Moderate leverage
- Above 2.0 = High leverage, higher risk
- Above 3.0 = Very risky
(Note: Acceptable ratios vary by industry; utilities and banks typically have higher ratios)
4. Book Value per Share
Formula: Total Equity ÷ Shares Outstanding
What it means: Theoretical value of each share if the company were liquidated.
Interpretation:
- Compared to the market price
- Market price < Book value = Potentially undervalued
- Market price > Book value = Investors expect growth
5. Return on Assets (ROA)
Formula: Net Income ÷ Total Assets (uses income statement + balance sheet)
What it means: How efficiently the company uses assets to generate profit.
Interpretation:
- Above 5% = Efficient asset utilization
- Below 2% = Poor asset efficiency
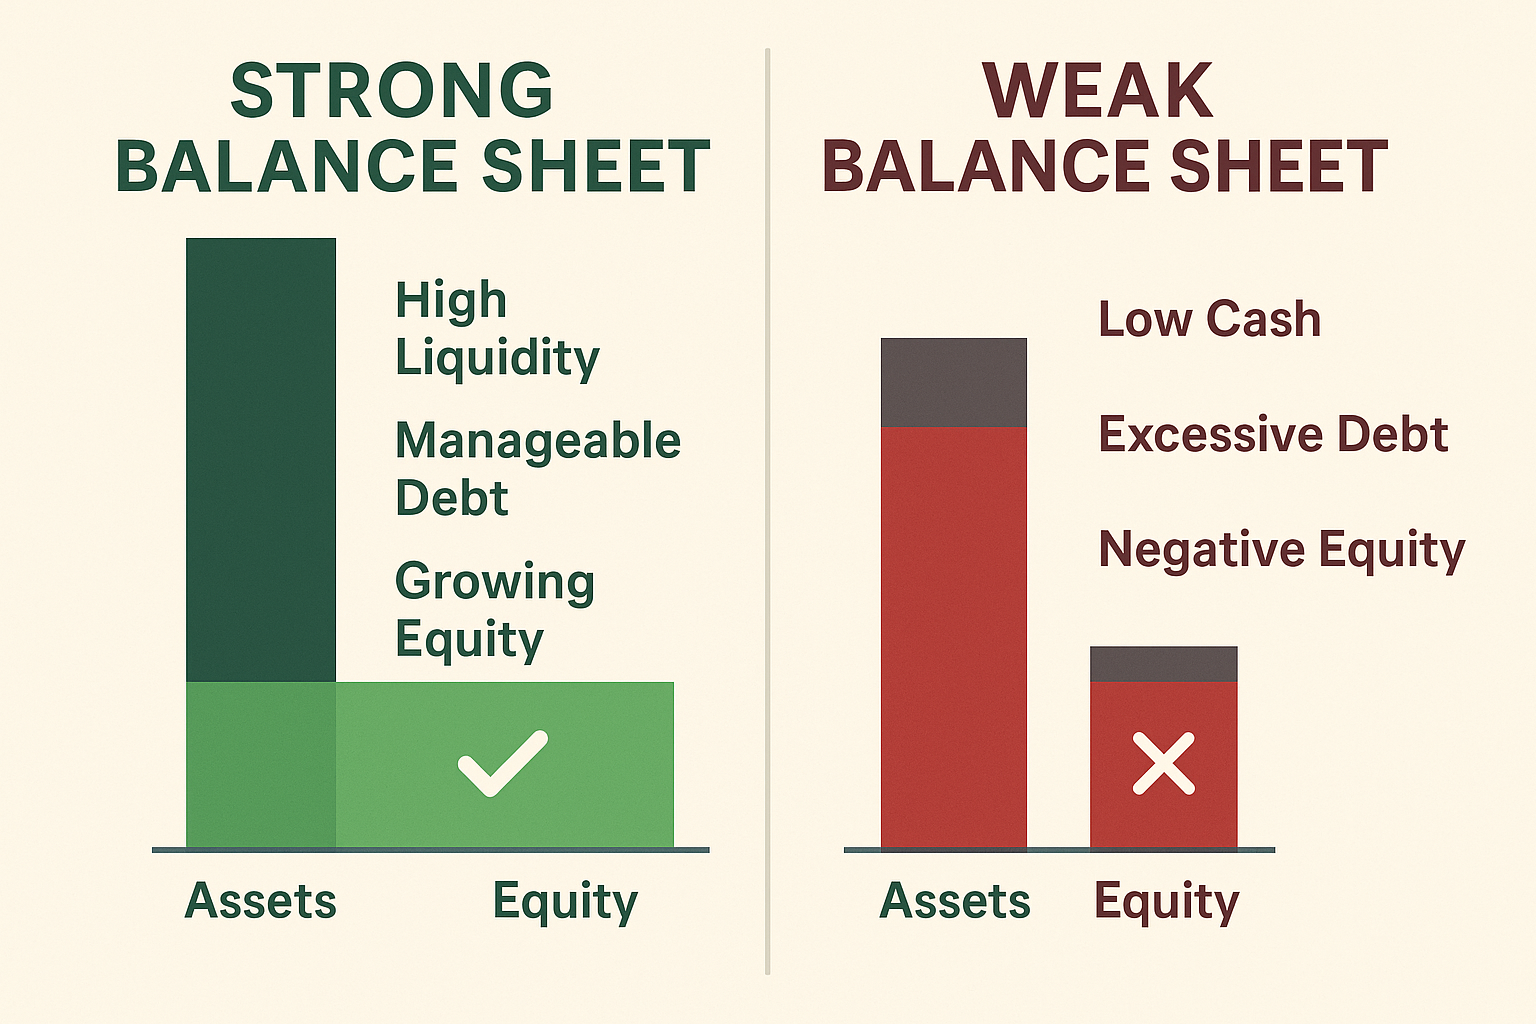
Red Flags to Watch For
When analyzing a balance sheet, these warning signs suggest trouble:
- Declining cash reserves – The Company is burning through cash
- Rising debt levels – Especially if revenue isn’t growing proportionally
- Increasing accounts receivable – Customers may not be paying
- Growing inventory – Products aren’t selling
- Negative equity – Liabilities exceed assets (insolvency)
- Frequent restatements – Suggests accounting problems
Green Flags for Strong Companies
Positive indicators include:
- Growing equity – Company building value over time
- Strong cash position – Can weather downturns
- Manageable debt – Leverage used strategically
- Valuable intangible assets – Patents, brands, intellectual property
- Consistent improvement – Year-over-year strengthening
Understanding these metrics helps you make informed decisions about passive income through dividend investing and other investment strategies.
Common Mistakes When Reading Balance Sheets
Even experienced investors make these errors. Avoid them to improve your financial analysis skills.
1: Ignoring Footnotes
The Problem: The most important information is often in the footnotes, not the main text.
Why it matters: Footnotes reveal:
- Accounting methods used
- Pending lawsuits
- Contingent liabilities
- Related party transactions
- Changes in accounting policies
Solution: Always read the notes to financial statements. They’re required by the SEC for good reason.
2: Comparing Companies in Different Industries
The Problem: A debt-to-equity ratio of 2.0 might be dangerous for a tech company but normal for a utility.
Why it matters: Different industries have different capital structures and norms.
Solution: Compare companies within the same industry and use industry-specific benchmarks.
3: Focusing Only on One Period
The Problem: A single balance sheet is just a snapshot—it doesn’t show trends.
Why it matters: A company might look healthy today, but be deteriorating rapidly.
Solution: Analyze at least 3-5 years of balance sheets to identify trends.
4: Overlooking Asset Quality
The Problem: Not all assets are created equal.
Why it matters:
- $1 million in cash is more valuable than $1 million in old inventory
- Accounts receivable from bankrupt customers aren’t really assets
- Intangible assets like “goodwill” can disappear overnight
Solution: Assess the quality and liquidity of assets, not just the total.
5: Ignoring Off-Balance-Sheet Items
The Problem: Some obligations don’t appear on the balance sheet.
Why it matters: Operating leases, special purpose entities, and other arrangements can hide significant liabilities.
Solution: Read the footnotes and management discussion sections carefully.
6: Forgetting Market Value vs. Book Value
The Problem: Balance sheet values are often historical, not current market values.
Why it matters: A company’s real estate might be worth 10x what appears on the balance sheet.
Solution: Research current market values for significant assets, especially real estate and investments.
7: Not Calculating Ratios
The Problem: Looking at raw numbers without context.
Why it matters: $10 million in debt might be manageable for one company, but crushing for another.
Solution: Always calculate key ratios (current ratio, debt-to-equity, etc.) for proper context.
Real-World Balance Sheet Examples
Let’s examine how balance sheets work in practice across different scenarios.
Example 1: Technology Startup
TechInnovate Inc. – December 31, 2025
Assets:
- Cash: $5,000,000 (from venture capital funding)
- Equipment: $500,000
- Intellectual Property: $2,000,000
- Total Assets: $7,500,000
Liabilities:
- Accounts Payable: $200,000
- Total Liabilities: $200,000
Equity:
- Common Stock: $5,000,000
- Retained Earnings: $2,300,000
- Total Equity: $7,300,000
Analysis: Strong equity position, minimal debt, high cash reserves—typical for a well-funded startup. The high equity-to-debt ratio shows conservative financing.
Example 2: Established Manufacturing Company
BuildCorp Manufacturing – December 31, 2025
Assets:
- Current Assets: $15,000,000
- Property, Plant & Equipment: $50,000,000
- Total Assets: $65,000,000
Liabilities:
- Current Liabilities: $8,000,000
- Long-term Debt: $30,000,000
- Total Liabilities: $38,000,000
Equity:
- Common Stock: $10,000,000
- Retained Earnings: $17,000,000
- Total Equity: $27,000,000
Analysis: Higher debt is typical of capital-intensive manufacturing. Debt-to-equity of 1.41 is acceptable for this industry. The current ratio of 1.88 shows good liquidity.
Example 3: Retail Chain in Trouble
RetailCo Stores – December 31, 2025
Assets:
- Cash: $500,000
- Inventory: $20,000,000 (aging)
- Fixed Assets: $10,000,000
- Total Assets: $30,500,000
Liabilities:
- Current Liabilities: $25,000,000
- Long-term Debt: $15,000,000
- Total Liabilities: $40,000,000
Equity:
- Common Stock: $5,000,000
- Retained Earnings: -$14,500,000 (negative!)
- Total Equity: -$9,500,000
Analysis: Major red flags! Negative equity means liabilities exceed assets (technically insolvent). The current ratio of 0.82 indicates an inability to pay short-term debts. This company is in serious financial distress.
The Balance Sheet in Personal Finance
While we’ve focused primarily on corporate balance sheets, the principles apply equally to personal finance—and understanding them can transform your financial life.
Building Wealth Through Balance Sheet Management
Increase Assets:
- Save consistently and build passive income streams
- Invest in appreciating assets (stocks, real estate, education)
- Start or buy businesses
- Develop valuable skills that increase earning power
Decrease Liabilities:
- Pay off high-interest debt first (credit cards)
- Refinance expensive loans to lower rates
- Avoid new consumer debt
- Use debt strategically for appreciating assets only
Grow Equity (Net Worth):
The natural result of increasing assets and decreasing liabilities is growing equity—your true wealth.
The Millionaire’s Balance Sheet Strategy
According to research from The Millionaire Next Door study, wealthy individuals focus on:
- High savings rate – Living below their means to accumulate assets
- Asset allocation – Investing heavily in appreciating assets
- Debt avoidance – Minimizing liabilities, especially consumer debt
- Net worth tracking – Regularly updating their personal balance sheet
- Long-term thinking – Making decisions that improve their balance sheet over decades
This approach aligns perfectly with strategies for making smart financial moves and building lasting wealth.
Interactive Balance Sheet Calculator
Key Risks and Common Mistakes
Understanding what can go wrong helps you avoid costly errors when analyzing or managing balance sheets.
1: Liquidity Crises
The danger: Having assets but no cash to pay immediate bills.
Example: A company might own $10 million in real estate but only $50,000 in cash. If a $1 million loan payment is due next month, they face a liquidity crisis despite being “asset rich.”
Prevention:
- Maintain adequate cash reserves (3-6 months of expenses)
- Monitor the current ratio and quick ratio
- Plan for upcoming obligations
2: Over-Leverage
The danger: Taking on too much debt relative to equity.
Example: Using debt to finance 90% of asset purchases means small asset value declines can wipe out equity entirely.
Prevention:
- Keep debt-to-equity ratios reasonable for your industry
- Ensure debt payments are covered by operating income
- Avoid borrowing for depreciating assets
3: Asset Quality Deterioration
The danger: Assets losing value or becoming uncollectible.
Example: Inventory becoming obsolete, customers defaulting on receivables, or property values declining.
Prevention:
- Regularly assess asset quality
- Write down impaired assets promptly
- Diversify asset types
4: Hidden Liabilities
The danger: Off-balance-sheet obligations that don’t appear in the financial statements.
Example: Operating lease commitments, pending lawsuits, environmental cleanup obligations, or guarantees.
Prevention:
- Read footnotes thoroughly
- Understand contingent liabilities
- Research company operations beyond the numbers
5: Accounting Manipulation
The danger: Using creative accounting to make the balance sheet look better than reality.
Example: Capitalizing expenses that should be expensed, overvaluing assets, or hiding liabilities in special purpose entities.
Prevention:
- Compare accounting policies across competitors
- Look for frequent restatements
- Trust audited statements from reputable firms
- Be skeptical of numbers that seem too good to be true
Understanding these risks helps you avoid the common pitfalls that cause people to lose money in the stock market.
Using Balance Sheet Data for Strategic Decisions
The balance sheet isn’t just for analysis; it’s a powerful tool for making strategic financial decisions.
For Investors
Buy decisions: Look for companies with:
- Strong cash positions
- Low debt-to-equity ratios
- Growing book value
- Quality assets (not just quantity)
Sell signals: Consider selling when you see:
- Deteriorating liquidity ratios
- Rapidly increasing debt
- Declining asset quality
- Negative equity trends
Portfolio allocation: Use balance sheet strength to determine position sizing—invest more in financially strong companies, less in highly leveraged ones.
For Business Owners
Growth financing: Your balance sheet determines:
- How much debt can you safely take on
- Whether equity financing makes more sense
- What collateral can you offer lenders
- Your creditworthiness
Operational decisions: Balance sheet data informs:
- Whether to lease or buy equipment
- How much inventory to carry
- Credit terms to offer customers
- Cash reserve targets
Exit planning: A strong balance sheet increases business value when selling.
For Personal Finance
Debt payoff strategy: Use your personal balance sheet to:
- Prioritize which debts to pay first
- Calculate debt-to-asset ratios
- Set net worth growth targets
- Track wealth-building progress
Investment decisions: Your balance sheet reveals:
- How much emergency fund do you need
- Whether you can afford real estate investments
- If you’re ready for retirement
- Risk capacity for investing
Financial goals: Set specific balance sheet targets:
- “Increase net worth by $50,000 this year.”
- “Reduce debt-to-asset ratio to below 30%”
- “Build liquid assets to $100,000.”
The Balance Sheet and Tax Planning
Your balance sheet has significant tax implications that smart individuals and businesses leverage.
Depreciation and Asset Values
How it works: Assets like equipment, vehicles, and buildings depreciate over time, reducing both their balance sheet value and your taxable income.
Strategy: Time major asset purchases to maximize tax benefits while maintaining accurate balance sheet values.
Debt vs Equity Financing
Tax consideration: Interest on debt is tax-deductible; dividends on equity are not.
Balance sheet impact: This makes debt more attractive from a tax perspective, but you must balance tax benefits against financial risk.
Capital Gains and Losses
Balance sheet connection: When you sell an asset above book value, you realize a capital gain (taxable). Below book value below creates a loss (potentially deductible).
Planning opportunity: Review your balance sheet to identify assets with tax-loss harvesting potential or those to hold for long-term capital gains treatment.
Estate Planning
Your balance sheet determines:
- Potential estate tax liability
- Asset distribution strategies
- Trust funding requirements
- Charitable giving opportunities
This connects to strategies for making your kid a millionaire through tax-efficient wealth transfer.
Balance Sheet Trends: What to Watch in 2025
The business and financial landscape continues evolving. Here are key balance sheet trends to monitor in 2025.
1. Cryptocurrency and Digital Assets
The change: More companies and individuals are holding Bitcoin, Ethereum, and other cryptocurrencies as assets.
Balance sheet impact: These highly volatile assets create challenges for valuation and reporting. Accounting standards are still evolving.
What to watch: How companies classify and value digital assets, and whether they’re held for speculation or utility.
2. Intangible Asset Growth
The trend: Modern companies derive more value from intangibles (software, patents, brands, data) than from physical assets.
Challenge: Traditional balance sheets undervalue these assets because they’re hard to measure.
Implication: Book value becomes less meaningful; investors must look beyond the balance sheet to assess true value.
3. Sustainability and ESG Assets
The evolution: Environmental, Social, and Governance (ESG) considerations are creating new asset categories (carbon credits, renewable energy infrastructure).
Balance sheet effect: Companies are investing heavily in sustainable assets, which may have different risk-return profiles.
Investor consideration: Balance sheets increasingly reflect ESG commitments through asset allocation.
4. Remote Work Impact
The shift: Companies are reducing office real estate and investing in technology infrastructure.
Balance sheet changes:
- Declining property, plant, and equipment
- Increasing intangible assets (software, cloud services)
- Different working capital needs
5. Supply Chain Restructuring
The trend: Companies holding more inventory and diversifying suppliers after recent disruptions.
Impact: Higher inventory levels on balance sheets, potentially affecting working capital ratios.
Analysis consideration: Evaluate whether increased inventory is strategic or problematic.
Building Your Financial Literacy Foundation
Understanding the balance sheet is a cornerstone of financial literacy, but it’s just the beginning. Here’s how to continue your education.
Recommended Learning Path
Level 1: Foundation (You are here!)
- Understand the balance sheet equation
- Identify assets, liabilities, and equity
- Create your personal balance sheet
- Calculate basic ratios
Level 2: Intermediate
- Learn to read income statements and cash flow statements
- Understand how the three statements connect
- Analyze real company financial statements
- Compare companies within industries
- Study stock market fundamentals
Level 3: Advanced
- Master financial modeling
- Understand complex accounting treatments
- Evaluate mergers and acquisitions
- Perform discounted cash flow analysis
- Develop investment strategies based on financial statement analysis
Authoritative Resources
Government and Regulatory:
- SEC.gov – Edgar database for public company filings
- FASB.org – Financial Accounting Standards Board (accounting rules)
- IRS.gov – Tax implications of balance sheet items
Educational:
- Investopedia – Comprehensive financial education
- Morningstar – Investment research and analysis
- CFA Institute – Professional investment education
Books:
- “Financial Statements” by Thomas Ittelson
- “The Interpretation of Financial Statements” by Benjamin Graham
- “Financial Intelligence” by Karen Berman and Joe Knight
Practical Application
The best way to learn is by doing:
- Create your personal balance sheet today using the calculator above
- Update it monthly for at least six months
- Analyze three public companies in an industry you’re interested in
- Compare their balance sheets and identify the strongest
- Track your favorite company’s balance sheet quarterly for a year
- Join investment communities to discuss financial analysis
This hands-on approach will deepen your understanding far more than reading alone.
FAQ
A good balance sheet shows strong liquidity, manageable debt levels, and growing equity over time. Specifically, look for a current ratio above 1.5, debt-to-equity below 1.0 (for most industries), positive working capital, and increasing retained earnings. A healthy balance sheet indicates the company or individual can meet obligations, invest in growth, and weather financial storms.
To calculate a balance sheet, list all assets, list all liabilities, and calculate equity using the formula: Equity = Assets – Liabilities. Start by categorizing assets (current and non-current) and liabilities (current and long-term). Total each category, then ensure the fundamental equation balances: Assets = Liabilities + Equity. The balance sheet always reflects a specific date.
The balance sheet shows financial position at a point in time, while the income statement shows profitability over a period of time. The balance sheet lists assets, liabilities, and equity as of a specific date. The income statement reports revenue, expenses, and net income for a month, quarter, or year. Together, they provide complementary views of financial health.
Yes, negative equity occurs when liabilities exceed assets, indicating the company or individual is technically insolvent. This happens when accumulated losses (negative retained earnings) are greater than contributed capital. Negative equity is a serious red flag suggesting financial distress, though some companies in turnaround situations or startups may temporarily show negative equity.
Update your personal balance sheet at least quarterly, or monthly if you’re actively working on financial goals. Regular updates help you track net worth growth, identify trends, and make informed financial decisions. Many wealth-building experts recommend updating on the same day each month or quarter (like the 1st or last day) for consistency.
Working capital is the difference between current assets and current liabilities, calculated as: Working Capital = Current Assets – Current Liabilities. It measures short-term financial health and operational efficiency. Positive working capital means you can cover short-term obligations and operate smoothly. Negative working capital may indicate liquidity problems.
Investors use the balance sheet to assess financial stability, evaluate risk, and determine if a company can sustain operations and pay dividends. The balance sheet reveals debt levels, asset quality, cash reserves, and overall financial strength—all critical factors in investment decisions. Strong balance sheets typically correlate with lower investment risk and better long-term returns.
Conclusion: Your Balance Sheet Journey Starts Now
The balance sheet is more than just a financial statement—it’s a powerful tool for understanding wealth, making smarter decisions, and building financial security.
Remember the key principles:
Assets = Liabilities + Equity – This equation governs all finance
The balance sheet is a snapshot – It shows one moment in time
Trends matter more than single numbers – Track changes over time
Quality beats quantity – $100,000 in cash beats $100,000 in obsolete inventory
Context is crucial – Always compare within industries and calculate ratios
Your Action Steps
This week:
- Create your personal balance sheet using the interactive calculator
- Calculate your net worth and debt-to-asset ratio
- Set a specific net worth goal for the next 12 months
This month:
- Review the balance sheets of three companies you’re considering for investment
- Read the footnotes in at least one annual report
- Start tracking your net worth monthly
This year:
- Increase your net worth by building passive income streams
- Reduce your debt-to-asset ratio by 10%
- Study smart investment strategies to grow your asset base
- Consider dividend investing to build wealth sustainably
The Bigger Picture
Understanding the balance sheet connects to everything in personal finance and investing:
- It helps you evaluate high dividend stocks for sustainable payouts
- It explains why the stock market goes up (growing corporate equity)
- It helps you navigate the cycle of market emotions with rational analysis
- It prevents you from losing money in the stock market through better company evaluation
The balance sheet is your financial compass. It shows where you are, helps you understand where you’ve been, and guides you toward where you want to go.
Start using this knowledge today. Create your balance sheet, analyze your financial position, and make the strategic decisions that will build lasting wealth. Your future self will thank you.
Disclaimer
This article is for educational purposes only and does not constitute financial advice. The information provided is based on general principles and should not be considered personalized recommendations for your specific situation. Always consult with a qualified financial advisor, accountant, or other professional before making investment or financial decisions. Past performance does not guarantee future results. Investing involves risk, including the potential loss of principal.
About the Author
Written by Max Fonji — With over a decade of experience in financial education and investment analysis, Max is your go-to source for clear, data-backed investing education. As the founder of TheRichGuyMath.com, Max is dedicated to making complex financial concepts accessible to everyone, helping readers build wealth through knowledge and smart decision-making.
