When a company needs to grow, it faces a fundamental choice: borrow money or sell ownership stakes. This decision shapes everything from bankruptcy risk to shareholder returns.
The Capitalization Ratio reveals exactly how much a company relies on debt versus equity to fund its operations. This single metric exposes financial stability, risk tolerance, and management philosophy with mathematical precision.
Understanding this ratio transforms how investors evaluate corporate health. Because companies with excessive debt face higher bankruptcy risk during economic downturns, while those with too little leverage may underperform competitors who strategically use borrowed capital to accelerate growth.
This guide breaks down the capitalization ratio formula, interpretation methods, industry benchmarks, and practical applications for building a data-driven investment strategy in 2025.
Key Takeaways
- The capitalization ratio measures total debt divided by total capitalization (debt plus equity), revealing what percentage of a company’s capital structure comes from borrowed funds
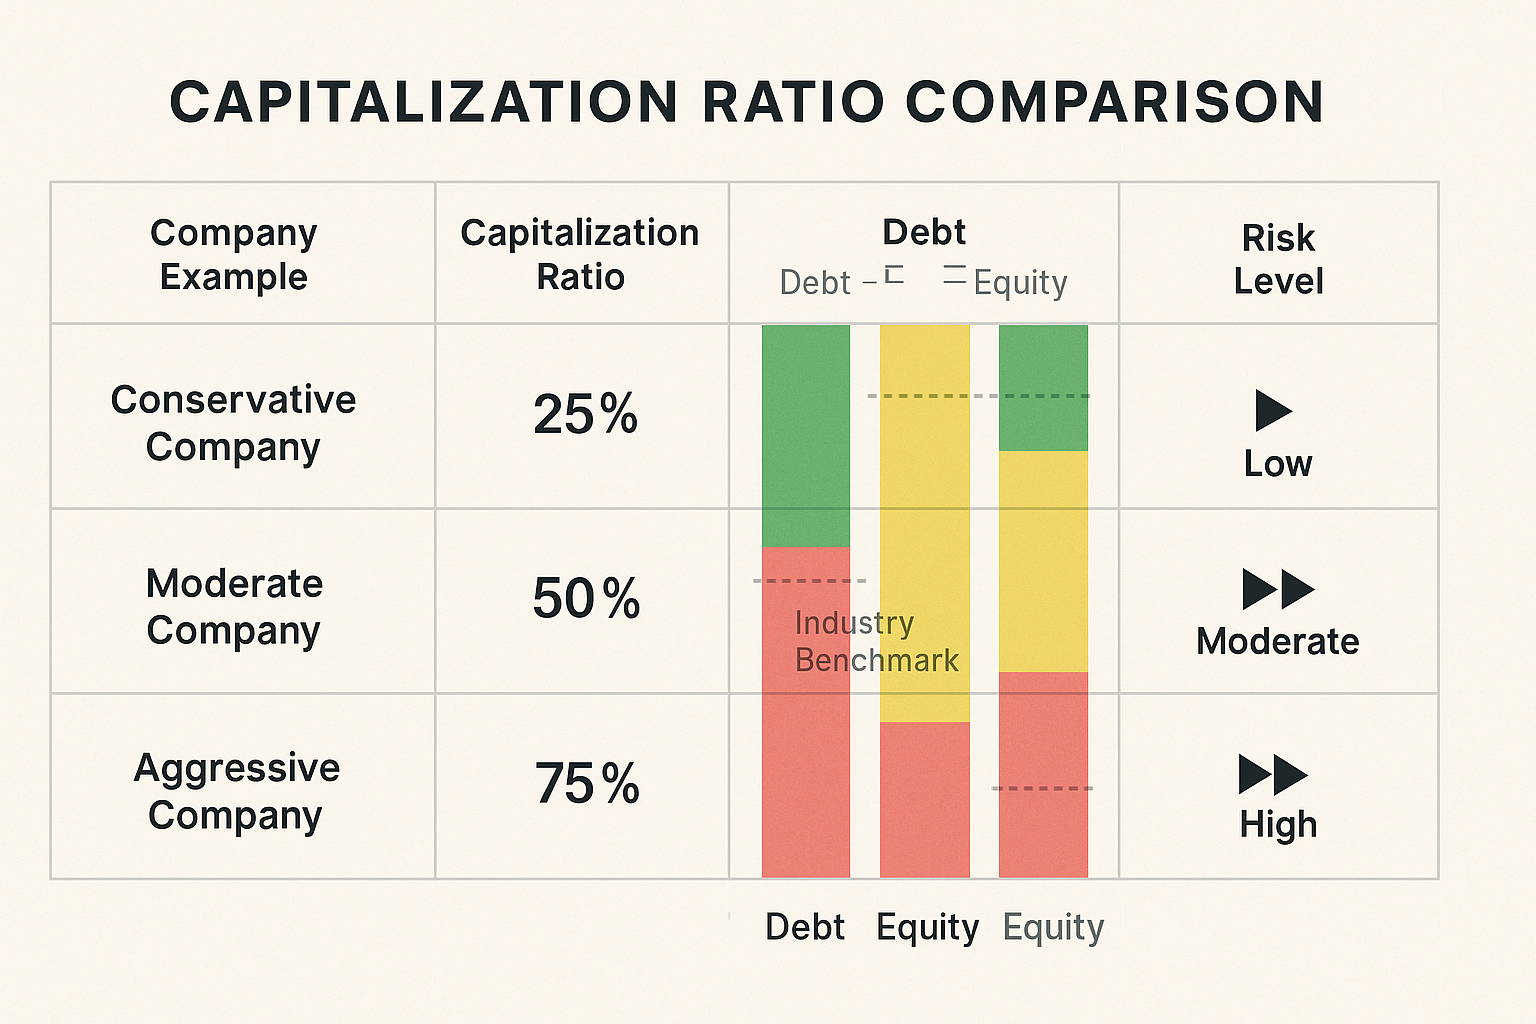
- Ratios above 50% indicate aggressive leverage, while ratios below 30% suggest conservative financing with lower bankruptcy risk
- Industry context matters critically—capital-intensive sectors like utilities average 60-70% ratios, while technology companies typically maintain 20-30%
- Rising ratios over time signal increasing financial risk, especially when combined with declining profit margins or revenue growth
- Investors should compare capitalization ratios against industry peers and historical trends to identify companies with sustainable capital structures
What Is the Capitalization Ratio?
The capitalization ratio quantifies the proportion of debt in a company’s capital structure. It answers a precise question: What percentage of total long-term financing comes from borrowed money rather than shareholder equity?
Capitalization Ratio Formula:
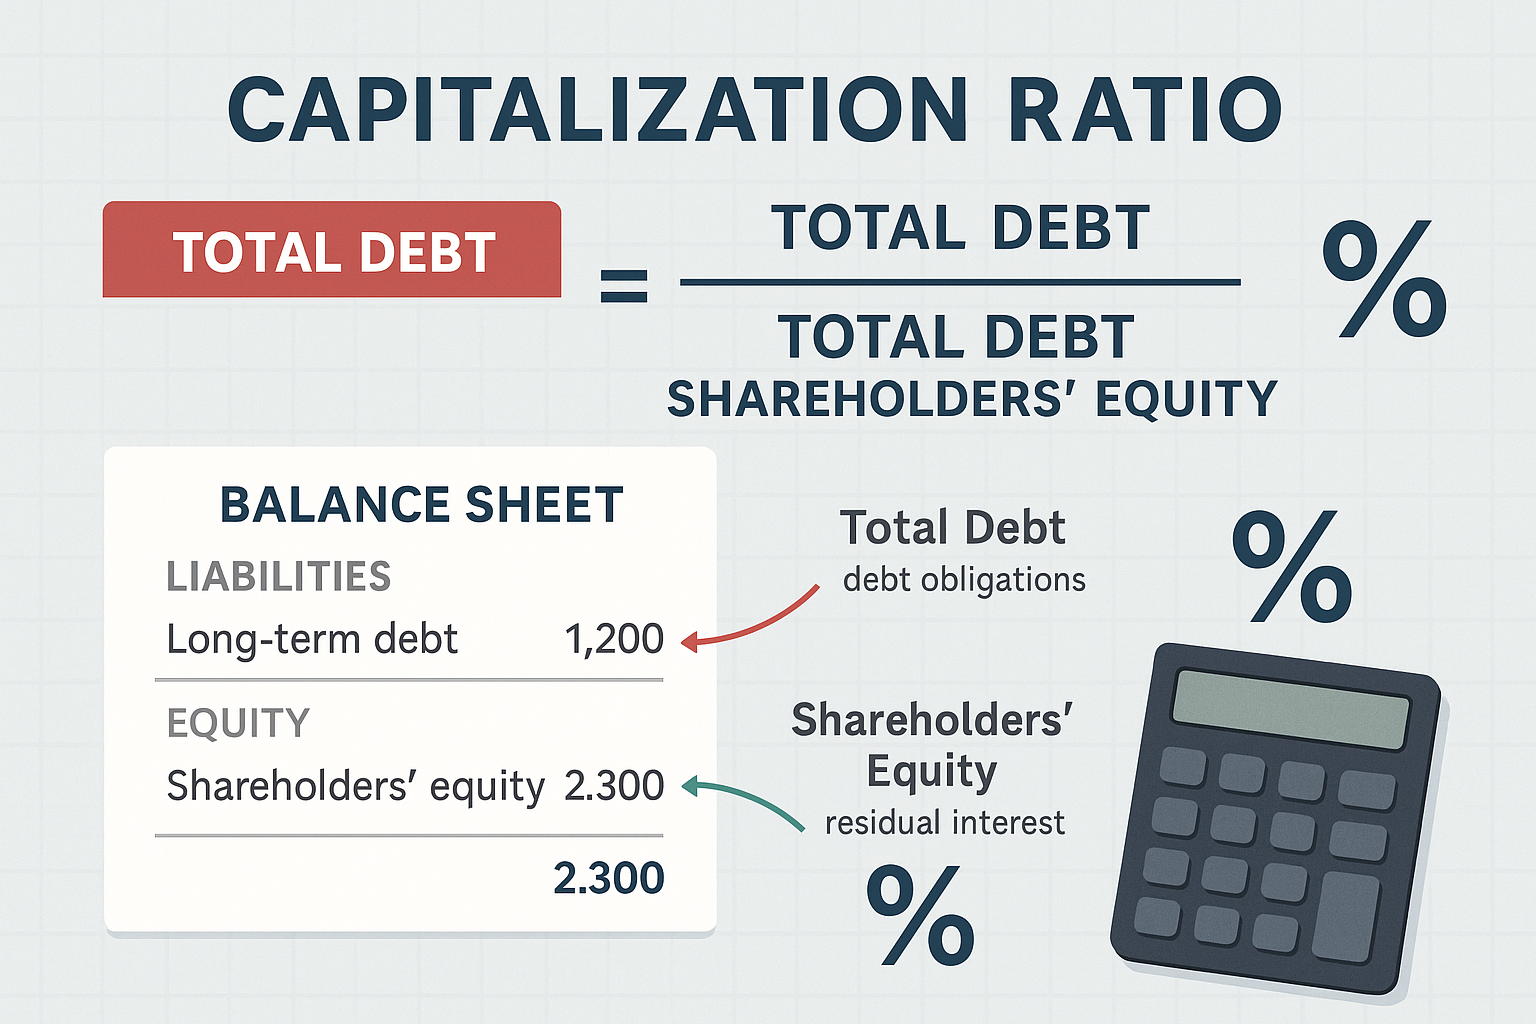
Capitalization Ratio = Total Debt / (Total Debt + Shareholders’ Equity)
Total debt includes long-term obligations like bonds, term loans, and other liabilities extending beyond one year. Shareholders’ equity represents the residual ownership value after subtracting all liabilities from assets.
The result is expressed as a percentage. A 40% capitalization ratio means debt provides 40 cents of every dollar in long-term capital, while equity provides the remaining 60 cents.
This metric belongs to the broader category of leverage ratios, financial tools that measure how companies balance borrowed capital against owner-invested capital. Similar metrics include the debt-to-equity ratio and debt ratio, each offering slightly different perspectives on financial structure.
Why This Metric Matters
Debt creates fixed obligations. Companies must pay interest regardless of profitability, and principal repayment schedules don’t pause during revenue downturns.
High capitalization ratios amplify both gains and losses. When revenue grows, leveraged companies generate higher returns on equity because they’re using borrowed money to multiply shareholder gains. When revenue contracts, those same fixed debt payments consume cash flow and threaten solvency.
The math behind money reveals a fundamental truth: Leverage magnifies outcomes in both directions.
Equity financing carries no mandatory payments. Companies can reduce or eliminate dividends during tough periods without triggering default. This flexibility provides a financial cushion during economic uncertainty.
Therefore, the capitalization ratio serves as a risk barometer. Higher ratios indicate greater financial fragility, while lower ratios suggest stability at the potential cost of slower growth.
How to Calculate the Capitalization Ratio
Calculating this metric requires three steps: identifying total debt, determining shareholders’ equity, and applying the formula.
Step 1: Find Total Debt
Locate the balance sheet in a company’s financial statements. Total debt typically includes:
- Long-term debt (bonds, term loans, mortgages)
- Capital lease obligations
- Pension liabilities (sometimes)
- Other long-term borrowings
Exclude short-term debt like credit lines, accounts payable, and current portions of long-term debt. The capitalization ratio focuses on permanent capital structure, not working capital management.
Some analysts include all interest-bearing debt. Others restrict the calculation to long-term obligations only. Consistency matters more than the specific definition; use the same approach when comparing companies.
Step 2: Determine Shareholders’ Equity
Shareholders’ equity appears on the balance sheet as:
Shareholders’ Equity = Total Assets – Total Liabilities
This represents the book value of ownership claims. It includes:
- Common stock (par value)
- Additional paid-in capital
- Retained earnings
- Treasury stock (subtracted)
- Accumulated other comprehensive income
Most financial databases report this figure directly as “Total Equity” or “Shareholders’ Equity.”
Step 3: Apply the Formula
Divide total debt by the sum of total debt and shareholders’ equity:
Capitalization Ratio = $500 million / ($500 million + $1,000 million) = 0.333 or 33.3%
This company finances 33.3% of its long-term capital through debt and 66.7% through equity.
Practical Example
Consider two hypothetical companies in the retail sector:
Company A (Conservative Capital Structure):
- Long-term debt: $200 million
- Shareholders’ equity: $800 million
- Capitalization ratio: $200M / ($200M + $800M) = 20%
Company B (Aggressive Capital Structure):
- Long-term debt: $700 million
- Shareholders’ equity: $300 million
- Capitalization ratio: $700M / ($700M + $300M) = 70%
Company B carries significantly higher financial risk. During a recession, Company B’s debt service requirements could consume most available cash flow, while Company A maintains greater flexibility.
However, if the retail sector booms, Company B’s leveraged structure could generate superior returns on equity because borrowed capital amplifies gains on the smaller equity base.
Understanding these trade-offs requires examining industry context and company-specific factors. Just as the 50/30/20 rule for budgeting provides a framework for personal finance allocation, the capitalization ratio offers a framework for evaluating corporate capital allocation decisions.
Interpreting Capitalization Ratios: What the Numbers Mean
Raw percentages mean little without context. A 60% capitalization ratio signals danger in software but normalcy in utilities.
General Benchmarks
Conservative (0-30%): Companies maintain low debt levels relative to equity. This structure provides financial stability, reduces bankruptcy risk, and preserves borrowing capacity for future opportunities. Technology companies, pharmaceutical firms, and businesses with unpredictable cash flows often adopt this approach.
Moderate (30-50%): Balanced capital structures that leverage debt’s tax advantages while maintaining reasonable safety margins. Many mature companies in stable industries operate in this range, optimizing the cost of capital without excessive risk.
Aggressive (50-70%): High leverage amplifies returns but increases vulnerability to economic downturns. Capital-intensive industries like telecommunications, utilities, and real estate commonly operate here because stable cash flows support higher debt loads.
Highly Leveraged (70%+): Extreme debt dependence that signals either strategic financial engineering or potential distress. Private equity-backed companies sometimes carry these ratios intentionally, while struggling businesses may reach this level through deteriorating equity values.
Industry Context Changes Everything
Capital intensity drives baseline expectations. Companies requiring massive infrastructure investments naturally carry more debt than asset-light businesses.
Utility companies average 60-70% capitalization ratios because:
- Regulated revenue streams provide predictable cash flow
- Physical infrastructure requires billions in capital investment
- Stable demand patterns support consistent debt service
Technology companies average 20-30% capitalization ratios because:
- Intellectual property and human capital don’t secure traditional loans
- Rapid innovation creates revenue uncertainty
- Equity financing better aligns with growth-stage risk profiles
Manufacturing companies typically range 40-50% because:
- Equipment and facilities provide collateral for borrowing
- Cyclical demand patterns require financial flexibility
- Moderate leverage optimizes capital costs
Comparing a software company’s 25% ratio against a utility’s 65% ratio reveals nothing useful. Compare within industries, not across them.
Time Trends Matter More Than Snapshots
A single ratio provides limited insight. Track changes over multiple quarters and years.
Rising capitalization ratios may indicate:
- Deliberate strategy to optimize capital structure
- Declining equity values from losses or share buybacks
- Aggressive expansion funded through borrowing
- Deteriorating financial health
Declining capitalization ratios may indicate:
- Debt repayment from strong cash generation
- Equity growth from retained earnings
- New equity issuance diluting existing shareholders
- Conservative shift in financial strategy
Context determines whether trends signal strength or weakness. A company reducing its ratio from 70% to 50% through debt repayment demonstrates improving financial health. A company dropping from 40% to 20% through equity dilution might be destroying shareholder value.
Combine capitalization ratio analysis with profitability metrics, cash flow trends, and competitive positioning. Similar to how the equity ratio provides a complementary perspective on balance sheet structure, multiple metrics together create a comprehensive understanding.
Capitalization Ratio vs. Related Metrics
Several ratios measure leverage from different angles. Understanding distinctions prevents confusion and sharpens analysis.
Capitalization Ratio vs Debt-to-Equity Ratio
The debt-to-equity ratio divides total debt by shareholders’ equity:
Debt-to-Equity = Total Debt / Shareholders’ Equity
Using the earlier example:
- Company A: $200M / $800M = 0.25 or 25%
- Company B: $700M / $300M = 2.33 or 233%
This metric expresses leverage as a ratio rather than a percentage of total capital. A 2.33 debt-to-equity ratio means Company B carries $2.33 in debt for every $1 in equity.
Key difference: Debt-to-equity can exceed 100% (and often does), while capitalization ratios max out at 100%. Both measure the same underlying concept, debt intensity, but express it differently.
Debt-to-equity ratios emphasize the multiple of debt relative to equity. Capitalization ratios emphasize the proportion of total capital from debt. Choose based on analytical preference, but maintain consistency when comparing companies.
Capitalization Ratio vs Debt Ratio
The debt ratio divides total debt by total assets:
Debt Ratio = Total Debt / Total Assets
This metric shows what percentage of assets are financed through borrowing. A 40% debt ratio means debt funds 40% of all assets.
Key difference: The denominator. Capitalization ratio uses debt plus equity (long-term capital). Debt ratio uses total assets (which equal total liabilities plus equity).
For companies with significant current liabilities like accounts payable or deferred revenue, these ratios diverge substantially.
When to Use Each Metric
Use the capitalization ratio when:
- Analyzing long-term financial strategy
- Comparing capital structure decisions
- Evaluating bankruptcy risk from permanent financing
- Assessing management’s leverage philosophy
Use debt-to-equity when:
- Emphasizing the leverage of multiple
- Comparing highly leveraged companies
- Analyzing financial engineering strategies
- Calculating weighted average cost of capital (WACC)
Use the debt ratio when:
- Evaluating total asset financing
- Analyzing asset-heavy businesses
- Comparing companies with varying current liability structures
- Assessing overall balance sheet leverage
All three metrics provide valuable perspectives. Comprehensive analysis examines multiple ratios to build a complete understanding, much like examining both assets and liabilities provides fuller balance sheet insight than either alone.
Why Companies Choose Different Capitalization Ratios
Capital structure decisions reflect strategic priorities, industry dynamics, and management philosophy.
The Tax Advantage of Debt
Interest payments are tax-deductible. Dividend payments are not.
This creates a mathematical incentive for debt financing. A company paying 5% interest in a 21% tax bracket effectively pays 3.95% after-tax cost of debt (5% × [1 – 0.21]).
Equity financing carries no tax benefit. Dividends come from after-tax profits, and capital appreciation creates tax liability for shareholders.
Therefore, Moderate debt usage reduces overall capital costs and increases after-tax returns. This explains why virtually no large company operates with zero debt; the tax code penalizes pure equity financing.
The Bankruptcy Cost of Excessive Debt
Debt creates fixed obligations. Miss an interest payment, and creditors can force bankruptcy.
Equity creates no mandatory payments. Eliminate dividends during downturns without triggering default.
As debt levels rise, bankruptcy probability increases. The expected cost of financial distress, legal fees, lost customers, and fire-sale asset prices eventually outweighs tax benefits.
Optimal capital structure balances tax advantages against bankruptcy costs. This balance varies by:
- Cash flow stability: Predictable revenue supports higher debt
- Asset tangibility: Physical collateral enables more borrowing
- Growth opportunities: Rapid expansion requires financial flexibility
- Industry norms: Competitive dynamics influence acceptable leverage
Strategic Considerations
Growth-stage companies typically maintain low capitalization ratios because:
- Unpredictable cash flows make debt service risky
- Equity investors accept volatility in exchange for upside potential
- Borrowing capacity should be preserved for unexpected needs
Mature companies often increase capitalization ratios because:
- Stable cash flows support reliable debt service
- Slower growth reduces the need for financial flexibility
- Optimizing capital structure maximizes shareholder returns
Cyclical companies generally maintain moderate ratios because:
- Revenue volatility requires a cushion for downturns
- Excessive leverage amplifies cyclical distress
- Access to capital during recessions becomes critical
Regulated utilities operate with high ratios because:
- Monopoly status ensures stable revenue
- Rate structures often guarantee returns on capital
- Physical infrastructure requires massive borrowing
Management philosophy matters enormously. Conservative executives prioritize survival and stability. Aggressive executives maximize returns through leverage. Neither approach is inherently superior; context determines appropriateness.
Understanding these strategic choices helps investors evaluate whether a company’s capitalization ratio aligns with its competitive position and growth stage, similar to how capital allocation strategies reveal management priorities.
Using Capitalization Ratios in Investment Analysis
Investors deploy this metric to identify financial risks, compare competitive positions, and predict future performance.
Red Flags to Watch
Rising ratios with declining profitability: A company increasing debt while profits shrink faces a dangerous spiral. Deteriorating operations combined with growing fixed obligations often precede financial distress.
Ratios significantly above industry peers: Outliers deserve scrutiny. Either management pursues a differentiated strategy with a clear rationale, or the company faces competitive pressures forcing excessive leverage.
High ratios in cyclical industries: Leverage amplifies cyclical swings. Companies with 60%+ ratios in sectors like automotive, construction, or commodities face severe stress during downturns.
Rapidly changing ratios: Sudden shifts, up or down, signal major strategic changes or financial events. Investigate the cause: acquisitions, restructuring, equity raises, or operational deterioration.
Green Flags to Seek
Stable ratios over multiple cycles: Consistency suggests disciplined capital management and sustainable strategy. Companies maintaining target ranges through economic ups and downs demonstrate financial maturity.
Ratios aligned with industry leaders: Matching successful competitors’ capital structures indicates competitive awareness and appropriate risk management.
Declining ratios from debt repayment: Companies generating sufficient cash flow to reduce leverage demonstrate operational strength and improved financial flexibility.
Moderate ratios with strong cash flow: The combination of reasonable leverage and robust cash flow generation provides both stability and growth capacity.
Comparative Analysis Framework
Step 1: Identify the company’s current capitalization ratio
Step 2: Calculate the ratio for 3-5 direct competitors
Step 3: Determine industry average from sector data
Step 4: Track the company’s ratio over 5-10 years
Step 5: Analyze trends relative to profitability, revenue growth, and market conditions
Step 6: Assess whether the current ratio positions the company for success or stress
This systematic approach reveals whether management makes prudent capital structure decisions or takes excessive risks.
Integration with Other Metrics
Capitalization ratios gain power when combined with complementary metrics:
- Interest coverage ratio: Can the company afford its debt service?
- Return on equity: Does leverage amplify shareholder returns?
- Free cash flow: Can operations support debt obligations?
- EBITDA margins: Do profit levels justify leverage?
A company with a 60% capitalization ratio, 8x interest coverage, and strong free cash flow presents far less risk than a company with a 40% ratio, 2x coverage, and weak cash generation.
Context always matters. Numbers without narrative mislead. Narrative without numbers deceives. Combine both for evidence-based investing decisions.
Just as understanding accounting profit versus economic profit reveals true value creation, examining capitalization ratios alongside profitability and cash flow metrics exposes genuine financial health.
Industry-Specific Capitalization Ratio Benchmarks
Different sectors operate with vastly different capital structures based on business model fundamentals.
Capital-Intensive Industries (High Ratios)
Utilities (60-70%):
Electric, gas, and water companies require massive infrastructure investments in power plants, pipelines, and distribution networks. Regulated monopolies with predictable cash flows support high leverage. Stable customer bases and government-approved rate structures enable reliable debt service.
Telecommunications (55-65%):
Network infrastructure demands billions in capital expenditure. Recurring subscription revenue provides stable cash flow. Spectrum licenses and physical assets secure borrowing. Mature market positions justify aggressive leverage.
Real Estate (50-70%):
Property values provide direct collateral for mortgages. Rental income creates a predictable cash flow. Tax advantages of real estate debt financing encourage high leverage. REITs commonly operate at the higher end of this range.
Moderate Leverage Industries (Medium Ratios)
Manufacturing (40-50%):
Equipment and facilities provide borrowing collateral. Cyclical demand patterns require financial flexibility. Moderate leverage balances capital efficiency with recession resilience. Automotive, industrial, and consumer goods companies typically operate here.
Retail (35-45%):
Inventory and real estate support borrowing capacity. Consumer spending volatility demands a cushion for downturns. Successful chains optimize leverage while maintaining crisis reserves. E-commerce shifts are reducing physical asset bases and average ratios.
Healthcare (30-40%):
Medical equipment and facilities enable moderate borrowing. Regulatory uncertainty and reimbursement risks limit optimal leverage. Pharmaceutical companies skew lower due to R&D intensity and patent risks.
Low Leverage Industries (Low Ratios)
Technology (20-30%):
Intellectual property and human capital don’t secure traditional loans. Rapid innovation creates revenue uncertainty. Equity financing aligns with growth-stage risk profiles. Cash-rich tech giants often carry minimal debt despite massive borrowing capacity.
Biotechnology (10-25%):
Pre-revenue companies rely almost exclusively on equity. Clinical trial risks make debt financing impractical. Even profitable biotech firms maintain conservative structures due to patent cliffs and regulatory uncertainties.
Professional Services (15-30%):
Asset-light business models provide limited collateral. Human capital represents primary value. Client relationship risks limit debt capacity. Consulting, legal, and accounting firms operate with minimal leverage.
Why These Differences Exist
Asset tangibility: Physical assets secure loans. Intangible assets don’t.
Cash flow predictability: Stable revenue supports fixed obligations. Volatile revenue requires flexibility.
Regulatory environment: Monopolies and regulated industries can sustain higher leverage.
Growth stage: Mature industries optimize capital structure. Growth industries prioritize flexibility.
Competitive dynamics: Capital requirements for market entry influence industry-wide leverage norms.
Investors must calibrate expectations to industry fundamentals. A 50% ratio signals conservatism in utilities but aggression in software. Context transforms numbers into insights.
Limitations and Considerations
Like all financial metrics, capitalization ratios have blind spots and potential misinterpretations.
Book Value vs. Market Value
Balance sheets report book values—historical costs adjusted for depreciation and accounting rules. Market values—what assets or equity would fetch in actual transactions—often differ dramatically.
A company with $1 billion in book equity might have $3 billion in market capitalization. Using book values understates the true equity cushion and overstates financial risk.
Some analysts calculate market-value capitalization ratios using market capitalization instead of book equity. This approach better reflects economic reality but introduces stock price volatility into capital structure analysis.
No universal standard exists. Specify which approach you’re using and maintain consistency when comparing companies.
Off-Balance-Sheet Financing
Operating leases, joint ventures, and special purpose entities can hide substantial obligations. Companies sometimes structure financing to avoid balance sheet recognition, making capitalization ratios appear healthier than economic reality.
Recent accounting changes (ASC 842, IFRS 16) now require lease capitalization, improving transparency. However, other off-balance-sheet arrangements persist.
Thorough analysis examines footnotes, management discussion, and adjusted metrics that capitalize operating leases and other hidden obligations.
Equity Accounting Complications
Share buybacks reduce equity without changing debt, artificially inflating capitalization ratios. A company repurchasing $200 million in stock increases its ratio even though financial risk hasn’t meaningfully changed.
Accumulated losses can create negative equity, making the ratio calculation meaningless or producing nonsensical results. Distressed companies often exhibit this characteristic.
Goodwill and intangible assets inflate book equity with assets of questionable liquidation value. During distress, these assets evaporate while debt remains, creating hidden leverage.
Industry Classification Challenges
Diversified conglomerates operate across multiple sectors with different optimal capital structures. Comparing General Electric against pure-play utilities or pure-play industrial companies creates apples-to-oranges comparisons.
Business model evolution can shift appropriate benchmarks. Amazon began as a retailer but evolved into a technology and cloud computing company. Historical retail benchmarks no longer apply.
Timing and Seasonality
Balance sheet snapshots capture single moments. Companies with seasonal businesses or recent major transactions may show unrepresentative ratios.
A retailer photographed after Christmas inventory buildup shows different leverage than the same company in February after inventory liquidation.
Average ratios over multiple quarters smooth these distortions and provide more reliable pictures of structural capital allocation.
The Ratio Ignores Cost of Capital
A 50% capitalization ratio financed at 3% interest differs fundamentally from a 50% ratio financed at 8% interest. The metric measures the quantity of leverage, not the quality or cost.
Comprehensive analysis examines interest rates, maturity schedules, covenant restrictions, and refinancing risks alongside simple ratio calculations.
Understanding these limitations prevents overreliance on any single metric. Financial analysis requires triangulation across multiple measures, much like understanding both APY and APR provides a fuller picture of borrowing costs than either alone.
📊 Capitalization Ratio Calculator
Calculate your company’s leverage and financial risk
Practical Steps for Investors
Incorporating capitalization ratio analysis into investment decisions requires a systematic process.
Step 1: Establish Industry Baseline
Research typical ratios for the target company's sector. Use industry reports, competitor analysis, and financial databases to determine normal ranges.
Sources include:
- Morningstar industry data
- S&P Capital IQ sector averages
- Bloomberg industry statistics
- Company 10-K filings with peer comparisons
Step 2: Calculate Historical Trends
Pull 5-10 years of balance sheet data. Calculate capitalization ratios for each year. Plot the trend line.
Identify:
- Direction (rising, falling, stable)
- Volatility (consistent or erratic)
- Inflection points (major changes)
- Correlation with business events (acquisitions, restructuring, market conditions)
Step 3: Compare Against Peers
Select 3-5 direct competitors. Calculate their current ratios and 5-year trends.
Determine:
- Relative positioning (above, below, or aligned with peers)
- Competitive implications (advantage or disadvantage)
- Strategic differences (conservative vs. aggressive management)
Step 4: Assess Quality of Leverage
Examine debt characteristics beyond simple quantity:
- Interest rates: Fixed vs. variable, current market rates
- Maturity schedule: Concentration of payments, refinancing risks
- Covenants: Restrictions on operations, financial ratio requirements
- Security: Secured vs. unsecured, collateral quality
Low-cost, long-maturity debt with minimal covenants represents higher-quality leverage than expensive, short-term, restrictive borrowing.
Step 5: Evaluate Cash Flow Coverage
Calculate interest coverage ratio:
Interest Coverage = EBIT / Interest Expense
A ratio above 5x indicates comfortable debt service capacity. Below 2x signals potential distress.
Examine free cash flow relative to total debt service (principal plus interest). Companies generating cash flow exceeding debt obligations by 2x or more maintain financial flexibility.
Step 6: Consider Future Scenarios
Project how different economic conditions affect the company's leverage position:
- Recession scenario: Revenue declines 20%, margins compress—can the company service debt?
- Growth scenario: Revenue increases 15%, margins expand—does leverage amplify returns?
- Interest rate scenario: Rates rise 200 basis points—how much do debt costs increase?
Stress testing reveals whether current capitalization ratios position the company for resilience or vulnerability.
Step 7: Make Informed Decisions
Synthesize all analyses into actionable conclusions:
Green light: Capitalization ratio aligns with industry norms, trends are stable or improving, cash flow comfortably covers obligations, debt quality is high, and stress scenarios show resilience.
Yellow light: Ratio slightly elevated versus peers, recent increases warrant monitoring, coverage ratios adequate but not robust, or debt quality mixed. Proceed with caution and ongoing monitoring.
Red light: Ratio significantly above industry norms, rapid increases without a clear strategic rationale, weak coverage ratios, poor debt quality, or vulnerability in stress scenarios. Avoid or reduce exposure.
This systematic approach transforms raw financial data into investment intelligence, similar to how understanding expected return calculations transforms probability into portfolio decisions.
Real-World Example: Comparing Two Companies
Consider two hypothetical telecommunications companies to illustrate practical analysis.
Company Alpha (Established Leader)
Financial Data (2025):
- Total long-term debt: $45 billion
- Shareholders' equity: $30 billion
- Total capitalization: $75 billion
- Capitalization ratio: 60%
- Revenue: $50 billion
- EBIT: $12 billion
- Interest expense: $2 billion
- Interest coverage: 6x
Analysis:
Alpha operates at the high end of normal for telecommunications. The 60% ratio reflects massive infrastructure investments in 5G networks and fiber expansion. Strong interest coverage (6x) demonstrates comfortable debt service capacity despite high leverage.
Five-year trend shows a stable ratio between 58-62%, indicating disciplined capital management through multiple economic cycles. Debt consists primarily of investment-grade bonds with 10-15 year maturities at 4.5% average interest rates.
Verdict: Appropriate leverage for the sector. Financial stability is supported by a monopolistic market position and a regulatory framework. Acceptable risk for conservative income investors seeking dividend yield.
Company Beta (Aggressive Challenger)
Financial Data (2025):
- Total long-term debt: $28 billion
- Shareholders' equity: $7 billion
- Total capitalization: $35 billion
- Capitalization ratio: 80%
- Revenue: $25 billion
- EBIT: $4 billion
- Interest expense: $1.8 billion
- Interest coverage: 2.2x
Analysis:
Beta carries extreme leverage at an 80% capitalization ratio, far above industry norms. The company borrowed aggressively to fund market share gains and network buildout, competing against established players.
Interest coverage of only 2.2x provides a minimal cushion. A moderate recession reducing EBIT by 30% would bring coverage dangerously close to 1x, threatening financial distress.
Five-year trend shows ratio rising from 55% to 80%, driven by $15 billion in new borrowing. Debt includes substantial high-yield bonds at 7-8% interest rates, reflecting market perception of elevated risk.
Verdict: Excessive leverage creates significant bankruptcy risk. Appropriate only for aggressive growth investors willing to accept a high probability of financial distress in exchange for potential market share gains. Conservative investors should avoid.
Comparative Insight
Both companies operate in telecommunications with similar business models. However, capital structure differences create vastly different risk profiles.
Alpha demonstrates how established companies with stable cash flows can safely operate at industry-standard leverage levels. Beta illustrates how aggressive growth strategies funded through excessive debt create fragility.
The math behind money reveals the fundamental trade-off: leverage amplifies returns in good times and losses in bad times. Capitalization ratios quantify this leverage with precision.
Investors must decide their risk tolerance and select companies with capital structures matching their investment objectives, just as diversification strategies balance portfolio risk across multiple positions.
Conclusion
The capitalization ratio quantifies financial leverage with mathematical precision. This single percentage reveals how companies balance debt's tax advantages against bankruptcy risks, exposing management philosophy and financial stability.
The math behind money teaches a fundamental truth: Leverage amplifies outcomes in both directions. Companies with high capitalization ratios generate superior returns during growth periods but face severe stress during downturns. Conservative structures sacrifice potential gains for resilience.
No universal optimal ratio exists. Technology companies thrive with 20-30% ratios that would bankrupt utilities. Telecommunications companies operate comfortably at 60-70% levels that would destroy software businesses. Industry fundamentals, asset tangibility, cash flow predictability, and regulatory environment determine appropriate leverage.
Effective analysis requires a systematic process:
- Calculate the company's current ratio
- Determine industry benchmarks from peer data
- Track historical trends over 5-10 years
- Assess debt quality beyond simple quantity
- Evaluate cash flow coverage of obligations
- Stress test under various economic scenarios
- Make informed decisions based on comprehensive evidence
Combine capitalization ratios with complementary metrics, interest coverage, debt-to-equity, return on equity, free cash flow, for a complete financial health assessment. Numbers without context mislead. Context without numbers deceives. Evidence-based investing demands both.
The capitalization ratio serves as a financial barometer, measuring the storm clouds of excessive leverage or the missed opportunities of overcautious management. Master this metric to evaluate corporate financial stability, identify bankruptcy risks, and build portfolios aligned with personal risk tolerance.
Next steps: Select three companies in your portfolio or watchlist. Calculate their capitalization ratios. Compare against industry peers. Track trends over five years. Assess whether current capital structures position these companies for sustainable success or potential distress. Apply this analytical framework systematically to strengthen investment decisions through data-driven insights.
Financial literacy empowers wealth building through understanding, not speculation. The capitalization ratio represents one essential tool in the comprehensive toolkit of evidence-based investing. Master the fundamentals, apply them consistently, and let mathematics guide capital allocation decisions.
References
[1] Morningstar, Inc. "Industry Financial Ratios and Benchmarks." Morningstar Direct, 2025.
[2] CFA Institute. "Corporate Finance and Portfolio Management." CFA Program Curriculum, Level II, 2025.
[3] Financial Accounting Standards Board. "ASC 842: Leases." FASB Accounting Standards Codification, 2025.
[4] S&P Global Market Intelligence. "Capital Structure Analysis by Sector." S&P Capital IQ Platform, 2025.
[5] Damodaran, Aswath. "Capital Structure: Overview and Practical Implications." NYU Stern School of Business, 2024.
[6] Federal Reserve Bank. "Financial Stability Report." Board of Governors of the Federal Reserve System, 2025.
[7] Securities and Exchange Commission. "Form 10-K Filing Requirements." SEC.gov, 2025.
Author Bio
Max Fonji is the founder of The Rich Guy Math, a data-driven financial education platform dedicated to teaching the mathematical principles behind wealth building, investing fundamentals, and evidence-based financial decision-making. With expertise in economic analysis, valuation principles, and risk management, Max translates complex financial concepts into clear, actionable insights for beginner to intermediate investors. His analytical approach emphasizes cause-and-effect relationships, empirical evidence, and the logical frameworks that separate sustainable wealth creation from speculation.
Educational Disclaimer
This article provides educational information about capitalization ratios and financial analysis concepts. It does not constitute investment advice, financial planning recommendations, or solicitation to buy or sell securities. Financial metrics should be evaluated within comprehensive analytical frameworks considering individual circumstances, risk tolerance, and investment objectives.
Capitalization ratios represent historical snapshots of the balance sheet that may not accurately reflect current market conditions or future performance. Industry benchmarks vary by sector, economic cycle, and regulatory environment. Past financial structures do not guarantee future stability or returns.
Investors should conduct thorough due diligence, consult qualified financial professionals, and consider multiple information sources before making investment decisions. The author and The Rich Guy Math assume no liability for financial decisions made based on this educational content.
All company examples are hypothetical illustrations designed to demonstrate analytical concepts. Any resemblance to actual companies is coincidental. Financial data, ratios, and benchmarks cited reflect publicly available information and industry research as of 2025.
Frequently Asked Questions
What is a good capitalization ratio?
Context determines "good." Technology companies with 20–30% ratios demonstrate appropriate conservatism for volatile revenue streams. Utilities with 60–70% ratios optimize capital costs while maintaining stability. Compare companies against industry peers rather than absolute standards. Ratios aligned with successful competitors generally indicate appropriate leverage.
How is capitalization ratio different from debt-to-equity ratio?
Both measure leverage but express it differently. Capitalization ratio shows debt as a percentage of total capital (debt + equity), maxing out at 100%. Debt-to-equity shows debt as a multiple of equity and can exceed 100%. A company with $500M debt and $500M equity has a 50% capitalization ratio but a 100% (or 1.0x) debt-to-equity ratio. They measure the same underlying leverage from different perspectives.
Can a company have a capitalization ratio over 100%?
No. By definition, capitalization ratio divides debt by total capital (debt + equity). The maximum possible value is 100%, which would indicate zero equity. Companies approaching 100% face severe financial distress or bankruptcy. Negative equity from accumulated losses can create undefined or nonsensical ratios, signaling extreme financial problems.
Should I avoid companies with high capitalization ratios?
Not automatically. Industry context matters critically. A 65% ratio signals danger in software but normalcy in utilities. Evaluate whether the ratio aligns with industry standards, whether cash flow comfortably covers debt service, and whether the company maintains the ratio through economic cycles. High ratios in appropriate industries with strong coverage represent acceptable risk.
How often do companies report capitalization ratios?
Companies don't typically report this metric directly. Investors calculate it from balance sheet data in quarterly (10-Q) and annual (10-K) filings. Financial databases and screening tools often calculate and display the ratio automatically. Track changes quarterly to identify trends, but annual comparisons smooth seasonal variations and provide more meaningful insights.
What causes capitalization ratios to change?
Multiple factors: new borrowing increases the ratio; debt repayment decreases it; profitable operations growing retained earnings decrease it; losses reducing equity increase it; share buybacks reducing equity increase it; new equity issuance decreases it; acquisitions funded with debt increase it. Analyze the cause of changes—strategic decisions differ fundamentally from operational deterioration.
Do capitalization ratios predict stock performance?
Not directly. The ratio measures financial structure, not business quality or growth prospects. However, excessive leverage increases bankruptcy risk during downturns, while conservative structures may signal missed growth opportunities. Combine capitalization ratio analysis with profitability, growth, valuation, and competitive position metrics for comprehensive investment decisions.
How do I find a company's capitalization ratio?
Calculate it from balance sheet data: divide total long-term debt by (total long-term debt + shareholders' equity). Balance sheets appear in 10-K annu