When a business needs capital to grow, two fundamental paths emerge: borrowing money or selling ownership. Debt Financing vs Equity Financing represents one of the most critical strategic decisions entrepreneurs and business leaders face, a choice that shapes not just immediate cash flow, but long-term control, risk exposure, and wealth creation potential.
Consider this: A $500,000 capital injection can either cost you 8% annually in interest payments or 25% of your company’s future value. The math behind money reveals that these aren’t just different funding mechanisms; they’re entirely different financial architectures with distinct mathematical consequences.
This guide breaks down the data-driven differences between debt and equity financing, showing you exactly how each option impacts ownership, cash flow, tax obligations, and strategic flexibility. By understanding the cause-and-effect relationships embedded in each financing structure, you’ll gain the clarity needed to make evidence-based capital decisions.
Key Takeaways
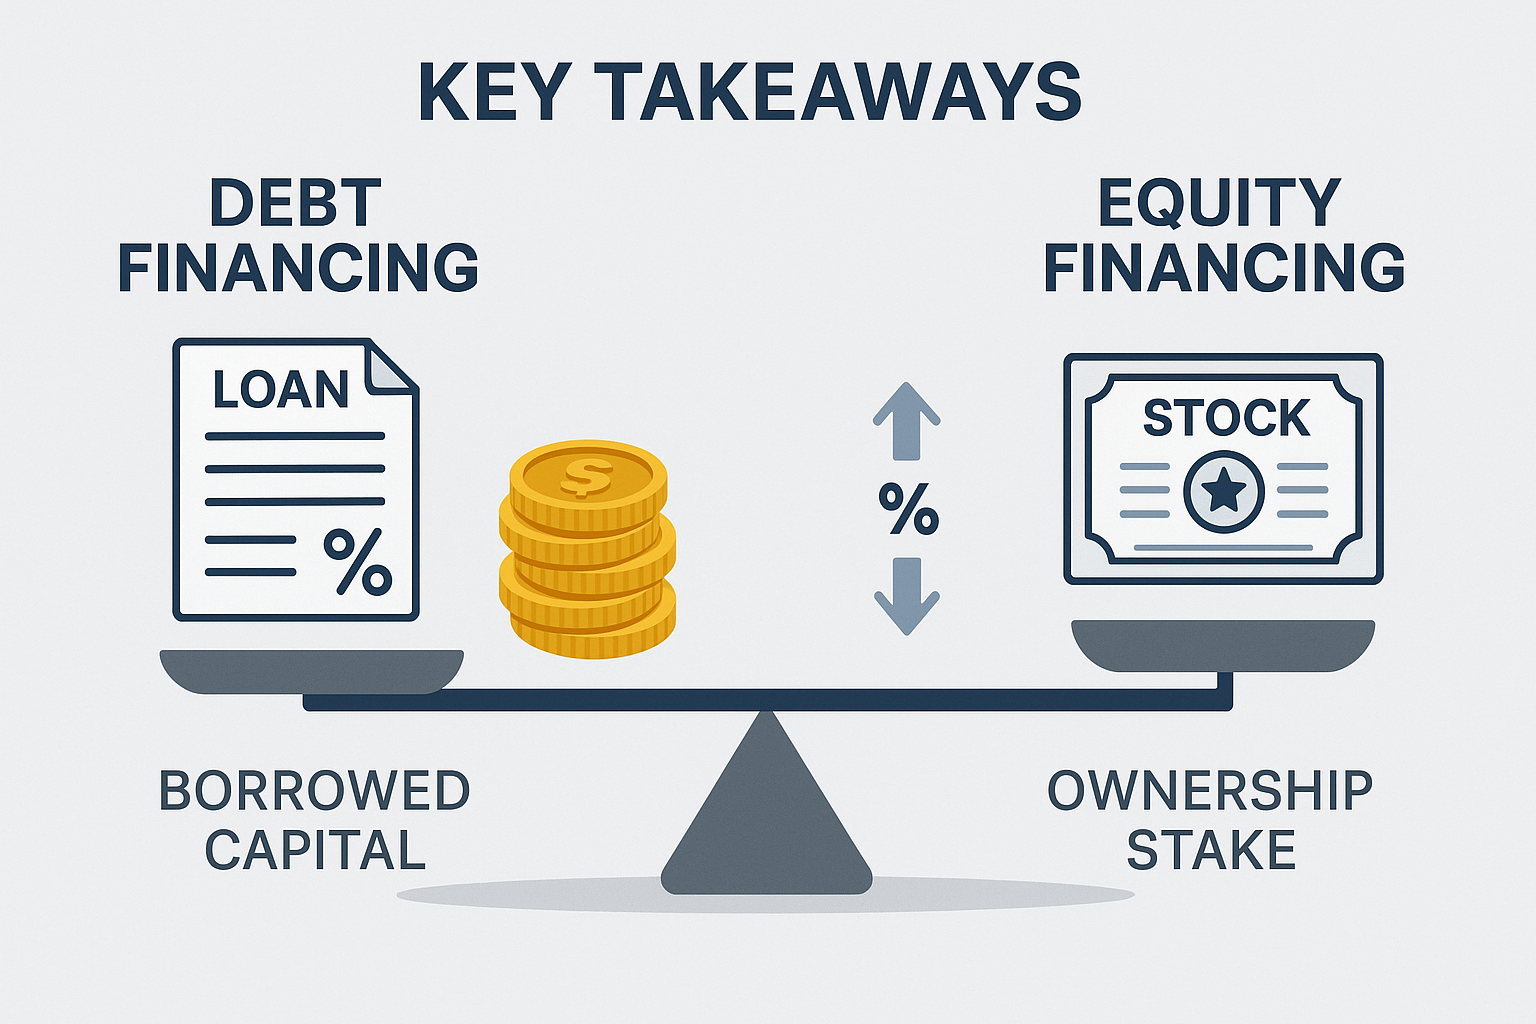
- Debt financing involves borrowing capital that must be repaid with interest (typically 6-15% APR in 2025), while equity financing exchanges ownership stakes (usually 10-40%) for capital without repayment obligations
- Debt preserves 100% ownership and control but creates mandatory monthly cash outflows, whereas equity dilutes ownership but brings strategic partners without fixed payment schedules
- Interest payments on debt are tax-deductible, reducing effective borrowing costs by 21-37% depending on tax brackets, while equity distributions receive no tax advantages
- Debt financing suits established businesses with predictable cash flows and collateral; equity financing better serves high-growth startups with limited assets but strong scaling potential
- The optimal capital structure balances both financing types to minimize the overall cost of capital while maintaining strategic flexibility
Understanding Debt Financing: The Borrowed Capital Model
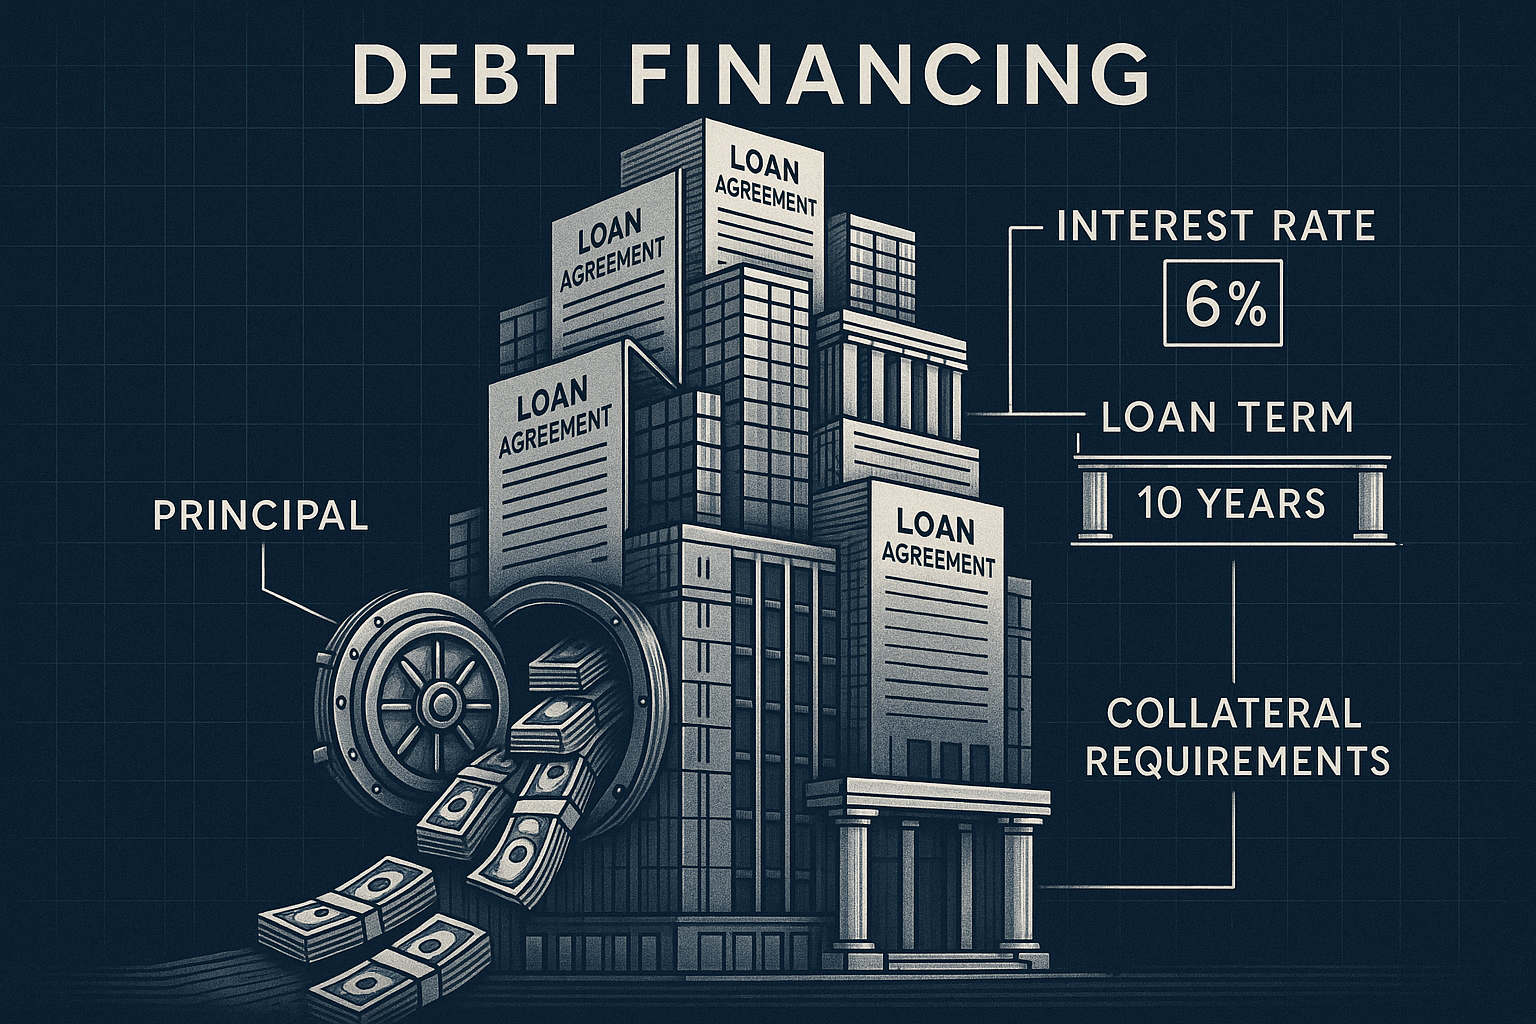
Debt financing is the practice of raising capital by borrowing funds from lenders, banks, credit unions, bondholders, or alternative financing institutions, with a contractual obligation to repay the principal plus interest according to predetermined terms.
The fundamental equation is straightforward:
Total Repayment = Principal + (Principal × Interest Rate × Time)
When a business secures a $100,000 loan at 10% annual interest over 5 years, the total interest cost equals $27,748 using standard amortization schedules. This creates predictable monthly payments of approximately $2,125, which directly impact operating cash flow.
How Debt Financing Works
Lenders evaluate three primary factors before extending credit:
- Creditworthiness: Historical payment behavior and credit scores (typically requiring 680+ for favorable terms)
- Collateral: Assets that secure the loan and can be seized upon default
- Cash Flow Capacity: Demonstrated ability to generate sufficient revenue to cover debt service
The approval process focuses on risk mitigation. Lenders don’t share in business success; they simply want assurance of repayment. This creates a fundamentally different relationship than equity investors establish.
Interest rates in 2025 typically range from 6% for highly creditworthy borrowers with strong collateral to 15%+ for riskier ventures or unsecured loans. The APY vs APR distinction matters here: compounding frequency affects total borrowing costs.
Key Characteristics of Debt Financing
Ownership Retention: Borrowers maintain 100% equity ownership. No matter how large the loan, lenders acquire zero ownership stakes or voting rights.
Fixed Obligations: Monthly payments remain constant regardless of business performance. Whether revenue soars or plummets, the payment schedule persists.
Tax Advantages: Interest expenses reduce taxable income. A business in the 25% tax bracket effectively reduces a 10% interest rate to 7.5% after tax benefits, a significant mathematical advantage that equity financing cannot provide.
Finite Relationship: Once the loan is repaid, the lender relationship ends completely. There’s no ongoing profit sharing or decision-making involvement.
Balance Sheet Impact: Debt is recorded as a liability, influencing key financial ratios such as the debt-to-equity ratio and current ratio, which investors and future lenders closely examine when evaluating a company’s financial health.
Common Debt Financing Instruments
- Term Loans: Fixed amounts repaid over set periods (1-10 years)
- Lines of Credit: Revolving access to capital up to predetermined limits
- Bonds: Debt securities sold to multiple investors with fixed coupon payments
- Equipment Financing: Loans secured specifically by the equipment purchased
- Invoice Financing: Borrowing against accounts receivable to improve cash flow timing
Takeaway: Debt financing exchanges future cash flows for immediate capital while preserving ownership, making it mathematically optimal when predictable revenue can comfortably cover debt service and the tax shield provides meaningful savings.
Understanding Equity Financing: The Ownership Exchange Model
Equity financing involves raising capital by selling ownership shares in the business to investors who become partial owners entitled to proportional profits, voting rights, and residual claims on assets.
The core mathematical framework differs fundamentally from debt:
Investor Return = (Exit Value – Investment) / Investment
An investor contributing $100,000 for 20% equity in a company that eventually sells for $2 million receives $400,000, a 4x return with no interest rates or repayment schedules involved. The business never “pays back” the $100,000; instead, the investor’s return derives entirely from business value creation.
How Equity Financing Works
Equity investors evaluate completely different criteria than lenders:
- Growth Potential: Scalability and addressable market size matter more than current revenue
- Competitive Advantage: Unique value propositions and defensible market positions
- Management Quality: Team capability to execute the business plan and adapt to challenges
- Exit Opportunity: Realistic paths to liquidity events (acquisition, IPO, secondary sales)
The process involves extensive due diligence, valuation negotiations, and legal documentation establishing ownership percentages, voting rights, board representation, and exit preferences.
Key Characteristics of Equity Financing
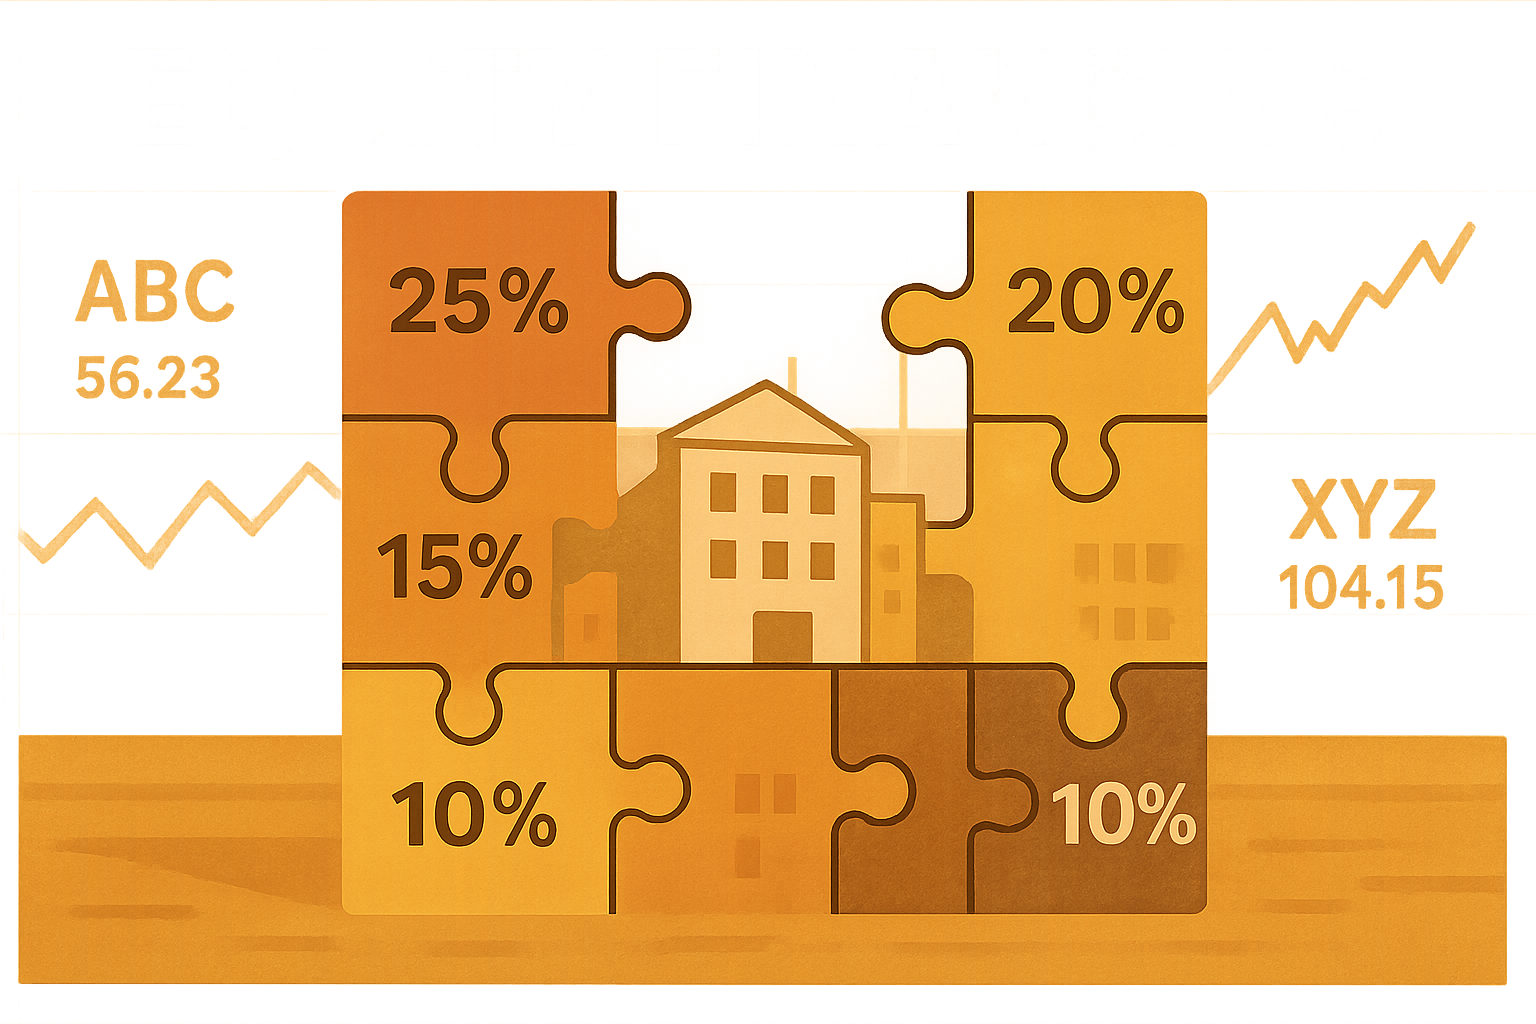
Ownership Dilution: Founders exchange permanent ownership stakes, typically ranging from 10% for small angel rounds to 40%+ for significant venture capital investments. This dilution is irreversible unless shares are repurchased.
No Repayment Obligation: Equity capital never requires repayment. If the business fails, investors lose their investment, and there’s no debt collection or bankruptcy claim (beyond residual asset distribution).
Shared Decision-Making: Equity investors often negotiate voting rights, board seats, and approval authority over major decisions like additional fundraising, executive hiring, or company sale.
Aligned Incentives: Unlike lenders who simply want repayment, equity investors profit only when the business succeeds. This alignment can drive valuable strategic support, introductions, and mentorship.
No Tax Benefits: Equity financing provides no tax deductions. Dividend distributions are paid from after-tax profits, creating potential double taxation (corporate and personal levels).
Ongoing Relationship: Equity investors remain involved until a liquidity event occurs—potentially 5-10+ years. The relationship extends far beyond simple capital provision.
Common Equity Financing Sources
- Angel Investors: High-net-worth individuals providing $25,000-$500,000 for early-stage ventures
- Venture Capital: Institutional funds investing $500,000-$50M+ in high-growth startups
- Private Equity: Firms acquiring significant or majority stakes in established businesses
- Crowdfunding: Platforms enabling small investments from numerous individual investors
- Strategic Partners: Industry players investing in synergistic business relationships
Insight: Equity financing transforms investors into long-term partners whose returns depend entirely on value creation, making it mathematically optimal when growth potential exceeds the cost of ownership dilution and strategic partnership value justifies control sharing.
Debt Financing vs Equity Financing: Direct Comparison
The choice between debt and equity financing creates fundamentally different financial and strategic outcomes. Understanding these differences through a data-driven lens reveals which structure aligns with specific business situations.
Ownership and Control Dynamics
Debt Financing: Preserves 100% ownership regardless of borrowing amount. A $5 million loan creates zero dilution. Lenders have no voting rights or operational input beyond covenant compliance.
Equity Financing: Dilutes ownership proportionally. A $5 million investment at a $20 million pre-money valuation results in 20% ownership transfer ($5M / $25M post-money). Investors typically negotiate board representation and veto rights on major decisions.
Mathematical Impact: Over time, ownership percentage determines wealth accumulation. If a company grows from $20M to $200M valuation, founders with 100% ownership capture $180M in value creation versus $144M with 20% dilution, a $36M difference that no interest payment approaches.
Cost Structure and Cash Flow
Debt Financing: Creates fixed monthly obligations. A $500,000 loan at 10% over 5 years requires $10,624 monthly regardless of revenue fluctuations. This predictable expense aids financial planning but strains cash flow during downturns.
The effective cost after tax benefits:
Effective Interest Rate = Stated Rate × (1 – Tax Rate)
At a 25% tax rate, a 10% loan effectively costs 7.5%, a quantifiable advantage.
Equity Financing: Eliminates fixed payments but dilutes all future profits. If the business generates $2M annual profit, 20% equity investors claim $400,000 annually, far exceeding typical debt service costs, but only if profits materialize.
The implicit cost compounds over time. That $400,000 annual distribution continues indefinitely, unlike debt, which terminates after repayment.
Risk and Qualification Requirements
Debt Financing: Requires demonstrated repayment capacity through:
- Credit scores typically 680+ for favorable terms
- Collateral covering 80-120% of the loan value
- Debt service coverage ratios above 1.25x
- Established revenue history (usually 2+ years)
Failure to repay triggers default, potential asset seizure, and credit damage. The debt ratio and other leverage metrics constrain future borrowing capacity.
Equity Financing: Accessible to earlier-stage ventures without collateral or credit history. Investors bet on future potential rather than current assets. However, qualification depends on:
- Compelling growth narratives and market opportunities
- Strong founding teams with relevant expertise
- Scalable business models with venture-scale returns (10x+ potential)
- Clear paths to liquidity within 5-10 years
Risk transfers to investors, business failure costs founders their equity stake but creates no personal liability (absent fraud).
Timeline and Accessibility
Debt Financing: Faster for qualified borrowers. Traditional bank loans close in 30-90 days; alternative lenders can fund within days. The process is standardized with clear approval criteria.
Equity Financing: Slower and less predictable. Fundraising typically requires 3-9 months, including investor identification, pitch meetings, due diligence, term negotiation, and legal documentation. Only ~1% of startups successfully raise venture capital.
Strategic Implications
Debt Financing: Maintains strategic autonomy. Founders execute their vision without investor input. However, debt covenants may restrict certain actions (additional borrowing, acquisitions, dividend distributions).
Excessive leverage limits flexibility. High debt loads constrain the ability to weather downturns, pivot business models, or pursue opportunistic investments.
Equity Financing: Brings strategic value beyond capital. Quality investors provide:
- Industry expertise and operational guidance
- Network access for customer/partner introductions
- Credibility signaling to markets and future investors
- Recruitment assistance for key hires
The trade-off: founders share decision-making authority and must align with investor preferences on strategy, timing, and exit planning.
Comparison Table
| Factor | Debt Financing | Equity Financing |
|---|---|---|
| Ownership | 100% retained | Diluted 10-40% typically |
| Repayment | Required with interest | No repayment obligation |
| Monthly Obligation | Fixed payments | No fixed payments |
| Tax Treatment | Interest deductible | No tax benefits |
| Control | Full autonomy | Shared decision-making |
| Qualification | Credit, collateral, cash flow | Growth potential, team quality |
| Timeline | 30-90 days | 3-9 months |
| Risk | Default and asset loss | Equity value loss only |
| Relationship | Finite (ends at repayment) | Ongoing until exit |
| Best For | Established, predictable businesses | High-growth, scalable ventures |
Takeaway: The optimal choice depends on business stage, cash flow predictability, growth trajectory, and founder preferences regarding control versus partnership. The math behind money shows that neither option is universally superior; context determines which structure creates better risk-adjusted returns.
When to Choose Debt Financing
Debt financing makes mathematical and strategic sense under specific conditions where the benefits of ownership retention and tax advantages outweigh the risks of fixed obligations.
Ideal Scenarios for Debt Financing
Established Revenue and Predictable Cash Flow: Businesses generating consistent monthly revenue can accurately forecast their ability to service debt. A company with $500,000 monthly revenue and 40% profit margins can comfortably afford $50,000 in monthly debt service while maintaining an operational cushion.
The key metric: Debt Service Coverage Ratio (DSCR) = Operating Income / Total Debt Service
Lenders typically require DSCR above 1.25x, meaning operating income exceeds debt payments by at least 25%. This buffer protects against revenue fluctuations.
Valuable Collateral Assets: Businesses with significant fixed assets, real estate, equipment, and inventory can secure favorable loan terms. Asset-backed lending reduces lender risk, translating to lower interest rates (often 2-4 percentage points below unsecured alternatives).
Desire to Maintain Full Control: Founders unwilling to share decision-making authority or dilute ownership find debt financing attractive despite the cost. The premium paid in interest preserves strategic autonomy and captures 100% of future value creation.
Tax-Advantaged Situations: Profitable businesses in higher tax brackets maximize the debt’s tax shield benefits. A company in the 35% tax bracket converts a 12% interest rate into a 7.8% effective cost, a substantial reduction that equity financing cannot match.
Finite Capital Needs: When capital requirements are clearly defined and one-time (equipment purchase, facility expansion, inventory buildup), the debt’s finite repayment period aligns well. Once repaid, the obligation ends completely.
Strong Credit Profile: Businesses and founders with excellent credit histories (720+ scores) access premium rates and terms, making debt financing particularly cost-effective. The difference between 6% and 12% interest on a $1M loan equals $300,000+ over a 5-year term.
Example Calculation: Debt Financing ROI
Consider a manufacturing business requiring $1,000,000 for equipment that will generate $300,000 additional annual profit:
Debt Financing Scenario:
- Loan: $1,000,000 at 10% over 5 years
- Monthly payment: $21,247
- Total interest paid: $274,820
- Tax shield (25% rate): $68,705 savings
- Net interest cost: $206,115
- 5-year additional profit: $1,500,000
- Net benefit: $1,293,885 (founders keep 100%)
Equity Financing Scenario:
- Investment: $1,000,000 for 25% equity
- 5-year additional profit: $1,500,000
- Investor share (25%): $375,000
- Founder share (75%): $1,125,000
- Net benefit: $1,125,000
The debt financing scenario yields $168,885 more value to founders over 5 years, assuming the business can comfortably service the debt from existing cash flow.
When Debt Financing Becomes Risky
Insufficient Cash Flow: If monthly debt service exceeds 30-40% of operating income, the business becomes vulnerable to revenue disruptions. Understanding your cash flow statement becomes critical for managing this risk.
Cyclical or Seasonal Revenue: Businesses with significant revenue volatility struggle with fixed payment obligations during down periods. This mismatch between variable income and fixed expenses creates dangerous cash crunches.
Already High Leverage: Excessive existing debt limits additional borrowing capacity and increases default risk. The capitalization ratio helps assess whether additional debt is prudent.
Weak Credit or Limited Collateral: Without strong credit profiles or valuable assets, debt financing becomes expensive (15%+ rates) or unavailable, making equity alternatives more attractive.
Insight: Debt financing optimizes capital structure when cash flow predictability meets or exceeds payment obligations, tax benefits provide meaningful savings, and ownership retention captures disproportionate value creation, a mathematical calculation that requires honest assessment of revenue stability and growth potential.
When to Choose Equity Financing
Equity financing becomes the mathematically superior choice when growth potential exceeds the cost of dilution, and strategic partnership value justifies control sharing.
Ideal Scenarios for Equity Financing
Early-Stage Ventures Without Revenue: Startups lacking established revenue streams cannot service debt. Equity investors bet on future potential rather than current cash flow, making this the only viable capital source for pre-revenue businesses.
High-Growth, Scalable Business Models: Companies with potential for 10x+ growth within 5-10 years create returns that dwarf dilution costs. A founder retaining 60% of a $100M company captures more value ($60M) than owning 100% of a $10M company.
The critical calculation:
Diluted Value > Undiluted Value
(Ownership% % × Future Value with Equity) > (100% × Future Value without Equity)
If equity capital accelerates growth sufficiently, dilution becomes mathematically advantageous.
Limited or No Collateral: Service businesses, software companies, and other asset-light models lack collateral for debt financing. Their value resides in intellectual property, customer relationships, and human capital—assets that don’t secure traditional loans.
Need for Strategic Partnership: Beyond capital, equity investors provide expertise, networks, credibility, and operational support. For complex industries or competitive markets, this strategic value often exceeds the monetary investment.
Cash Flow Preservation: Businesses prioritizing runway extension and operational flexibility prefer equity’s lack of fixed payments. This proves especially valuable when time-to-market or customer acquisition timelines remain uncertain.
Venture-Scale Opportunities: Markets with billion-dollar potential attract venture capital seeking portfolio-level returns. The 1-2 investments that return 100x+ fund the 7-8 that fail. Founders with genuinely venture-scale opportunities access this capital pool.
Example Calculation: Equity Financing ROI
Consider a software startup requiring $2,000,000 to scale:
Equity Financing Scenario:
- Investment: $2,000,000 for 25% equity at $8M post-money valuation
- 5-year projected exit value with funding: $50,000,000
- Founder share (75%): $37,500,000
- Net founder benefit: $37,500,000
Bootstrap Scenario (no external capital):
- 5-year projected value without funding: $8,000,000
- Founder share (100%): $8,000,000
- Net founder benefit: $8,000,000
The equity financing scenario yields $29,500,000 more value despite 25% dilution, because the capital enables 6.25x greater value creation. This demonstrates when dilution makes mathematical sense.
Debt Financing Alternative (if available):
- Loan: $2,000,000 at 12% over 5 years
- Monthly payment: $44,489
- Total payments over 5 years: $2,669,340
- Assuming the startup cannot generate sufficient cash flow to service this debt without severely limiting growth investment, this option creates unacceptable risk
Strategic Value Beyond Capital
Quality equity investors contribute:
Domain Expertise: Industry veterans who’ve built similar businesses provide pattern recognition and help avoid common pitfalls.
Network Effects: Introductions to potential customers, partners, and future investors accelerate growth and reduce customer acquisition costs.
Credibility Signaling: Top-tier investor backing validates the business model and attracts talent, customers, and additional investors.
Operational Support: Assistance with hiring, financial planning, pricing strategy, and scaling operations, capabilities that early-stage founders often lack.
Follow-On Capital: Existing investors typically participate in future rounds, providing more predictable access to growth capital.
When Equity Financing Creates Problems
Misaligned Investor Expectations: Investors seeking rapid exits may pressure founders toward premature sales or aggressive growth that sacrifices long-term value.
Loss of Control: Significant dilution combined with investor protective provisions can leave founders with minority voting power in their own companies.
Valuation Pressure: Raising capital at inflated valuations creates difficult future fundraising if growth doesn’t meet expectations; the dreaded “down round” that severely dilutes founders.
Exit Constraints: Equity investors eventually require liquidity, potentially forcing exits before founders are ready or at suboptimal timing.
Insight: Equity financing optimizes capital structure when growth acceleration from the capital and strategic partnership exceeds the mathematical cost of dilution, a calculation requiring honest assessment of how much faster and larger the business can grow with investor involvement versus bootstrap alternatives.
Hybrid Approaches: Combining Debt and Equity Financing
The most sophisticated capital structures don’t choose between debt and equity—they optimize the mix to minimize the overall cost of capital while maintaining strategic flexibility.
The Optimal Capital Structure Concept
Financial theory suggests an optimal leverage point where the tax benefits of debt balance against the increased bankruptcy risk from excessive leverage. This sweet spot varies by industry, business model, and growth stage.
Weighted Average Cost of Capital (WACC) quantifies this:
WACC = (E/V × Re) + (D/V × Rd × (1-Tc))
Where:
- E = Market value of equity
- D = Market value of debt
- V = E + D (total value)
- Re = Cost of equity
- Rd = Cost of debt
- Tc = Corporate tax rate
Businesses minimize WACC by finding the debt-to-equity ratio that balances cheaper (tax-advantaged) debt against more expensive (but flexible) equity.
Common Hybrid Structures
Equity Foundation with Debt Growth Capital: Startups often raise initial equity rounds to prove the business model, then layer in debt financing once predictable revenue emerges. This preserves equity for high-risk phases while using cheaper debt for lower-risk scaling.
Convertible Debt: Loans that convert to equity at future fundraising rounds, combining debt’s simplicity with equity’s upside participation. Common in seed-stage financing, where valuation remains uncertain.
Revenue-Based Financing: Investors receive a percentage of monthly revenue until reaching a predetermined return multiple (typically 1.5-3x). This hybrid creates debt-like repayment with equity-like flexibility tied to performance.
Mezzanine Financing: Subordinated debt with equity kickers (warrants or conversion rights), typically used in later-stage companies. Provides debt’s tax benefits with equity’s upside participation.
Asset-Backed Lines with Equity: Companies use accounts receivable or inventory to secure revolving credit lines for working capital while raising equity for growth investments—matching capital type to use case.
Strategic Sequencing
Stage 1 (Pre-Revenue): Pure equity financing from angels or early-stage VCs. No debt capacity exists without revenue or assets.
Stage 2 (Early Revenue): Continued equity raises for growth capital. Small equipment loans or lines of credit may become available but remain secondary.
Stage 3 (Scaling Revenue): Hybrid approach emerges. Equity finances major growth initiatives while debt covers working capital, equipment, and predictable expansion costs.
Stage 4 (Mature Growth): Debt becomes the primary capital source for efficiency and tax optimization. Equity raises become less frequent and more strategic.
Example: Hybrid Capital Strategy
A SaaS company’s 5-year capital journey:
Year 1: $500,000 seed equity round (25% dilution) to build product
Year 2: $2M Series A equity round (20% dilution) to acquire initial customers
Year 3: $1M revenue-based financing to scale marketing (no dilution, repaid from revenue)
Year 4: $3M venture debt facility (no dilution, 10% interest) to extend runway between equity rounds
Year 5: $10M Series B equity round (15% dilution) to accelerate growth
Total capital raised: $16.5M
Total dilution: ~50% (founder retains 50% ownership)
Compared to the pure equity path requiring ~$20M total at similar dilution, or the pure debt path creating unsustainable payment obligations during the growth phase.
Balancing Act Considerations
Cash Flow Timing: Use debt for capital needs with clear, near-term ROI (equipment that immediately increases capacity). Reserve equity for longer-term, uncertain investments (new market entry, R&D).
Risk Tolerance: More conservative founders may prefer higher equity ratios to avoid default risk. Growth-aggressive founders may leverage debt more heavily to minimize dilution.
Market Conditions: Debt becomes more attractive when interest rates are low and equity valuations are compressed. Equity becomes preferable when valuations are high and debt is expensive.
Industry Norms: Asset-heavy industries (manufacturing, real estate) typically carry higher debt ratios (60-70% debt). Asset-light businesses (software, services) skew toward equity (70-80% equity).
Takeaway: The optimal capital structure isn’t static—it evolves with business maturity, market conditions, and strategic priorities. Understanding how different capital types interact allows sophisticated founders to minimize total capital costs while maintaining appropriate risk levels and strategic flexibility.
Tax Implications: The Hidden Cost Differential
Tax treatment creates a significant mathematical advantage for debt financing that equity cannot match—a factor that substantially impacts true capital costs.
Debt Financing Tax Benefits
Interest Deductibility: Interest payments reduce taxable income dollar-for-dollar. A business paying $100,000 in annual interest with $1,000,000 in operating income reduces taxable income to $900,000.
At a 25% corporate tax rate:
- Tax without interest deduction: $250,000
- Tax with interest deduction: $225,000
- Tax savings: $25,000
This effectively reduces the interest cost by 25%:
After-Tax Cost of Debt = Interest Rate × (1 – Tax Rate)
After-Tax Cost = 10% × (1 – 0.25) = 7.5%
For businesses in higher tax brackets (up to 37% for certain structures), this benefit becomes even more pronounced. A 12% loan effectively costs 7.56% after tax benefits at the highest bracket.
Equity Financing Tax Disadvantages
No Deductibility: Equity returns, whether dividends or capital appreciation, receive no tax deductions. The business pays taxes on full operating income, then distributes after-tax profits to shareholders.
Double Taxation: C-Corporations face corporate tax on profits, then shareholders pay personal tax on dividends. This creates effective tax rates exceeding 50% in some jurisdictions:
- Corporate tax: 21% federal + state
- Dividend tax: 15-23.8% (qualified dividends)
- Combined effective rate: ~40-45%
Capital Gains Treatment: When equity investors exit, they pay capital gains tax (0-23.8% depending on income and holding period). While lower than ordinary income rates, this still represents a high cost that debt repayment avoids.
Mathematical Impact on Capital Costs
Consider two scenarios for raising $1,000,000:
Debt Scenario:
- Interest rate: 10%
- Annual interest: $100,000
- Tax benefit (25% rate): $25,000
- Net annual cost: $75,000
- Effective cost: 7.5%
Equity Scenario:
- Ownership sold: 20%
- Annual profit: $500,000
- Investor share: $100,000
- Tax on profit (no deduction): $125,000 on full $500,000
- Net annual cost: $100,000 (ongoing indefinitely)
- Plus: $125,000 tax burden vs. $93,750 with debt
The tax differential adds 3.125 percentage points to equity’s effective cost in this example—a substantial hidden expense that compounds annually.
Strategic Tax Planning
Debt Capacity Optimization: Businesses can calculate their optimal debt level by determining how much interest expense they can deduct before other tax considerations (AMT, interest limitation rules) reduce benefits.
Entity Structure Matters: Pass-through entities (S-Corps, LLCs) avoid double taxation but still benefit from interest deductibility. C-Corps face double taxation but have access to broader investor pools.
Timing Considerations: Interest deductions provide immediate tax benefits, improving cash flow in the current year. Equity’s tax impact manifests over longer periods through diluted profit sharing.
Insight: The tax shield from debt financing represents a quantifiable mathematical advantage worth 2-4 percentage points in effective capital cost for profitable businesses—a benefit that accumulates significantly over multi-year periods and should factor prominently in financing decisions.
Risk Management and Financial Health Metrics
Different financing choices create distinct risk profiles that sophisticated investors and lenders evaluate through specific financial metrics. Understanding these measurements helps assess whether additional debt or equity makes sense.
Key Leverage Ratios for Debt Financing
Debt-to-Equity Ratio: Compares total debt to total equity, indicating leverage level.
Debt-to-Equity = Total Debt / Total Equity
Ratios above 2.0 signal high leverage; ratios below 0.5 indicate conservative capital structure. Industry norms vary significantly, capital-intensive businesses tolerate higher ratios than service businesses.
The debt-to-equity ratio directly impacts borrowing capacity and investor risk perception.
Debt Service Coverage Ratio (DSCR): Measures the ability to service debt from operating income.
DSCR = Operating Income / Total Debt Service
Lenders typically require DSCR above 1.25x, providing a 25% buffer. Ratios below 1.0 indicate insufficient income to cover debt payments, an unsustainable situation.
Interest Coverage Ratio: Focuses specifically on interest payment capacity.
Interest Coverage = EBIT / Interest Expense
Ratios above 3.0 indicate comfortable coverage; ratios below 1.5 raise concerns about financial distress risk.
Current Ratio: Assesses short-term liquidity and ability to meet near-term obligations.
Current Ratio = Current Assets / Current Liabilities
Ratios above 1.5 suggest healthy liquidity; below 1.0 indicate potential cash flow problems. The current ratio vs quick ratio comparison provides deeper liquidity insights.
Equity Financing Risk Metrics
Ownership Dilution Tracking: Monitoring cumulative dilution across funding rounds prevents founders from losing control.
Fully Diluted Ownership = Founder Shares / (Total Shares + Options + Convertible Securities)
Founders maintaining 50%+ ownership retain control; dropping below 20% creates significant alignment risks.
Valuation Progression: Each funding round should occur at higher valuations, demonstrating value creation.
Valuation Step-Up = Current Round Valuation / Previous Round Valuation
Step-ups below 1.5x suggest limited progress; above 3.0x indicates strong execution.
Liquidation Preference Overhang: Investor preferences can create situations where founders receive nothing despite successful exits.
Preference Overhang = Total Liquidation Preferences / Current Valuation
Ratios above 1.0 mean investors must be paid more than the current company value before founders receive anything, a dangerous situation.
Combined Capital Structure Health
Weighted Average Cost of Capital (WACC): Blends debt and equity costs into the overall capital expense.
Lower WACC indicates a more efficient capital structure. Businesses should track WACC trends and optimize the debt-equity mix to minimize this metric.
Financial Flexibility Score: Qualitative assessment of ability to access additional capital if needed.
- High debt utilization + low equity attractiveness = Low flexibility
- Moderate debt + strong equity options = High flexibility
Cash Runway: Months of operation possible with current cash and committed capital.
Runway = Current Cash / Monthly Burn Rate
Businesses should maintain a 12-18 months runway minimum. Below 6 months triggers urgent fundraising needs that weaken negotiating position.
Risk Mitigation Strategies
Diversified Capital Sources: Don’t rely on a single lender or investor. Multiple relationships provide options and competitive dynamics.
Covenant Management: Understand and actively manage debt covenants. Violations trigger default even without missed payments.
Dilution Caps: Negotiate anti-dilution provisions and ownership floors to protect founder stakes through multiple rounds.
Exit Alignment: Ensure investor and founder exit timelines align. Mismatched horizons create destructive conflicts.
Stress Testing: Model scenarios where revenue drops 20-40%. Can the business survive with its current capital structure? If not, it’s over-leveraged.
Takeaway: Healthy capital structures balance growth ambition against financial resilience, maintaining metrics within industry norms while preserving strategic flexibility to weather downturns and capitalize on opportunities—a discipline that separates sustainable businesses from over-leveraged failures.
Making Your Decision: A Framework for Choosing
Selecting between debt and equity financing requires a systematic evaluation of your specific situation against objective criteria. This framework provides a structured decision-making process.
Step 1: Assess Current Financial Position
Revenue Stability: Calculate the revenue coefficient of variation over the past 12-24 months.
CV = Standard Deviation / Mean
CV below 0.3 indicates stable revenue suitable for debt; above 0.5 suggests equity’s flexibility is safer.
Cash Flow Predictability: Review your cash flow statement to determine operating cash flow consistency. Can you forecast next quarter’s cash flow within 20%? If not, fixed debt payments create risk.
Existing Leverage: Calculate the current debt-to-equity ratio. If already above industry norms, additional debt may be unavailable or imprudent.
Credit Profile: Check business and personal credit scores. Below 680 significantly limits debt options and increases costs.
Collateral Availability: Inventory valuable assets. Real estate, equipment, and inventory can secure favorable debt terms. Intangible assets don’t collateralize traditional loans.
Step 2: Define Capital Use and Timeline
Specific vs. General Use: Debt works well for defined purchases (equipment, inventory, facility). Equity suits general growth capital with uncertain deployment.
ROI Timeline: If capital generates cash flow within 12-18 months, the debt repayment schedule aligns well. Longer-term investments (R&D, market development) match equity’s patient capital.
Amount Required: Small amounts ($50K-$500K) often favor debt’s simplicity. Large amounts ($2M+) may require equity unless the business is quite established.
Step 3: Evaluate Growth Trajectory and Potential
Growth Rate: Businesses growing 20%+ annually often benefit more from equity despite dilution. Slower-growth businesses (<10% annually) preserve more value through debt.
Scalability: Can revenue grow 10x without proportional cost increases? High scalability justifies equity dilution. Linear scaling favors debt’s ownership preservation.
Market Opportunity: Billion-dollar addressable markets attract equity investors. Smaller, niche markets may not interest institutional investors, making debt the practical choice.
Step 4: Consider Strategic Value Needs
Expertise Gaps: Do you need industry expertise, operational guidance, or network access? Equity investors provide strategic value; lenders provide only capital.
Credibility Requirements: In competitive or regulated industries, top-tier investor backing opens doors. Debt provides no credibility signaling.
Control Preferences: How important is maintaining full decision-making authority? Debt preserves control; equity requires sharing.
Step 5: Calculate True Costs
Debt Cost Calculation:
- Determine the interest rate available
- Apply tax benefit: After-tax rate = Rate × (1 – Tax Rate)
- Calculate the total interest over the loan term
- Add any fees or origination costs
- Total Debt Cost = Total Interest + Fees – Tax Savings
Equity Cost Calculation:
- Determine the ownership percentage required
- Project realistic exit value in 5-10 years
- Calculate diluted value: Exit Value × (1 – Dilution %)
- Compared to the projected value without equity capital
- Equity Cost = (Undiluted Value – Diluted Value) + Strategic Value
If the diluted value exceeds the undiluted value, equity makes mathematical sense despite dilution.
Step 6: Assess Risk Tolerance
Worst-Case Scenario: Model business failure. With debt, you face default, asset seizure, and credit damage. With equity, investors lose their investment, but they have no repayment obligation.
Cash Flow Stress: Model 30% revenue decline. Can you still service debt? If not, you’re over-leveraged.
Control Tolerance: Can you accept investor input on major decisions? If not, debt preserves autonomy.
Decision Matrix
| Factor | Favors Debt | Favors Equity |
|---|---|---|
| Revenue Stability | High (CV < 0.3) | Low (CV > 0.5) |
| Credit Score | 720+ | <680 |
| Collateral | Substantial | Limited |
| Growth Rate | <15% annually | >30% annually |
| Capital Use | Specific, short-term ROI | General, long-term investment |
| Control Preference | Must maintain | Willing to share |
| Strategic Needs | Capital only | Expertise + capital |
| Tax Situation | Profitable, high bracket | Unprofitable or low bracket |
| Risk Tolerance | Moderate | High |
Scoring: Assign points for each factor favoring debt vs. equity. The higher total indicates the better fit.
Common Decision Scenarios
Established Manufacturing Company Buying Equipment:
- Stable revenue ✓
- Valuable collateral ✓
- Specific use ✓
- Short ROI timeline ✓
- Decision: Debt Financing
Early-Stage Software Startup Scaling Sales:
- Unpredictable revenue ✓
- No collateral ✓
- Need expertise ✓
- Long ROI timeline ✓
- Decision: Equity Financing
Growing Service Business Expanding Locations:
- Moderately stable revenue
- Some assets
- Proven model
- Medium-term ROI
- Decision: Hybrid (Debt for build-out, Equity for market entry risk)
Takeaway: The optimal financing choice emerges from systematic evaluation of financial position, growth trajectory, strategic needs, and risk tolerance, not from generic advice or current market trends. The math behind money reveals which structure creates the best risk-adjusted returns for your specific situation.
💰 Debt vs Equity Financing Calculator
Compare the true costs and benefits of each financing option
Business Information
Debt Financing Terms
Equity Financing Terms
Conclusion: Building Your Optimal Capital Structure
The choice between Debt Financing vs Equity Financing isn’t binary; it’s a strategic optimization problem with mathematical solutions tailored to your business stage, financial position, and growth trajectory.
Debt financing preserves ownership and provides tax advantages, making it optimal for established businesses with predictable cash flows, valuable collateral, and moderate growth rates. The effective cost after tax benefits (typically 5-10% for qualified borrowers) creates an efficient capital source when repayment capacity exists.
Equity financing eliminates repayment obligations and brings strategic partnerships, making it essential for early-stage ventures, high-growth opportunities, and situations where investor expertise justifies dilution costs. When capital accelerates growth sufficiently, retaining 60% of a $50M company creates more wealth than owning 100% of a $10M company.
The most sophisticated capital structures combine both financing types strategically, using debt for predictable, short-term needs with clear ROI, while reserving equity for transformational growth investments and strategic partnerships. This hybrid approach minimizes the weighted average cost of capital while maintaining financial flexibility.
Your Next Steps
1. Calculate Your Numbers: Determine your actual debt service capacity, realistic growth projections, and true cost of each financing option using the frameworks provided.
2. Assess Your Position: Evaluate revenue stability, collateral availability, credit profile, and strategic needs objectively—not optimistically.
3. Model Scenarios: Project 5-year outcomes under debt, equity, and hybrid structures. Which creates the best risk-adjusted outcome?
4. Seek Expert Guidance: Consult with financial advisors, accountants, and experienced entrepreneurs who’ve navigated similar decisions. Their pattern recognition adds a valuable perspective.
5. Maintain Flexibility: Don’t over-optimize for current conditions. Markets change, opportunities emerge, and challenges arise. Build capital structures with room to adapt.
The math behind money shows that capital structure decisions compound over time—early choices about debt versus equity cascade through years of financial outcomes, ownership stakes, and strategic options. Making these decisions with data-driven clarity rather than emotional preference or generic advice separates wealth builders from those who leave value on the table.
Understanding capital structure principles, monitoring key financial ratios, and optimizing the debt-equity mix based on evolving business conditions creates sustainable competitive advantages that manifest in stronger balance sheets, lower capital costs, and greater founder wealth creation.
Start with an honest assessment, calculate true costs, and choose the financing structure that aligns mathematical reality with strategic ambition.
References
[1] U.S. Small Business Administration. “Small Business Lending.” SBA.gov, 2025.
[2] Federal Reserve. “Survey of Terms of Business Lending.” Federal Reserve Statistical Release, Q4 2024.
[3] National Venture Capital Association. “NVCA Yearbook 2025.” NVCA.org, 2025.
[4] Corporate Finance Institute. “Weighted Average Cost of Capital (WACC).” CFI Education, 2025.
[5] Internal Revenue Service. “Interest Expense Deduction.” IRS Publication 535, Tax Year 2024.
[6] Investopedia. “Debt-to-Equity Ratio.” Investopedia.com, accessed January 2025.
[7] Harvard Business Review. “How to Choose Between Debt and Equity Financing.” HBR.org, 2024.
[8] Morningstar. “Capital Structure Analysis for Investors.” Morningstar Investment Research, 2024.
Author Bio
Max Fonji is a data-driven financial educator and the founder of The Rich Guy Math, where he breaks down complex financial concepts through evidence-based analysis and clear mathematical frameworks. With expertise in corporate finance, valuation principles, and capital structure optimization, Max helps investors and entrepreneurs understand the cause-and-effect relationships that drive wealth building. His approach combines analytical rigor with accessible teaching, empowering readers to make confident financial decisions grounded in numbers rather than narratives.
Educational Disclaimer
This article provides educational information about debt and equity financing concepts and should not be construed as financial, legal, or investment advice. Financing decisions involve complex considerations specific to individual circumstances, risk tolerance, and business situations. Before making capital structure decisions, consult with qualified financial advisors, accountants, and legal professionals who can evaluate your specific situation. Past performance and hypothetical examples do not guarantee future results. All investment and financing decisions carry risk, including potential loss of capital and business assets.
Frequently Asked Questions
What is the main difference between debt and equity financing?
Debt financing involves borrowing money that must be repaid with interest while maintaining 100% ownership. Equity financing involves selling ownership stakes to investors in exchange for capital without repayment obligations. Debt creates fixed payment obligations and preserves control; equity dilutes ownership but provides flexible capital and strategic partnerships.
Which is cheaper: debt or equity financing?
Debt financing typically has lower explicit costs (6–15% interest rates) compared to equity’s implicit costs (20–40% ownership dilution plus ongoing profit sharing). However, after accounting for tax benefits, debt’s effective cost drops to 4–10% for profitable businesses. Equity becomes “cheaper” when the growth it enables exceeds the dilution cost—a calculation specific to each situation.
Can a startup use debt financing?
Startups can access limited debt financing through equipment loans, SBA microloans, or revenue-based financing once they have some revenue or assets. However, traditional bank loans require 2+ years of operating history, positive cash flow, and collateral—criteria most early-stage startups don’t meet. Equity financing remains the primary capital source for pre-revenue and early-revenue startups.
How much equity should I give up for financing?
Typical equity raises involve 15–25% dilution per round, though this varies widely based on valuation, amount raised, and negotiating dynamics. Founders should avoid exceeding 40–50% cumulative dilution across all rounds to maintain meaningful ownership and control. The specific percentage depends on your valuation, capital needs, and investor terms.
What are the tax advantages of debt financing?
Interest payments on debt are tax-deductible, reducing taxable income dollar-for-dollar. This creates an effective interest rate of (Stated Rate × (1 – Tax Rate)). For businesses in the 25% tax bracket, a 10% loan effectively costs 7.5% after tax benefits. This tax shield can reduce borrowing costs by 25–37%, depending on tax rates—a significant advantage equity financing doesn’t provide.
When should I choose equity over debt?
Choose equity financing when: (1) you lack sufficient cash flow to service debt payments, (2) you have limited collateral or credit history, (3) growth potential exceeds dilution costs mathematically, (4) you need strategic expertise beyond capital, or (5) your business model requires patient capital with uncertain ROI timelines. Early-stage, high-growth ventures typically benefit most from equity financing.
How does debt financing affect my credit score?
Business debt affects business credit scores (Dun & Bradstreet, Experian Business) immediately. Personal credit impact depends on whether you personally guarantee the loan. Timely payments improve credit scores; missed payments or defaults damage them significantly. Maintaining debt service coverage ratios above 1.25x and credit utilization below 30% protects credit health.
Can I use both debt and equity financing together?
Yes—hybrid capital structures often optimize total capital costs. Common approaches include raising equity for high-risk growth initiatives while using debt for working capital, equipment, or other predictable needs with clear ROI. Many businesses layer in debt financing after establishing revenue through equity rounds, combining equity’s flexibility during uncertain phases with debt’s efficiency during scaling.
Related posts:
 What Is SmartPass? Raptor Digital Hall Pass Explained for K-12 Schools
 What Is the 3x Rent Rule & How to Calculate It (With Examples)
 Portfolio Income: Definition, Examples, Tax Rules, and Strategies
 Bookkeeping vs Accounting: What’s the Difference & Which Do You Need?
 What Is Profitability Analysis & How to Do It: Metrics, Example & Tips
 Emergency Fund vs Savings: What’s the Real Difference and Why It Matters