When a company borrows $500,000 to purchase $1,000,000 worth of assets, exactly half of everything it owns is funded by debt. This simple mathematical relationship, known as the debt ratio, reveals one of the most critical truths about financial risk: the proportion of assets financed through borrowing directly determines how vulnerable a business is to economic downturns, interest rate changes, and cash flow disruptions.
Understanding the Debt Ratio isn’t just an academic exercise. It’s a fundamental tool that investors, creditors, and business owners use daily to assess financial health, compare companies, and make evidence-based decisions about capital allocation and risk management.
This guide breaks down the math behind money when it comes to leverage, showing exactly how the debt ratio works, what different values mean, and how to interpret this metric in real-world scenarios.
Key Takeaways
- The debt ratio measures what percentage of a company’s assets are financed through debt, calculated by dividing total debt by total assets
- Ratios below 0.4 (40%) indicate conservative financing with lower risk, while ratios above 0.6 (60%) signal aggressive leverage with higher financial risk
- A debt ratio of 1.0 means assets equal liabilities, requiring the company to sell everything it owns just to pay off its debts
- Industry context matters significantly; capital-intensive sectors like utilities naturally carry higher debt ratios than technology companies
- The debt ratio complements other leverage metrics like the debt-to-equity ratio and interest coverage for comprehensive financial analysis
What Is the Debt Ratio? Definition and Core Concept
The debt ratio is a financial metric that measures the proportion of a company’s assets financed through debt rather than equity.
At its core, this ratio answers a simple question: If a company sold all its assets at book value, what percentage would go to creditors versus owners?
The debt ratio compares total debt (or total liabilities, depending on the calculation method) to total assets. Both figures come directly from the balance sheet, making this one of the most straightforward leverage metrics to calculate.
Why the Debt Ratio Matters
Financial leverage amplifies both gains and losses. A company using significant debt can generate higher returns on equity when business is strong, but faces greater bankruptcy risk when revenue declines.
The debt ratio quantifies this leverage, providing a single number that indicates:
- Financial risk level — Higher ratios mean a greater debt burden
- Capital structure — The mix between debt and equity financing
- Borrowing capacity — How much additional debt the company can reasonably take on
- Creditor protection — The cushion available if the company needs to liquidate assets
Investors use this metric to assess risk before buying stock. Creditors examine it before extending loans. Management monitors it to maintain an optimal capital structure.
Because the debt ratio reveals the fundamental relationship between what a company owns and what it owes, it serves as a cornerstone of financial statement analysis and risk management.
The Debt Ratio Formula: How to Calculate It

The standard debt ratio formula is remarkably straightforward:
Debt Ratio = Total Debt ÷ Total Assets
This calculation can be expressed as either a decimal (0.50) or a percentage (50%).
Understanding the Components
Total Debt includes all interest-bearing obligations:
- Short-term debt (due within one year)
- Long-term debt (due beyond one year)
- Bonds payable
- Notes payable
- Capital lease obligations
Some analysts use total liabilities instead of total debt, which includes all obligations:
- All debt (as listed above)
- Accounts payable
- Accrued expenses
- Deferred revenue
- Other liabilities
Total Assets represents everything the company owns:
- Current assets (cash, inventory, accounts receivable)
- Fixed assets (property, equipment, buildings)
- Intangible assets (patents, goodwill, trademarks)
- Long-term investments
Step-by-Step Calculation Process
- Locate the balance sheet for the period you’re analyzing
- Find total assets (usually the bottom line of the assets section)
- Identify total debt (sum of short-term and long-term debt) or total liabilities
- Divide debt by assets using the formula above
- Multiply by 100 if expressing as a percentage
Formula Variations
Conservative approach (funded debt only):
Debt Ratio = (Short-term Debt + Long-term Debt) ÷ Total AssetsComprehensive approach (all liabilities):
Debt Ratio = Total Liabilities ÷ Total AssetsThe comprehensive approach typically yields higher ratios because it includes non-interest-bearing liabilities like accounts payable and deferred revenue.
For consistency and comparability, always use the same calculation method when comparing companies or tracking trends over time. Most financial analysts prefer the funded debt approach because it focuses specifically on obligations that carry interest costs and represent true financial leverage.
Understanding this distinction matters because a company with $1 million in total liabilities might have only $600,000 in actual debt, with the remaining $400,000 in operational liabilities like accounts payable that don’t carry interest charges.
Debt Ratio Examples: Real-World Calculations
Numbers become meaningful through context. Let’s examine three companies with different debt ratios to understand what these figures reveal about financial structure and risk.
Example 1: Conservative Capital Structure (Low Debt Ratio)
TechStart Inc. Balance Sheet Highlights:
- Total Assets: $2,000,000
- Total Debt: $400,000
- Total Equity: $1,600,000
Calculation:
Debt Ratio = $400,000 ÷ $2,000,000 = 0.20 or 20%
Interpretation:
Only 20% of TechStart’s assets are financed through debt. The company relies heavily on equity financing, indicating:
- Low financial risk
- Strong creditor protection (80% asset cushion)
- Limited interest expense burden
- Significant borrowing capacity remaining
- Conservative management approach
This profile is common among technology companies and startups that raise equity capital rather than taking on debt. The low leverage provides stability but may limit returns on equity during growth periods.
Example 2: Balanced Capital Structure (Moderate Debt Ratio)
Manufacturing Co. Balance Sheet Highlights:
- Total Assets: $5,000,000
- Total Debt: $2,500,000
- Total Equity: $2,500,000
Calculation:
Debt Ratio = $2,500,000 ÷ $5,000,000 = 0.50 or 50%
Interpretation:
Manufacturing Co. finances exactly half its assets through debt and half through equity. This balanced structure suggests:
- Moderate financial risk
- Reasonable creditor protection
- Meaningful interest expense obligations
- Limited additional borrowing capacity
- Strategic use of financial leverage
A 50% debt ratio represents a middle ground, enough leverage to enhance equity returns, but not so much that the company faces significant default risk during downturns.
Example 3: Aggressive Capital Structure (High Debt Ratio)
Utility Corp. Balance Sheet Highlights:
- Total Assets: $10,000,000
- Total Debt: $8,000,000
- Total Equity: $2,000,000
Calculation:
Debt Ratio = $8,000,000 ÷ $10,000,000 = 0.80 or 80%
Interpretation:
Utility Corp. finances 80% of its assets through debt, leaving only 20% equity. This aggressive leverage indicates:
- High financial risk
- Limited creditor protection (only 20% cushion)
- Substantial interest expense burden
- Minimal additional borrowing capacity
- Vulnerability to cash flow disruptions
While this appears risky, it’s actually typical for regulated utilities with stable, predictable cash flows. The consistent revenue allows these companies to safely carry higher debt loads than businesses in volatile industries.
Comparative Analysis Table
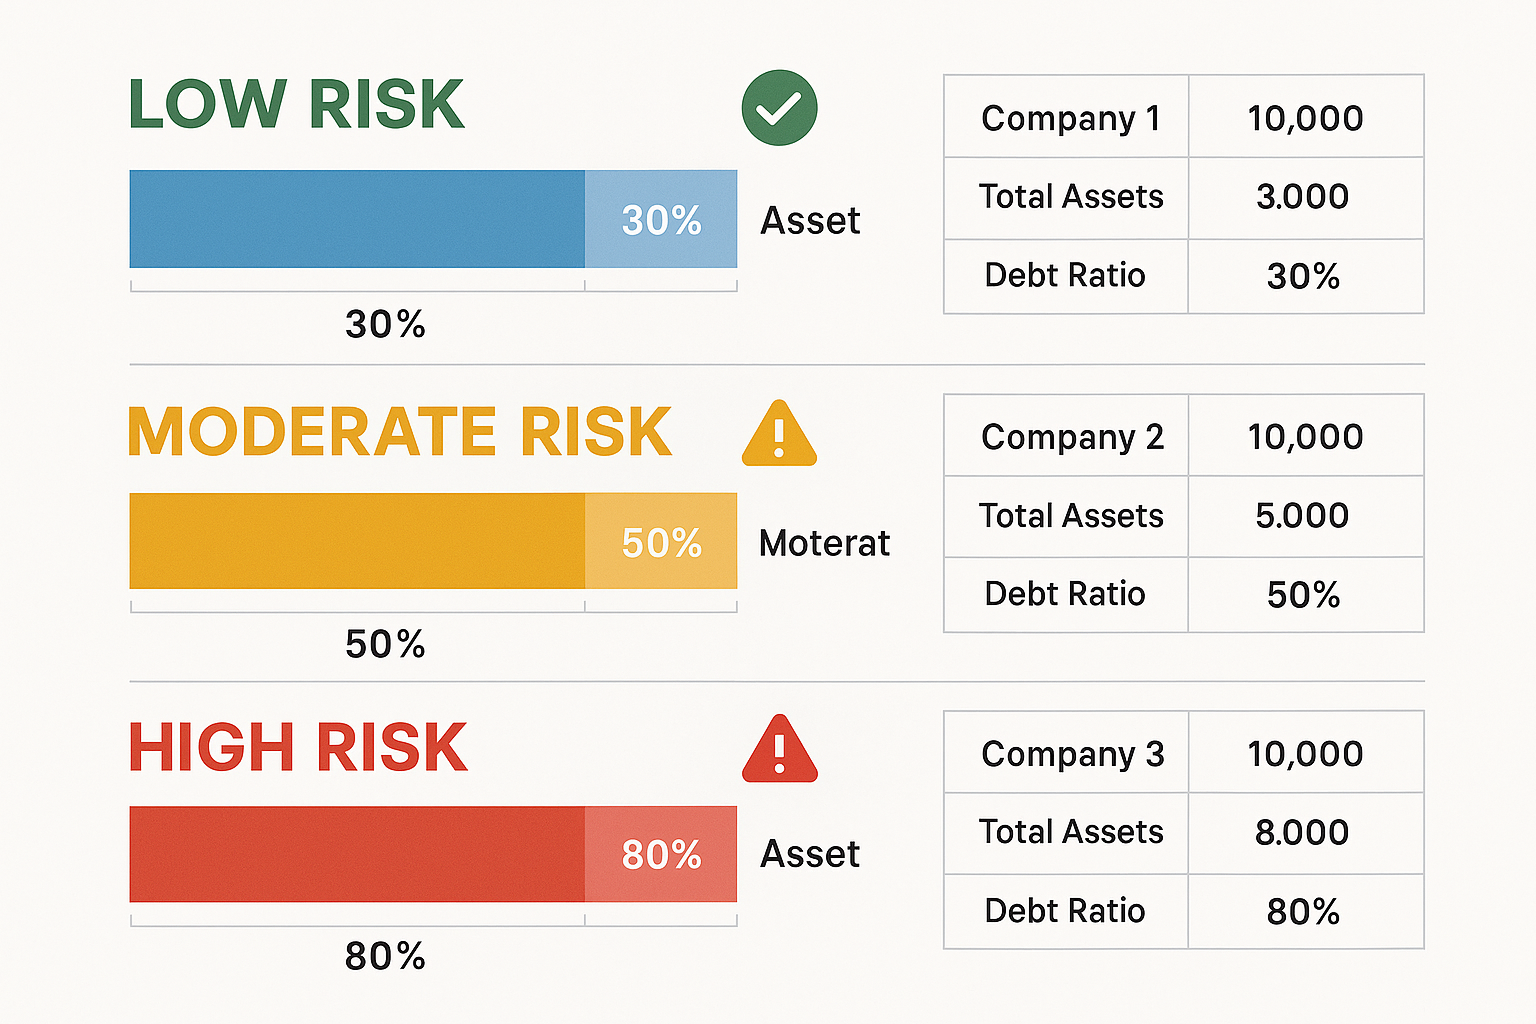
| Company | Total Assets | Total Debt | Debt Ratio | Risk Level | Typical Industry |
|---|---|---|---|---|---|
| TechStart Inc. | $2,000,000 | $400,000 | 20% | Low | Technology, Software |
| Manufacturing Co. | $5,000,000 | $2,500,000 | 50% | Moderate | Manufacturing, Retail |
| Utility Corp. | $10,000,000 | $8,000,000 | 80% | High | Utilities, Real Estate |
These examples demonstrate that the debt ratio must be interpreted within the industry context. What constitutes “high” or “low” varies significantly based on business model, cash flow stability, and capital requirements.
Similar to how the 50/30/20 rule for budgeting provides a framework for personal finance allocation, the debt ratio offers a framework for understanding corporate capital allocation between debt and equity financing.
Interpreting Debt Ratio Values: What the Numbers Mean
A debt ratio is just a number until you understand what it signals about financial health and risk. Here’s how to interpret different values and what they reveal about a company’s leverage position.
Low Debt Ratio: 0.0 to 0.4 (0% to 40%)
Characteristics:
- Conservative financing approach
- Minimal financial risk
- Strong creditor protection
- Limited interest expense
- Significant unused borrowing capacity
Advantages:
- Greater financial flexibility during downturns
- Easier access to additional financing when needed
- Lower bankruptcy risk
- More stable credit ratings
- Less vulnerability to interest rate increases
Disadvantages:
- Potentially lower returns on equity
- Underutilization of financial leverage
- Higher weighted average cost of capital
- May signal missed growth opportunities
Typical Industries: Technology, software, consulting, professional services
A company with a 30% debt ratio could lose 70% of its asset value and still fully repay creditors, a substantial safety margin that creditors appreciate.
Moderate Debt Ratio: 0.4 to 0.6 (40% to 60%)
Characteristics:
- Balanced capital structure
- Moderate financial risk
- Strategic use of leverage
- Reasonable interest coverage
- Some remaining borrowing capacity
Advantages:
- Optimizes returns on equity through leverage
- Maintains financial flexibility
- Acceptable to most creditors and investors
- Balances growth and stability
- Manageable interest obligations
Disadvantages:
- Limited cushion during severe downturns
- Interest rate sensitivity
- Requires consistent cash flow management
- Less room for additional debt
Typical Industries: Manufacturing, retail, diversified industrials, consumer goods
This range represents the “Goldilocks zone” for many companies, enough leverage to enhance returns without creating excessive risk. It’s similar to how the 3x rent rule provides a balanced approach to housing affordability.
High Debt Ratio: 0.6 to 1.0 (60% to 100%)
Characteristics:
- Aggressive financing approach
- Elevated financial risk
- Limited creditor protection
- Substantial interest expense
- Minimal additional borrowing capacity
Advantages:
- Maximizes returns on equity when profitable
- Allows rapid expansion with limited equity dilution
- Tax benefits from interest deductibility
- Appropriate for stable cash flow businesses
Disadvantages:
- High bankruptcy risk during downturns
- Vulnerability to cash flow disruptions
- Difficulty obtaining additional financing
- Potential credit rating downgrades
- Significant interest rate exposure
Typical Industries: Utilities, real estate, telecommunications, capital-intensive infrastructure
A debt ratio of 0.75 means the company must generate enough cash flow to service debt on 75% of its asset base, a heavy burden that requires exceptional operational consistency.
Critical Threshold: Above 1.0 (Above 100%)
Characteristics:
- Liabilities exceed assets
- Negative equity position
- Severe financial distress
- Potential insolvency
A debt ratio above 1.0 indicates the company owes more than it owns. If forced to liquidate, creditors would not be fully repaid, a red flag signaling potential bankruptcy.
When This Occurs:
- Sustained operating losses eroding equity
- Asset write-downs or impairments
- Leveraged buyouts or recapitalizations
- Severe industry downturns
Companies in this position require immediate restructuring, additional equity injections, or face bankruptcy proceedings.
Industry Benchmarks Matter
The “ideal” debt ratio varies dramatically by sector:
- Technology/Software: 0.10 – 0.30 (minimal debt)
- Retail: 0.40 – 0.60 (moderate debt)
- Manufacturing: 0.45 – 0.65 (moderate to high)
- Utilities: 0.60 – 0.80 (high debt)
- Real Estate: 0.65 – 0.85 (high debt)
Always compare a company’s debt ratio to industry peers rather than absolute standards. A 70% debt ratio might signal distress for a software company but represent conservative financing for a utility.
This industry-specific context parallels how financial ratios must be interpreted within their proper business context to generate meaningful insights.
Debt Ratio vs Related Leverage Metrics
The debt ratio is one member of a family of leverage metrics. Understanding how it relates to similar ratios provides a more complete picture of financial risk.
Debt Ratio vs Debt-to-Equity Ratio
The debt-to-equity ratio compares debt directly to shareholders’ equity rather than total assets.
Formula:
Debt-to-Equity Ratio = Total Debt ÷ Total EquityKey Differences:
| Aspect | Debt Ratio | Debt-to-Equity Ratio |
|---|---|---|
| Denominator | Total Assets | Shareholders’ Equity |
| Range | 0 to 1.0+ | 0 to infinity |
| Focus | Asset financing | Equity leverage |
| Interpretation | Proportion of assets from debt | Amount of debt per dollar of equity |
Example Comparison:
Company with $1,000,000 assets, $600,000 debt, $400,000 equity:
- Debt Ratio = $600,000 ÷ $1,000,000 = 0.60 or 60%
- Debt-to-Equity = $600,000 ÷ $400,000 = 1.5
The debt ratio shows 60% of assets are debt-financed. The debt-to-equity ratio shows $1.50 of debt for every $1.00 of equity, two perspectives on the same capital structure.
Debt Ratio vs Debt-to-Capital Ratio
The debt-to-capital ratio measures debt as a proportion of total capital (debt plus equity).
Formula:
Debt-to-Capital Ratio = Total Debt ÷ (Total Debt + Total Equity)This metric is mathematically similar to the debt ratio but explicitly focuses on the capital structure rather than asset financing.
For companies with minimal non-debt liabilities, the debt ratio and debt-to-capital ratio produce nearly identical results.
Interest Coverage Ratio: The Cash Flow Perspective
While the debt ratio measures balance sheet leverage, the interest coverage ratio assesses the company’s ability to service that debt from operating earnings.
Formula:
Interest Coverage Ratio = EBIT ÷ Interest ExpenseWhy It Matters:
A company might have a moderate debt ratio of 50% but struggle with debt service if profitability is low. Conversely, a highly profitable company might safely carry a 70% debt ratio because it generates ample cash flow to cover interest payments.
Example:
Company A and Company B both have 60% debt ratios:
Company A:
- EBIT: $500,000
- Interest Expense: $50,000
- Interest Coverage: 10x (very safe)
Company B:
- EBIT: $100,000
- Interest Expense: $80,000
- Interest Coverage: 1.25x (risky)
Despite identical debt ratios, Company A can easily service its debt while Company B faces potential default if earnings decline even slightly.
Comprehensive Leverage Analysis
Effective financial analysis uses multiple metrics together:
- Debt Ratio — Shows what percentage of assets are debt-financed
- Debt-to-Equity Ratio — Reveals leverage relative to ownership stake
- Interest Coverage Ratio — Indicates the ability to service debt from earnings
- Cash Flow Ratios — Measure debt service capacity from operating cash flow
This multi-metric approach provides depth that no single ratio can offer, similar to how comprehensive balance sheet analysis requires examining multiple components rather than isolated line items.
Practical Applications: Using the Debt Ratio for Investment and Credit Decisions
Understanding the debt ratio concept matters little without knowing how to apply it. Here’s how investors, creditors, and business managers use this metric in real-world decision-making.
For Equity Investors
Risk Assessment:
Before purchasing stock, investors evaluate the debt ratio to gauge financial risk. A company with a 75% debt ratio faces greater bankruptcy risk than one with a 30% ratio—especially during economic downturns.
Return Potential:
Higher leverage amplifies returns on equity. During profitable periods, companies with higher debt ratios often generate superior equity returns because they’re using borrowed capital to fund growth.
Sector Comparison:
Investors compare debt ratios within industries to identify outliers. A retailer with a 70% debt ratio stands out among peers, averaging 50%, signaling either aggressive expansion or potential distress.
Trend Analysis:
Tracking debt ratio changes over time reveals strategic shifts. A declining ratio suggests deleveraging and risk reduction. A rising ratio might indicate aggressive growth investment or deteriorating profitability.
For Creditors and Lenders
Loan Approval Decisions:
Banks and bondholders examine debt ratios before extending credit. Most lenders establish maximum acceptable ratios based on industry and company-specific factors.
Interest Rate Determination:
Higher debt ratios typically result in higher interest rates. A company with a 70% ratio pays more to borrow than one with a 30% ratio because creditors demand compensation for increased risk.
Covenant Monitoring:
Loan agreements often include debt ratio covenants requiring the borrower to maintain ratios below specified thresholds. Violations trigger technical default and potential loan acceleration.
Credit Rating Impact:
Rating agencies like Moody’s and S&P incorporate debt ratios into credit ratings. Higher ratios contribute to lower ratings, which increase borrowing costs and limit financing options.
For Business Management
Capital Structure Optimization:
Management uses debt ratios to balance the tax benefits of debt against bankruptcy risk. The goal is to find the optimal leverage point that maximizes firm value.
Strategic Planning:
Before major investments or acquisitions, executives model how additional debt would affect the debt ratio and whether the company can safely absorb increased leverage.
Competitive Positioning:
Companies benchmark their debt ratios against competitors to ensure their capital structure aligns with industry norms and doesn’t create competitive disadvantages.
Investor Communication:
Management explains debt ratio trends to shareholders, particularly when making significant capital structure changes like debt refinancing or equity issuance.
Decision Framework Example
Scenario: An investor evaluates two retail companies:
Retailer A:
- Debt Ratio: 45%
- 5-year average: 42%
- Industry average: 50%
- Interest Coverage: 8x
Retailer B:
- Debt Ratio: 68%
- 5-year average: 52%
- Industry average: 50%
- Interest Coverage: 2.5x
Analysis:
Retailer A shows conservative, stable leverage below industry norms with strong interest coverage, a lower risk profile suitable for conservative investors.
Retailer B displays rising leverage above the industry average with marginal interest coverage, higher risk requiring investigation into whether debt-funded profitable growth or covered operating shortfalls.
This analytical approach mirrors the evidence-based decision-making framework used in capital allocation strategies, where data-driven insights guide resource deployment.
Limitations to Consider
The debt ratio has important limitations:
Book Value vs. Market Value:
The ratio uses book values from the balance sheet, which may differ significantly from market values, especially for assets like real estate or intangibles.
Off-Balance-Sheet Obligations:
Operating leases, pension obligations, and contingent liabilities may not appear in total debt but represent real financial commitments.
Industry Differences:
Cross-industry comparisons are often meaningless due to fundamental business model differences.
Snapshot in Time:
A single debt ratio represents one moment. Seasonal businesses may show dramatically different ratios at quarter-end versus mid-quarter.
Quality of Assets:
A 50% debt ratio backed by liquid, high-quality assets differs fundamentally from the same ratio backed by obsolete inventory or impaired assets.
Effective analysis combines the debt ratio with other metrics, qualitative factors, and industry knowledge to form comprehensive conclusions about financial health and risk.
How to Improve or Manage Your Debt Ratio
Whether you’re managing a business or analyzing one, understanding how to influence the debt ratio provides strategic insight into financial flexibility and risk management.
Strategies to Lower the Debt Ratio
1. Reduce Total Debt
The most direct approach is paying down existing obligations:
- Accelerate debt repayment using excess cash flow
- Refinance high-interest debt with lower-cost alternatives
- Sell non-core assets and use proceeds to retire debt
- Prioritize debt reduction over dividends or share buybacks
Impact Example:
Company with $1M assets and $600K debt (60% ratio) pays down $200K in debt:
- New debt: $400K
- New ratio: $400K ÷ $1M = 40%
2. Increase Total Assets
Growing the asset base without proportional debt increases lowers the ratio:
- Retain earnings rather than distributing dividends
- Issue equity to raise capital for asset purchases
- Invest in profitable projects that generate retained earnings
- Acquire assets using equity financing
Impact Example:
A company with $1M assets and $600K debt (60% ratio) raises $400K in equity and purchases assets:
- New assets: $1.4M
- Debt unchanged: $600K
- New ratio: $600K ÷ $1.4M = 43%
3. Convert Debt to Equity
Restructuring debt obligations into equity stakes reduces liabilities:
- Debt-for-equity swaps with creditors
- Convertible bond conversions when bondholders exercise options
- Creditor negotiations during financial distress
This approach is common in bankruptcy restructurings where creditors accept equity ownership in exchange for debt forgiveness.
When a Higher Debt Ratio Makes Sense
Contrary to intuition, increasing leverage isn’t always negative:
Growth Investment:
Companies in expansion mode may temporarily increase debt ratios to fund profitable projects that will generate future cash flows exceeding the cost of debt.
Tax Optimization:
Interest expense is tax-deductible, creating a “tax shield” that reduces the effective cost of debt. Companies in high tax brackets benefit more from debt financing.
Low Interest Rate Environment:
When borrowing costs are historically low, taking on additional debt at favorable rates can make strategic sense, even if it increases the debt ratio.
Stable Cash Flows:
Businesses with predictable, recession-resistant revenue can safely carry higher debt ratios than cyclical companies because they’re confident in their ability to service debt through downturns.
Maintaining Optimal Debt Ratio
Rather than minimizing or maximizing leverage, sophisticated companies target an optimal range that balances:
- Cost of capital — The weighted average cost of debt and equity
- Financial flexibility — Ability to access capital when opportunities arise
- Risk tolerance — Management and shareholder appetite for leverage
- Industry norms — Competitive positioning relative to peers
Monitoring Framework:
- Quarterly calculation of debt ratio from financial statements
- Trend analysis comparing the current ratio to historical averages
- Peer benchmarking against industry competitors
- Scenario planning, modeling ratio impacts of strategic decisions
- Covenant compliance, ensuring loan agreement requirements are met
This disciplined approach to leverage management parallels the systematic methodology used in risk management strategies that balance return potential against downside protection.
Personal Finance Application
While the debt ratio is primarily a corporate metric, the underlying principle applies to personal finances:
Personal Debt Ratio = Total Debt ÷ Total Assets
An individual with $300,000 in assets (home equity, investments, savings) and $150,000 in debt (mortgage, student loans, credit cards) has a 50% personal debt ratio.
Healthy Personal Ranges:
- Below 30%: Strong financial position
- 30-50%: Moderate leverage, typical for homeowners
- Above 50%: High leverage requiring attention
Reducing personal debt ratios follows similar strategies: pay down debt, increase assets through saving and investing, or both simultaneously.
The 4% rule for retirement withdrawals and the 20/4/10 rule for car buying represent similar mathematical frameworks that guide personal financial decisions through simple, evidence-based ratios.
💰 Debt Ratio Calculator
Calculate your company’s financial leverage in seconds
Conclusion: The Math Behind Leverage and Financial Risk
The debt ratio distills complex capital structure decisions into a single, powerful number that reveals how companies balance growth ambitions against financial stability.
By dividing total debt by total assets, this metric quantifies the fundamental trade-off at the heart of corporate finance: using other people’s money to amplify returns while accepting the risk that comes with financial obligations.
Key insights to remember:
Understanding that a 60% debt ratio means creditors have claims on 60% of everything the company owns provides immediate context for evaluating financial risk. Recognizing that this same ratio might signal distress for a software company but represent conservative financing for a utility demonstrates why industry context matters as much as the number itself.
The debt ratio works best as part of a comprehensive analytical framework alongside metrics like the debt-to-equity ratio, interest coverage, and cash flow analysis. No single metric tells the complete story, but together they reveal the financial health and risk profile that drive investment and credit decisions.
Actionable next steps:
- Calculate the debt ratio for companies you own or are considering investing in
- Compare ratios within industries to identify outliers and trends
- Track changes over time to understand strategic direction and financial trajectory
- Combine with other metrics, like interest coverage, for a comprehensive analysis
- Consider the industry context before concluding risk levels
The math behind money is rarely complicated. The debt ratio proves that sophisticated financial analysis often reduces to simple division: total debt divided by total assets. But interpreting that result, understanding what it means in context, and using it to make better decisions requires the kind of evidence-based thinking that separates successful investors from those who rely on intuition alone.
Financial literacy begins with understanding these fundamental relationships between assets, liabilities, and equity. The debt ratio provides a clear window into how companies finance their operations and the risks they accept in pursuit of returns.
Whether you’re evaluating investment opportunities, assessing credit risk, or managing a business, this metric offers a data-driven foundation for decisions that affect financial outcomes. Master this concept, and you’ve taken another step toward understanding the mathematical principles that govern wealth building and risk management.
References
[1] Corporate Finance Institute. “Debt Ratio.” CFI Education Inc., 2025.
[2] Investopedia. “Debt Ratio: Definition, Formula, and Analysis.” Dotdash Meredith, 2025.
[3] CFA Institute. “Financial Statement Analysis: Leverage Ratios.” CFA Institute, 2025.
[4] U.S. Securities and Exchange Commission. “Beginners’ Guide to Financial Statements.” SEC.gov, 2025.
[5] Federal Reserve Bank. “Financial Ratios and Industry Benchmarks.” Federal Reserve System, 2025.
[6] Morningstar. “Understanding Corporate Leverage Metrics.” Morningstar Investment Research, 2025.
Author Bio
Max Fonji is the founder of The Rich Guy Math, where he teaches the mathematical principles behind wealth building, investing, and financial decision-making. With a background in financial analysis and data-driven education, Max breaks down complex financial concepts into clear, actionable insights that empower readers to make evidence-based money decisions.
Educational Disclaimer
This article is provided for educational and informational purposes only and does not constitute financial, investment, tax, or legal advice. The debt ratio is one of many metrics used in financial analysis, and no single ratio should be used in isolation to make investment or credit decisions. Financial situations vary significantly based on individual circumstances, industry factors, and economic conditions. Always conduct thorough due diligence, consider multiple analytical perspectives, and consult with qualified financial professionals before making investment, lending, or business decisions. Past performance and historical ratios do not guarantee future results. The Rich Guy Math and its authors assume no liability for financial decisions made based on the information presented in this article.
Frequently Asked Questions (FAQ)
What is a good debt ratio?
A “good” debt ratio depends entirely on industry context. Generally, ratios below 0.4 (40%) indicate conservative financing with low risk, while ratios above 0.6 (60%) suggest aggressive leverage with higher risk. Technology companies often maintain ratios below 30%, while utilities commonly operate with ratios of 60-80%. Compare companies within the same industry rather than applying universal standards.
How is the debt ratio different from the debt-to-equity ratio?
The debt ratio divides total debt by total assets, showing what percentage of assets are debt-financed. The debt-to-equity ratio divides total debt by shareholders’ equity, showing how much debt exists per dollar of ownership stake. Both measure leverage but from different perspectives—the debt ratio focuses on asset financing while debt-to-equity emphasizes the relationship between creditor and owner claims.
Can a debt ratio be greater than 1?
Yes. A debt ratio above 1.0 (100%) means liabilities exceed assets, indicating negative equity. This occurs when companies experience sustained losses, significant asset write-downs, or take on excessive debt relative to their asset base. Ratios above 1.0 signal severe financial distress and potential insolvency, as the company owes more than it owns.
What does a debt ratio of 0.5 mean?
A debt ratio of 0.5 (or 50%) means exactly half of the company’s assets are financed through debt and half through equity. This represents a balanced capital structure with moderate financial risk. The company has reasonable creditor protection (50% asset cushion) while still utilizing leverage to potentially enhance returns on equity.
Should I use total debt or total liabilities in the debt ratio formula?
Both approaches are valid but measure slightly different things. Using total debt (interest-bearing obligations only) focuses on financial leverage and is preferred by most analysts. Using total liabilities (all obligations including accounts payable and accrued expenses) provides a more comprehensive view of total obligations. The key is consistency—use the same method when comparing companies or tracking trends over time.
How often should debt ratios be calculated?
For investors and analysts, calculate debt ratios quarterly when companies release financial statements. For business management, monthly or quarterly monitoring is appropriate depending on business volatility and leverage levels. Companies with high debt ratios or those undergoing significant changes should monitor more frequently. Trend analysis over multiple periods provides more insight than single point-in-time calculations.
What is the relationship between debt ratio and credit ratings?
Credit rating agencies incorporate debt ratios as a key factor in determining creditworthiness. Higher debt ratios generally contribute to lower credit ratings because they indicate greater financial risk and reduced ability to absorb adverse events. However, ratings also consider profitability, cash flow, industry position, and management quality. A company with a high debt ratio but strong cash flow might maintain better ratings than one with a moderate ratio but weak profitability.
How do you interpret a debt ratio of 0?
A debt ratio of 0 means the company has no debt—all assets are financed entirely through equity. While this indicates zero financial risk from leverage, it may also suggest the company is not optimizing its capital structure. Moderate debt often reduces the weighted average cost of capital through tax benefits and can enhance returns on equity. However, for certain businesses (especially startups and technology companies), zero debt is appropriate and common.
