Ever wondered why some companies seem profitable on paper but still struggle to pay their bills? Or why savvy investors look beyond simple profit numbers when evaluating stocks? The answer often lies in understanding EBITDA margin — a powerful metric that strips away accounting tricks to reveal a company’s true operational efficiency.
If you’re new to investing or just starting to analyze stock market opportunities, EBITDA margin might sound like financial jargon. But here’s the truth: this single number can tell you more about a company’s health than traditional profit margins ever could. It’s the secret weapon that professional investors use to compare companies across different industries, tax structures, and debt levels.
In this comprehensive guide, we’ll break down everything you need to know about EBITDA margin in plain English — no MBA required. You’ll learn what it is, how to calculate it, why it matters for your investment decisions, and how to avoid the common pitfalls that trip up even experienced investors.
TL;DR
Quick Facts About EBITDA Margin:
- EBITDA margin measures a company’s operating profitability by showing what percentage of revenue remains after covering operating expenses, excluding interest, taxes, depreciation, and amortization
- The formula is simple: (EBITDA ÷ Revenue) × 100 — higher percentages typically indicate better operational efficiency
- EBITDA margin allows fair comparisons between companies with different capital structures, tax situations, and accounting methods
- A “good” EBITDA margin varies by industry, but generally ranges from 10-25% for most sectors, with technology and software companies often exceeding 30%
- While powerful, EBITDA margin has limitations — it ignores capital expenditures, working capital changes, and debt obligations, so never use it as your only metric
What Is EBITDA Margin?
In simple terms, EBITDA margin means the percentage of a company’s revenue that turns into earnings before accounting for interest, taxes, depreciation, and amortization.
Let’s break that down even further. EBITDA stands for:
- Earnings
- Before
- Interest
- Taxes
- Depreciation
- Amortization
The margin part converts this dollar amount into a percentage of total revenue, making it easy to compare companies of different sizes.
Think of EBITDA margin as a way to measure how efficiently a company converts sales into cash from operations, without getting distracted by how the business is financed (debt vs. equity), where it’s located (different tax rates), or how old its equipment is (depreciation).
Why Remove These Items?
Here’s why each exclusion matters:
Interest: Reflects financing decisions, not operational performance. A heavily indebted company and a debt-free company can have identical operations but vastly different interest expenses.
Taxes: Vary by country, state, and corporate structure. Removing taxes lets you compare a Texas-based company with a California one fairly.
Depreciation & Amortization: These are non-cash accounting expenses that allocate the cost of assets over time. They don’t reflect actual cash leaving the business today.
By stripping these away, EBITDA margin reveals the core profitability of the business operations themselves.
The EBITDA Margin Formula & How to Calculate It
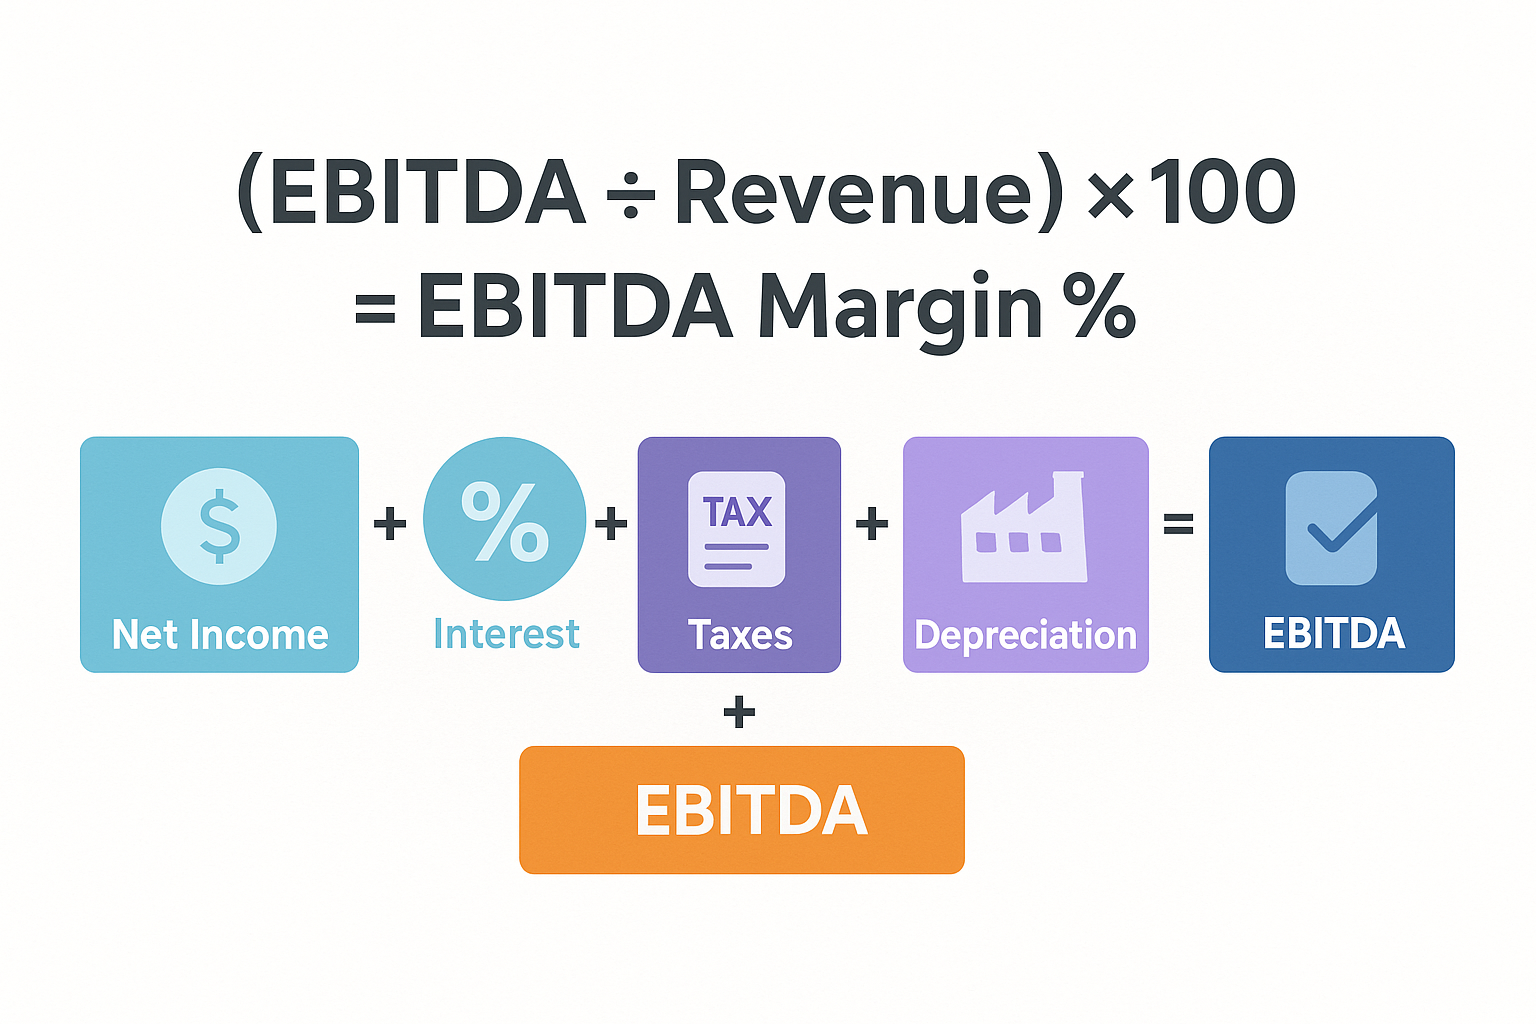
The formula for EBITDA margin is: (EBITDA ÷ Total Revenue) × 100
But first, you need to calculate EBITDA itself. There are two common approaches:
Method 1: Top-Down Approach
Start with Net Income (from the income statement) and add back:
EBITDA = Net Income + Interest + Taxes + Depreciation + AmortizationMethod 2: Bottom-Up Approach
Start with Operating Income (EBIT) and add back:
EBITDA = Operating Income + Depreciation + AmortizationOnce you have EBITDA, calculating the margin is straightforward:
EBITDA Margin (%) = (EBITDA ÷ Total Revenue) × 100Real-World Calculation Example
Let’s say TechCorp Inc. reported these numbers for 2025:
| Financial Metric | Amount |
|---|---|
| Total Revenue | $10,000,000 |
| Cost of Goods Sold | $4,000,000 |
| Operating Expenses | $3,000,000 |
| Depreciation & Amortization | $500,000 |
| Interest Expense | $200,000 |
| Taxes | $600,000 |
| Net Income | $1,700,000 |
Step 1: Calculate EBITDA
Using the top-down method:
EBITDA = $1,700,000 (Net Income) + $200,000 (Interest) + $600,000 (Taxes) + $500,000 (D&A)
EBITDA = $3,000,000
Step 2: Calculate EBITDA Margin
EBITDA Margin = ($3,000,000 ÷ $10,000,000) × 100
EBITDA Margin = 30%
This means TechCorp converts 30% of every revenue dollar into operational earnings before accounting for financing, taxes, and non-cash charges. That’s pretty strong!
Why EBITDA Margin Matters: Key Benefits for Investors
Understanding why professional investors rely on EBITDA margin can transform how you evaluate potential investments. Here are the main advantages:
1. Enables Apples-to-Apples Comparisons
Companies in the same industry can have wildly different:
- Capital structures (some use debt, others don’t)
- Tax jurisdictions (international vs. domestic operations)
- Asset ages (newer companies vs. established ones with depreciated assets)
EBITDA margin neutralizes these differences, letting you compare operational efficiency directly.
2. Highlights Operational Efficiency
A higher EBITDA margin usually indicates that a company:
- Controls costs effectively
- Has pricing power in its market
- Operates with strong economies of scale
- Manages its business model efficiently
3. Useful for Valuation Multiples
The EV/EBITDA ratio (Enterprise Value divided by EBITDA) is one of the most popular valuation metrics in finance. It’s often considered superior to P/E ratios because it:
- Accounts for debt levels
- Works for companies with different tax situations
- Provides a clearer picture of acquisition value
When you’re researching high dividend stocks or evaluating passive income opportunities, EBITDA margin helps identify companies with sustainable cash generation.
4. Better for Capital-Intensive Industries
Industries like manufacturing, telecommunications, and energy require massive upfront investments in equipment and infrastructure. Depreciation charges can make these companies look less profitable than they actually are on a cash basis.
EBITDA margin reveals the true earning power by excluding these non-cash charges.
What’s a Good EBITDA Margin? Industry Benchmarks
There’s no universal “good” EBITDA margin — it varies significantly by industry. Here’s what to expect across different sectors:
| Industry | Typical EBITDA Margin Range | Notes |
|---|---|---|
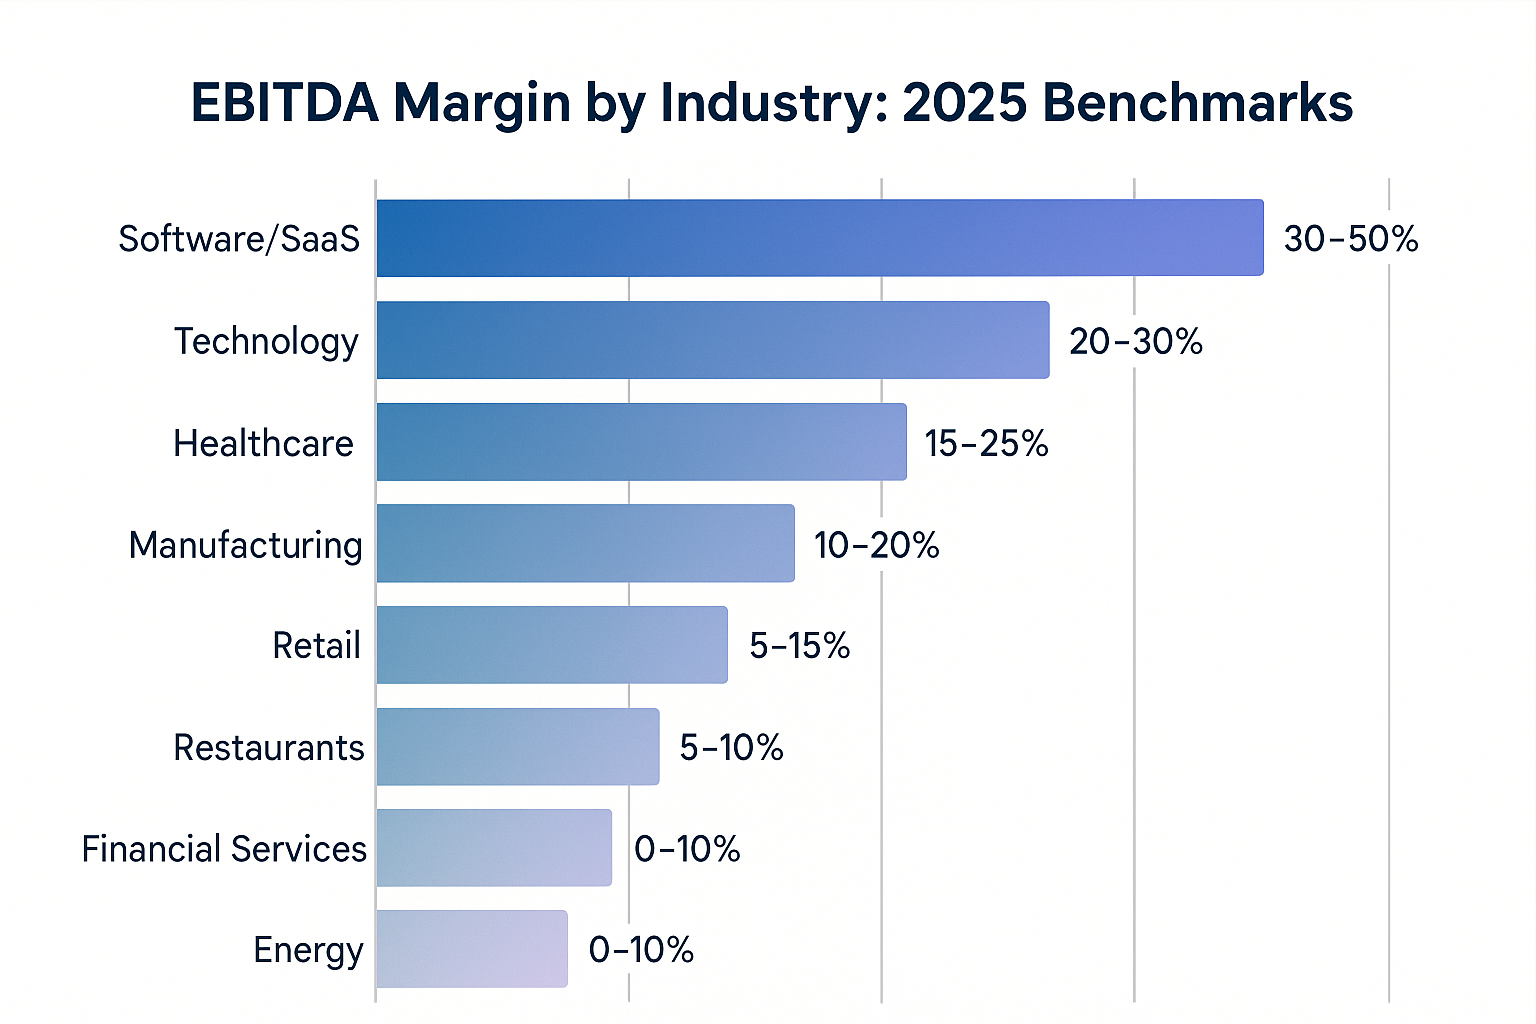
| Software/SaaS | 30-50%+ | High margins due to low variable costs |
| Technology Hardware | 15-25% | Franchise models are typically higher |
| Healthcare | 15-30% | Varies widely by subsector |
| Retail | 5-15% | Thin margins, high competition |
| Restaurants | 10-20% | Franchise models typically higher |
| Manufacturing | 10-20% | Capital-intensive, moderate margins |
| Financial Services | 20-40% | Asset-light business models |
| Energy/Utilities | 20-35% | Regulated industries with stable margins |
| Real Estate | 25-45% | Varies by property type and location |
Context Is Everything
A 15% EBITDA margin might be:
- Excellent for a grocery retailer
- Average for a manufacturing company
- Poor for a software business
Always compare companies within the same industry and consider:
- Company size and maturity
- Competitive landscape
- Economic conditions
- Growth stage (high-growth companies often sacrifice margins temporarily)
EBITDA Margin vs Other Profitability Metrics
Understanding how EBITDA margin compares to other metrics helps you build a complete financial picture:
EBITDA Margin vs Net Profit Margin
Net Profit Margin = (Net Income ÷ Revenue) × 100
- Includes: All expenses, including interest, taxes, and D&A
- Best for: Understanding bottom-line profitability
- Limitation: Affected by financing decisions and tax strategies
EBITDA Margin focuses purely on operational performance, while net profit margin shows the complete picture after all expenses.
EBITDA Margin vs Operating Margin
Operating Margin = (Operating Income ÷ Revenue) × 100
- Includes: Depreciation and amortization
- Excludes: Interest and taxes
- Best for: Operational efficiency, including asset utilization
EBITDA margin is always higher than operating margin because it adds back D&A expenses.
EBITDA Margin vs Gross Margin
Gross Margin = (Gross Profit ÷ Revenue) × 100
- Only subtracts: Direct costs of goods sold
- Excludes: All operating expenses, D&A, interest, taxes
- Best for: Pricing power and production efficiency
Gross margin is the highest of all these metrics because it includes the fewest expenses.
Quick Comparison Example
Using our TechCorp example:
| Metric | Calculation | Result |
|---|---|---|
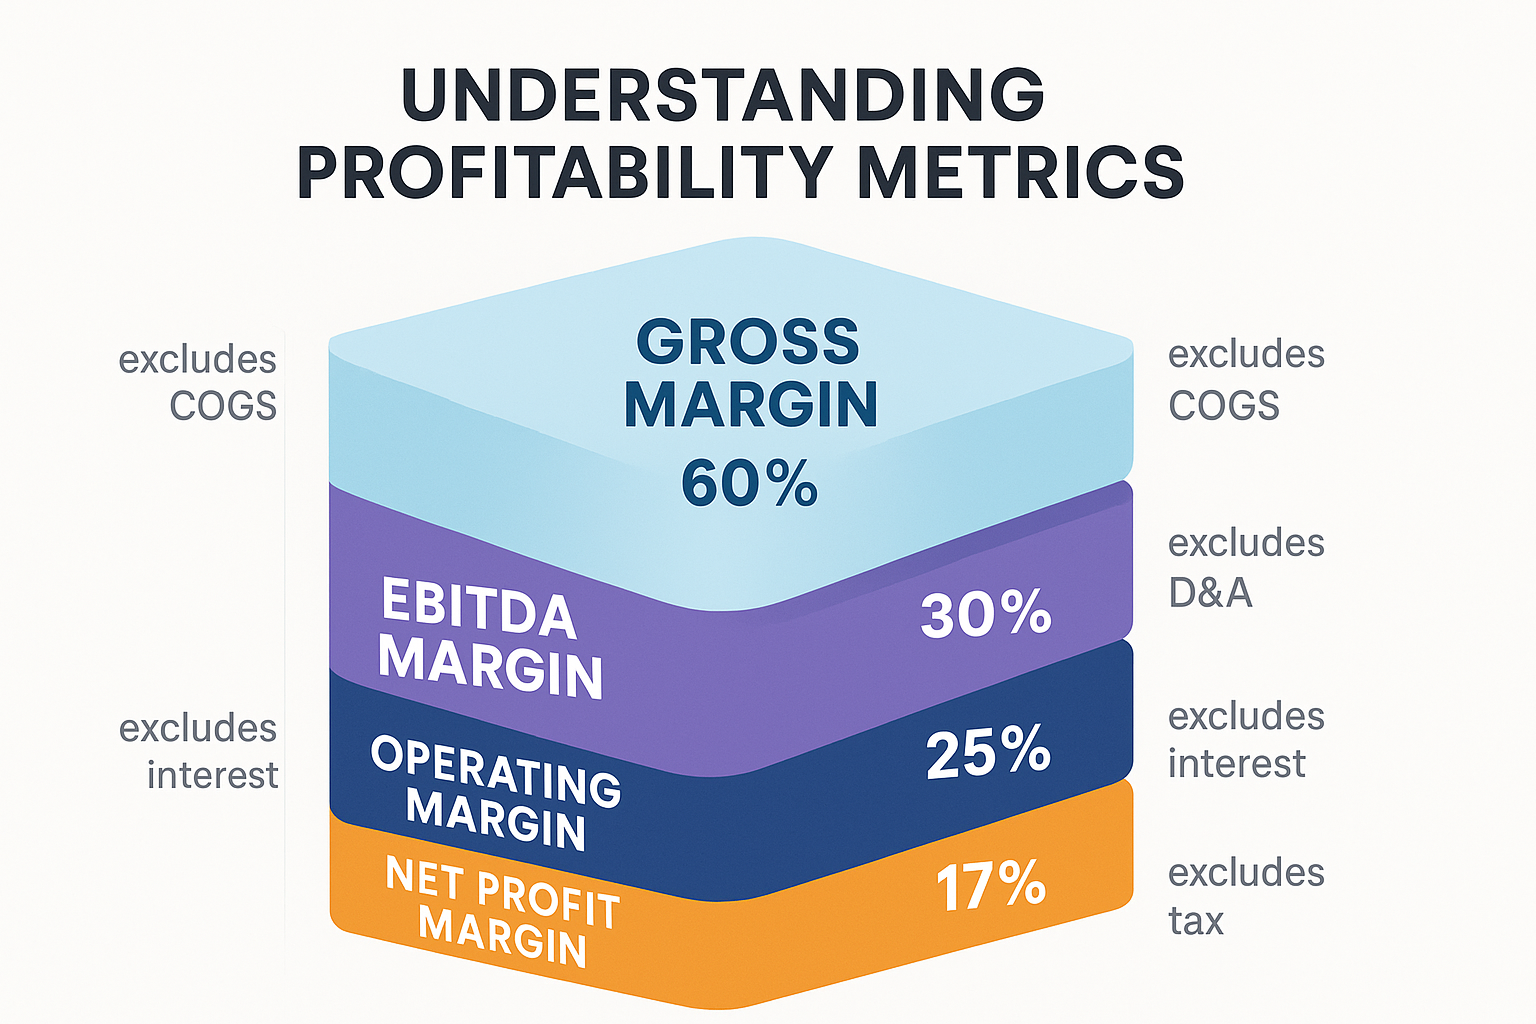
| Gross Margin | ($6M ÷ $10M) × 100 | 60% |
| EBITDA Margin | ($3M ÷ $10M) × 100 | 30% |
| Operating Margin | ($2.5M ÷ $10M) × 100 | 25% |
| Net Profit Margin | ($1.7M ÷ $10M) × 100 | 17% |
Each metric tells a different part of the profitability story!
How to Interpret & Use EBITDA Margin in Investment Decisions
Now that you understand what EBITDA margin is, here’s how to actually use it when evaluating potential investments:
Step 1: Calculate the Margin Over Multiple Periods
Don’t just look at one year. Calculate EBITDA margin for at least 3-5 years to identify trends:
- Rising margin = Improving efficiency, scaling operations, better cost control
- Stable margin = Consistent operations, mature business
- Declining margin = Increasing competition, rising costs, and operational challenges
Step 2: Compare Against Industry Peers
Pull up 3-5 competitors in the same industry and compare their EBITDA margins. This reveals:
- Market leaders with competitive advantages
- Underperformers that might be turnaround opportunities
- Industry-wide trends affecting all players
Step 3: Analyze in Context with Other Metrics
Never use EBITDA margin in isolation. Combine it with:
- Revenue growth: High margins with declining revenue might signal trouble
- Free cash flow: EBITDA doesn’t account for capital expenditures
- Return on invested capital (ROIC): Shows how efficiently the company uses capital
- Debt levels: High EBITDA can be misleading if the company is drowning in debt
When researching opportunities for dividend investing, strong EBITDA margins often correlate with sustainable dividend payments.
Step 4: Look for Red Flags
Be cautious when:
- EBITDA margin is significantly higher than free cash flow margin (suggests aggressive accounting)
- Margins fluctuate wildly year-to-year (indicates unstable operations)
- The company emphasizes EBITDA but ignores GAAP earnings (possible manipulation)
- Capital expenditures consistently exceed depreciation (EBITDA overstates true profitability)
📊 EBITDA Margin Calculator
Calculate your company’s operational profitability
Advantages of Using EBITDA Margin
Let’s dive deeper into why EBITDA margin has become such a popular metric among investors, analysts, and business owners:
1. Simplifies Complex Comparisons
When you’re comparing companies across different countries, industries, or business models, EBITDA margin creates a level playing field. It answers the question: “How good is this company at turning sales into operational profit?”
2. Focuses on Cash-Generating Ability
When depreciation and amortization are legitimate accounting expenses, they don’t represent cash leaving the company today. EBITDA margin highlights the cash-generating power of the business, which is crucial for:
- Funding growth initiatives
- Paying down debt
- Returning capital to shareholders
- Weathering economic downturns
3. Useful for Acquisition Analysis
When companies consider acquisitions, they often use EBITDA multiples to value targets. Why? Because:
- The acquiring company can apply its own capital structure
- Tax situations will change post-acquisition
- Depreciation schedules can be adjusted
EBITDA margin helps identify businesses with strong operational fundamentals regardless of their current financial structure.
4. Tracks Performance Over Time
By monitoring EBITDA margin quarter-over-quarter and year-over-year, you can spot important trends:
- Improving margins → Successful cost-cutting, better pricing, or economies of scale
- Deteriorating margins → Rising competition, inflation pressures, or operational inefficiencies
This makes it invaluable for understanding what moves the stock market and predicting future performance.
5. Industry-Agnostic Metric
Unlike metrics that work well only in specific sectors, EBITDA margin applies across virtually all industries. Whether you’re analyzing:
- A software startup
- A manufacturing giant
- A retail chain
- A healthcare provider
…EBITDA margin provides meaningful insights.
Limitations & Common Mistakes with EBITDA Margin
Despite its usefulness, EBITDA margin has significant limitations. Understanding these pitfalls is crucial for making smart investment decisions:
1. Ignores Capital Expenditures (CapEx)
This is the biggest weakness of EBITDA margin.
While depreciation is added back, companies still need to spend real cash to maintain and grow their asset base. A company with:
- High EBITDA margin (30%)
- Massive ongoing CapEx requirements
- Low free cash flow
…might actually be less attractive than a company with a 20% EBITDA margin but minimal CapEx needs.
Real-world example: A telecommunications company might show a 35% EBITDA margin but require billions in annual infrastructure upgrades. A software company with a 30% EBITDA margin and near-zero CapEx is fundamentally different.
2. Doesn’t Account for Working Capital Changes
EBITDA margin ignores changes in:
- Accounts receivable
- Inventory
- Accounts payable
A rapidly growing company might show improving EBITDA margins while actually consuming cash to fund inventory and customer credit.
3. Can Mask Poor Financial Health
Companies drowning in debt love to emphasize EBITDA because it excludes interest payments. But those interest payments are very real obligations!
Warning sign: A company promoting EBITDA margins while downplaying net income or free cash flow.
4. Vulnerable to Accounting Manipulation
Since EBITDA isn’t a GAAP (Generally Accepted Accounting Principles) metric, companies have some flexibility in what they include or exclude. Some aggressive companies create “adjusted EBITDA” by excluding:
- Stock-based compensation (a real expense!)
- Restructuring charges (that happen every year)
- “One-time” expenses (that aren’t really one-time)
The SEC has warned about “non-GAAP” metric abuse for this very reason.
5. Less Relevant for Asset-Light Businesses
For companies with minimal fixed assets (like consulting firms or many service businesses), the difference between EBITDA margin and operating margin is tiny. In these cases, simpler metrics might be more useful.
Common Mistakes Investors Make
- Using EBITDA margin as the only metric: Always combine it with free cash flow, net income, and return metrics
- Ignoring industry context: A 15% margin means different things in different sectors
- Forgetting about debt: High EBITDA doesn’t help if interest payments consume all the cash
- Accepting “adjusted” EBITDA without scrutiny: Always read the footnotes to see what’s being excluded
- Comparing companies at different life stages: Mature companies should have higher margins than high-growth startups
EBITDA Margin in Different Industries: A Deeper Look
Understanding industry-specific dynamics helps you interpret EBITDA margins correctly. Let’s examine several key sectors:
Technology & Software
Typical Range: 25-50%+
Why So High?
- Low marginal costs (selling one more software license costs almost nothing)
- Minimal physical infrastructure
- High gross margins (often 70-90%)
- Scalable business models
What to Watch:
- Customer acquisition costs (CAC)
- Churn rates
- Research & development spending (often excluded from EBITDA)
Example: Enterprise SaaS companies often achieve 30-40% EBITDA margins once they reach scale, making them attractive for long-term investing strategies.
Manufacturing
Typical Range: 10-20%
Why Lower?
- High cost of goods sold
- Significant depreciation (even though it’s added back, it reflects real asset needs)
- Commodity price sensitivity
- Labor costs
What to Watch:
- CapEx requirements (often equal to or exceed depreciation)
- Inventory management
- Supply chain efficiency
Retail
Typical Range: 5-15%
Why So Thin?
- Intense competition
- Low pricing power
- High operating expenses (rent, labor)
- Inventory carrying costs
What to Watch:
- Same-store sales growth
- Inventory turnover
- E-commerce vs. brick-and-mortar mix
Healthcare
Typical Range: 15-30%
Why It Varies:
- Different subsectors (pharma, devices, services) have vastly different economics
- Regulatory environment impacts margins
- Reimbursement rates affect profitability
What to Watch:
- Regulatory changes
- Patent expirations (for pharma)
- Reimbursement rate changes
Energy & Utilities
Typical Range: 20-35%
Why Relatively Stable?
- Regulated industries with predictable returns
- Essential services with steady demand
- Long-term contracts
What to Watch:
- Commodity price exposure (for energy)
- Regulatory changes
- Infrastructure investment requirements
How to Find EBITDA Information for Public Companies
Ready to start analyzing companies using EBITDA margin? Here’s where to find the data:
Financial Statements
Income Statement: You’ll find all the components you need:
- Revenue (top line)
- Operating income
- Depreciation & amortization (sometimes in the cash flow statement)
- Interest expense
- Tax expense
- Net income
Where to Access Financial Statements
Free Resources:
- SEC.gov EDGAR database: Official source for all public company filings (10-K annual reports, 10-Q quarterly reports)
- Company investor relations websites: Often present data more clearly than SEC filings
- Yahoo Finance: Provides summarized financial statements
- Google Finance: Basic financial data
- Morningstar: Excellent free data with deeper analysis available for premium members
Premium Resource
- Bloomberg Terminal
- FactSet
- S&P Capital IQ
- Seeking Alpha Premium
Pro Tips for Finding EBITDA
- Look for “Adjusted EBITDA” in earnings releases: Many companies calculate it for you, but verify their adjustments
- Check the cash flow statement: Depreciation and amortization are usually clearly listed
- Read the MD&A section: Management’s Discussion and Analysis often discusses EBITDA and margin trends
- Use financial data aggregators: Sites like Morningstar calculate EBITDA for you
Example: Finding EBITDA for Apple Inc.
- Visit SEC.gov and search for Apple (ticker: AAPL)
- Open the latest 10-K annual report
- Navigate to the Consolidated Statements of Operations
- Locate: Revenue, Operating Income, Net Income
- Check the Cash Flow Statement for Depreciation & Amortization
- Calculate EBITDA using the formulas above
Real-World Case Study: Comparing Two Companies
Let’s put EBITDA margin to work with a practical comparison between two hypothetical companies in the same industry:
Company A: “TechGrowth Inc.”
| Metric | Amount |
|---|---|
| Revenue | $500 million |
| EBITDA | $125 million |
| EBITDA Margin | 25% |
| Net Income | $60 million |
| Depreciation & Amortization | $20 million |
| Interest Expense | $30 million |
| Capital Expenditures | $25 million |
| Debt | $400 million |
Company B: “TechStable Corp.”
| Metric | Amount |
|---|---|
| Revenue | $500 million |
| EBITDA | $100 million |
| EBITDA Margin | 20% |
| Net Income | $75 million |
| Depreciation & Amortization | $10 million |
| Interest Expense | $5 million |
| Capital Expenditures | $12 million |
| Debt | $50 million |
Initial Observation
At first glance, Company A looks better with a 25% EBITDA margin vs. Company B’s 20%.
Deeper Analysis Reveals a Different Story
Free Cash Flow Comparison:
Company A:
FCF = EBITDA - CapEx - Interest - Taxes (estimated)
FCF = $125M - $25M - $30M - $10M = $60M
FCF Margin = 12%
Company B:
FCF = EBITDA - CapEx - Interest - Taxes (estimated)
FCF = $100M - $12M - $5M - $8M = $75M
FCF Margin = 15%
Key Insights:
- Company B actually generates more cash despite a lower EBITDA margin
- Company A’s high debt creates $30M in annual interest payments
- Company A requires more CapEx to maintain operations
- Company B’s higher net income suggests better overall financial health
The Verdict
This case study illustrates why EBITDA margin should never be used in isolation. While Company A has superior operational efficiency (higher EBITDA margin), Company B is the better investment due to:
- Lower debt burden
- Higher free cash flow
- More sustainable business model
- Better ability to pay dividends or reinvest in growth
When evaluating stock market opportunities, always look at the complete financial picture!
Key Risks & Red Flags to Watch For
Sophisticated investors know that EBITDA margin can sometimes hide problems. Here are critical warning signs:
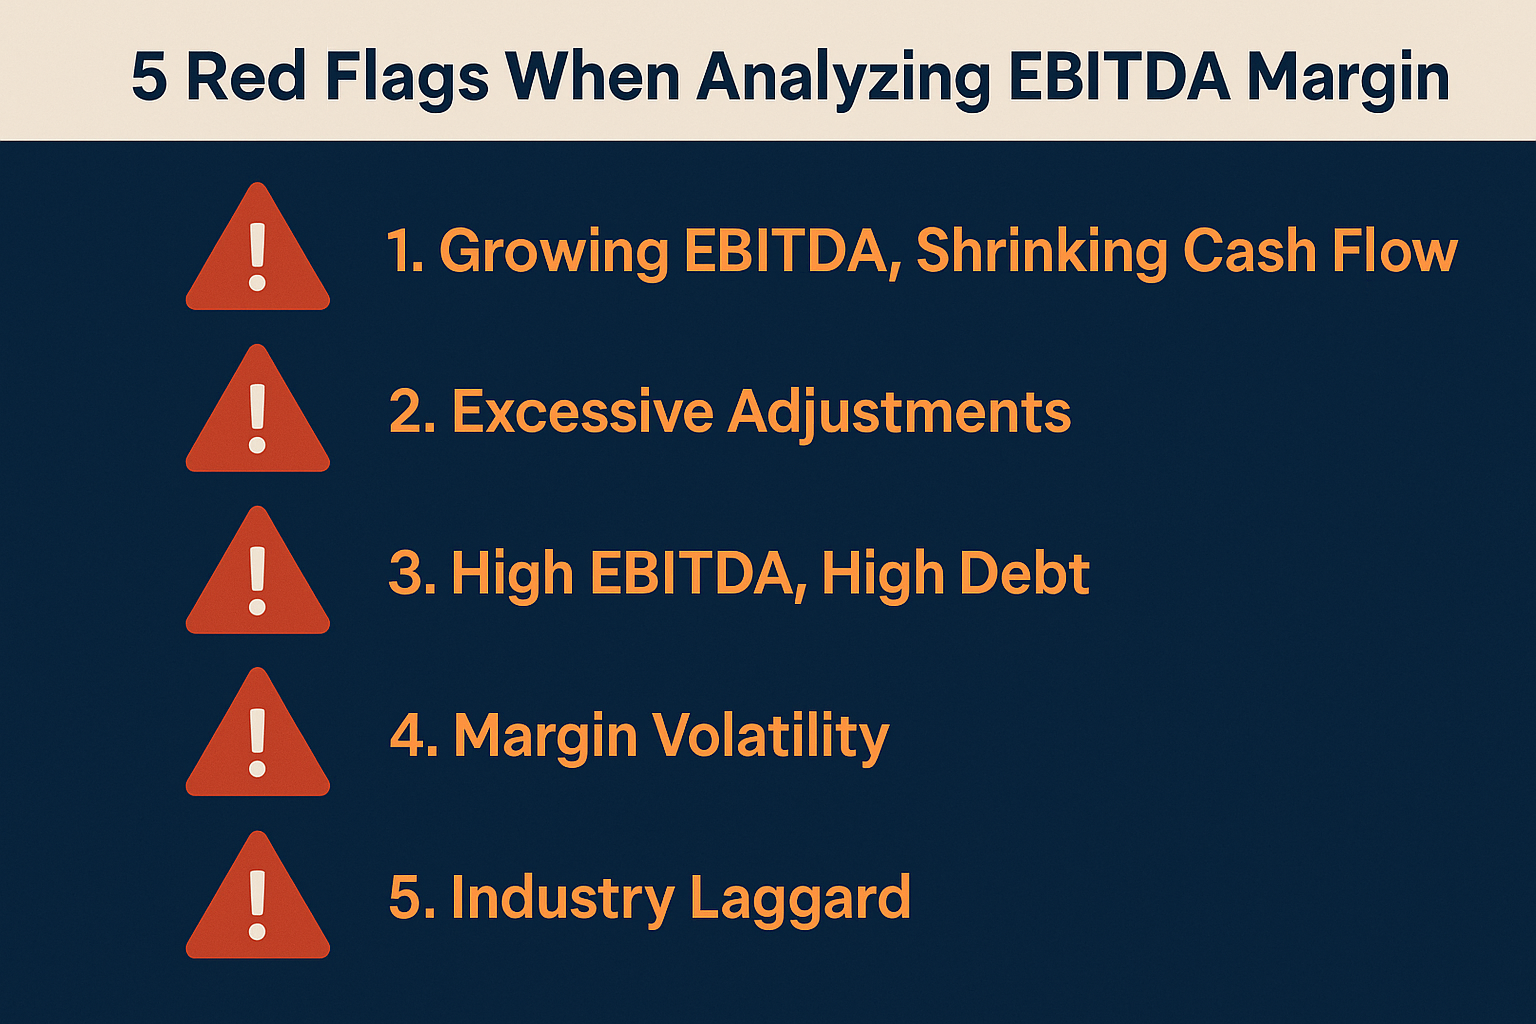
Red Flag #1: Growing EBITDA, Shrinking Cash Flow
If a company shows:
- Rising EBITDA margin
- Declining free cash flow
Possible causes:
- Aggressive revenue recognition
- Growing accounts receivable (customers not paying)
- Rising inventory (products not selling)
- Increasing CapEx requirements
Action: Investigate the cash flow statement and working capital trends.
Red Flag #2: Excessive “Adjustments” to EBITDA
Watch for companies that report:
- GAAP EBITDA: $50 million
- “Adjusted” EBITDA: $85 million
Common questionable adjustments:
- Stock-based compensation (a real expense!)
- “Non-recurring” charges that happen every year
- Restructuring costs (repeatedly)
- “One-time” legal settlements
Action: Read the footnotes carefully and calculate your own EBITDA using standard definitions.
🚩 Red Flag #3: High EBITDA Margin, High Debt
Companies with:
- Strong EBITDA margins (25%+)
- Debt-to-EBITDA ratios above 4x
The problem: All that operational profit goes to debt service, leaving little for shareholders.
Action: Calculate the interest coverage ratio (EBITDA ÷ Interest Expense). Ratios below 3x are concerning.
🚩 Red Flag #4: Margin Volatility
EBITDA margins that swing wildly (15% → 25% → 12% → 28%) suggest:
- Unstable operations
- Inconsistent pricing power
- Poor cost management
- Cyclical business dynamics
Action: Look for companies with stable or steadily improving margins over 3-5 years.
🚩 Red Flag #5: Industry Laggard
If a company’s EBITDA margin is significantly below industry peers, it might indicate:
- Competitive disadvantages
- Poor management
- Operational inefficiencies
- Structural problems
Action: Understand why the margin is lower. Sometimes it’s justified (investing for growth), but often it’s a warning sign.
Practical Tips for Using EBITDA Margin Effectively
Ready to put EBITDA margin to work in your investment analysis? Here are actionable strategies:
Strategy 1: Build a Comparison Spreadsheet
Create a simple Excel or Google Sheets template with:
- Company names (3-5 competitors)
- 5 years of EBITDA margin data
- Industry average
- Trend arrows (↑ improving, → stable, ↓ declining)
This visual comparison instantly reveals leaders and laggards.
Strategy 2: Combine with Multiple Metrics
Never evaluate EBITDA margin alone. Create a scorecard that includes:
- EBITDA margin (operational efficiency)
- Free cash flow margin (true cash generation)
- Return on invested capital (capital efficiency)
- Revenue growth (top-line momentum)
- Debt-to-EBITDA ratio (financial health)
Companies that score well across all metrics are the strongest candidates.
Strategy 3: Track Quarterly Trends
Set up alerts for quarterly earnings and track:
- Quarter-over-quarter margin changes
- Year-over-year margin changes
- Management’s explanation for margin movements
Consistent improvement or stable margins are positive signs.
Strategy 4: Read Management Commentary
During earnings calls and in annual reports, listen for:
- Management’s margin targets
- Initiatives to improve margins (cost-cutting, pricing power, efficiency gains)
- Headwinds affecting margins (competition, inflation, input costs)
This qualitative context helps you understand the numbers.
Strategy 5: Calculate Your Own EBITDA
Don’t blindly accept “adjusted EBITDA” figures. Calculate your own using standard definitions and compare:
- Your calculation vs the company’s reported figure
- Size and nature of adjustments
- Whether adjustments are truly one-time or recurring
Significant discrepancies warrant deeper investigation.
The Relationship Between EBITDA Margin and Stock Performance
Understanding how EBITDA margin correlates with stock performance can improve your investment decisions:
Research Findings
Academic studies and market analysis have shown:
- Companies with improving EBITDA margins tend to outperform the market over 3-5 year periods
- High-margin businesses typically command premium valuations (higher P/E and EV/EBITDA multiples)
- Margin expansion is often a stronger predictor of stock performance than revenue growth alone
- Consistent margins reduce volatility and attract long-term investors
Why Margins Matter for Stock Prices
Operating leverage: As companies scale, revenue growth can translate into even faster EBITDA growth, creating powerful returns for shareholders.
Example:
- Year 1: $100M revenue, 20% EBITDA margin = $20M EBITDA
- Year 2: $120M revenue (+20%), 24% EBITDA margin = $28.8M EBITDA (+44%)
That 20% revenue growth created 44% EBITDA growth through margin expansion!
When researching opportunities for passive income through dividend investing, strong and stable EBITDA margins often indicate:
- Sustainable dividend payments
- Ability to grow dividends over time
- Lower risk of dividend cuts
- Strong competitive moats
EBITDA Margin and Company Valuation
EBITDA margin plays a crucial role in how investors value companies:
The EV/EBITDA Multiple
Enterprise Value to EBITDA is one of the most popular valuation metrics because it:
- Accounts for both equity and debt
- Normalizes for different capital structures
- Works across industries
- Provides a clearer picture than P/E ratios for leveraged companies
Formula:
EV/EBITDA = (Market Cap + Debt - Cash) ÷ EBITDATypical ranges:
- High-growth tech: 15-25x EBITDA
- Mature industrials: 8-12x EBITDA
- Cyclical companies: 5-10x EBITDA
- Distressed businesses: 3-7x EBITDA
How Margins Affect Valuation Multiples
Companies with higher EBITDA margins typically trade at higher multiples because:
- Quality premium: High margins suggest competitive advantages
- Growth potential: Margin expansion can drive earnings growth
- Resilience: High-margin businesses weather downturns better
- Cash generation: Better margins mean more cash for shareholders
Example comparison:
- Company A: 15% EBITDA margin, trades at 8x EV/EBITDA
- Company B: 30% EBITDA margin, trades at 14x EV/EBITDA
Investors pay more for Company B because the superior margins indicate a higher-quality business.
Advanced Analysis: EBITDA Margin Decomposition
For sophisticated investors, breaking down EBITDA margin into components reveals deeper insights:
Margin Bridge Analysis
Track how different factors impact margin changes:
Prior Year EBITDA Margin: 20.0%
+ Volume/Scale Benefits: +1.5%
+ Price Increases: +0.8%
- Input Cost Inflation: -1.2%
- Labor Cost Increases: -0.6%
+ Efficiency Improvements: +0.5%
= Current Year EBITDA Margin: 21.0%
This analysis helps you understand:
- What’s driving margin changes (good reasons vs. bad reasons)
- Sustainability of improvements (one-time vs. structural)
- Management’s operational effectiveness
Segment-Level Analysis
For diversified companies, analyze EBITDA margins by:
- Business segment
- Geographic region
- Product line
- Customer type
This reveals:
- Which parts of the business are most profitable
- Where to focus growth investments
- Potential divestiture candidates (low-margin segments)
- Cross-selling opportunities
EBITDA Margin During Economic Cycles
Understanding how EBITDA margins behave during different economic conditions helps set realistic expectations:
During Recessions
What typically happens:
- Revenue declines
- Fixed costs remain relatively stable
- Margins compress (operating leverage works in reverse)
- Companies with high fixed costs suffer most
What to look for:
- Companies that maintain margins better than peers (indicate pricing power)
- Businesses with variable cost structures (more resilient)
- Management actions to protect margins (cost-cutting, efficiency initiatives)
During Expansions
What typically happens:
- Revenue grows
- Operating leverage kicks in
- Margins expand as fixed costs spread over more revenue
- Competition may increase (eventually pressuring margins)
What to look for:
- Companies investing in growth while maintaining margins
- Sustainable competitive advantages that protect margins
- Pricing power that allows margin expansion
Understanding Market Volatility
EBITDA margin stability during volatile periods often indicates:
- Strong business models
- Loyal customer bases
- Essential products/services
- Effective management teams
These companies tend to outperform during recovery periods.
Tools & Resources for EBITDA Margin Analysis
Equip yourself with the right tools for effective analysis:
Free Tools
- SEC EDGAR Database (sec.gov)
- Official source for all public company filings
- Search by company name or ticker
- Access 10-K, 10-Q, and 8-K reports
- Yahoo Finance (finance.yahoo.com)
- Quick access to financial statements
- Historical data
- Competitor comparisons
- Morningstar (morningstar.com)
- Excellent free financial data
- Industry comparisons
- Professional analysis (some premium features)
- FINVIZ (finviz.com)
- Stock screener with financial metrics
- Visual comparison tools
- Industry group analysis
- Google Sheets/Excel
- Build your own analysis templates
- Create comparison charts
- Track metrics over time
Premium Tools
- Seeking Alpha Premium
- Deep financial data
- Earnings call transcripts
- Analyst estimates
- Bloomberg Terminal
- Professional-grade data
- Advanced analytics
- Real-time information
- FactSet
- Comprehensive financial data
- Industry benchmarking
- Modeling tools
Learning Resources
To deepen your understanding:
- Investopedia: Comprehensive financial education
- CFA Institute: Professional investment standards and education
- Morningstar Investment Guides: Practical investing insights
- The RichGuyMath Blog: Clear, actionable investing education
Putting It All Together: A Complete EBITDA Margin Analysis Framework
Here’s a step-by-step framework for analyzing any company using EBITDA margin:
Step 1: Gather the Data (15 minutes)
- [ ] Pull 3-5 years of financial statements
- [ ] Calculate EBITDA for each year
- [ ] Calculate EBITDA margin
- [ ] Note any “adjusted” EBITDA figures and adjustments
Step 2: Industry Context (10 minutes)
- [ ] Research typical EBITDA margins for the industry
- [ ] Identify 3-5 direct competitors
- [ ] Calculate their EBITDA margins
- [ ] Understand industry dynamics (competitive intensity, barriers to entry, etc.)
Step 3: Trend Analysis (10 minutes)
- [ ] Plot EBITDA margin over 5 years
- [ ] Identify trend direction (improving, stable, declining)
- [ ] Read management’s explanation for margin changes
- [ ] Compare to competitor trends
Step 4: Quality Assessment (15 minutes)
- [ ] Compare EBITDA margin to free cash flow margin
- [ ] Check capital expenditure requirements
- [ ] Review working capital trends
- [ ] Analyze debt levels and interest coverage
Step 5: Red Flag Check (10 minutes)
- [ ] Look for excessive “adjustments” to EBITDA
- [ ] Check for divergence between EBITDA and cash flow
- [ ] Review margin volatility
- [ ] Assess competitive position
Step 6: Forward-Looking Analysis (10 minutes)
- [ ] Review management’s margin guidance
- [ ] Identify margin improvement initiatives
- [ ] Consider industry headwinds/tailwinds
- [ ] Estimate sustainable margin range
Total Time: ~70 minutes for comprehensive analysis
This systematic approach ensures you don’t miss critical factors and helps you make informed investment decisions.
Conclusion: Mastering EBITDA Margin for Smarter Investing
EBITDA margin is a powerful tool in your investment analysis toolkit, but like any tool, it’s most effective when used properly and in combination with other metrics.
Key Takeaways to Remember
EBITDA margin reveals operational efficiency by showing what percentage of revenue becomes earnings before interest, taxes, depreciation, and amortization. It’s calculated as (EBITDA ÷ Revenue) × 100.
Context is everything. A “good” margin varies dramatically by industry — 15% might be excellent for retail but poor for software. Always compare companies within the same sector and consider business model differences.
Never use EBITDA margin in isolation. Combine it with free cash flow, net income, return on invested capital, and debt metrics for a complete picture. Companies can have strong EBITDA margins while still destroying shareholder value.
Watch for red flags, including excessive adjustments to “adjusted EBITDA,” divergence between EBITDA and cash flow, high debt levels, and volatile margins over time.
Trends matter more than single points. Improving margins over 3-5 years indicates management excellence and competitive advantages. Declining margins signal potential problems worth investigating.
Your Next Steps
Ready to apply what you’ve learned? Here’s your action plan:
- Choose 3-5 companies in an industry you’re interested in
- Calculate their EBITDA margins using the formulas in this guide
- Compare the margins and identify the leaders and laggards
- Investigate the differences — why do some companies have better margins?
- Track margins quarterly to spot trends early
- Combine with other metrics like free cash flow and return on capital
- Make informed decisions about which companies deserve your investment dollars
Remember, successful investing isn’t about finding the perfect metric; it’s about understanding multiple perspectives on a business and making informed decisions based on comprehensive analysis.
EBITDA margin is one piece of the puzzle. When combined with understanding why the stock market goes up, knowledge of smart investing moves, and a grasp of fundamental analysis, you’ll be well-equipped to build a profitable investment portfolio.
Start analyzing companies today using EBITDA margin, and you’ll quickly develop the skills to separate truly great businesses from those that just look good on the surface.
Happy investing!
References & Further Reading
To deepen your knowledge and verify the information in this article, consult these authoritative sources:
Official Resources
- U.S. Securities and Exchange Commission (SEC) – www.sec.gov – Official regulatory filings and investor education
- Financial Accounting Standards Board (FASB) – Accounting standards and guidance
- CFA Institute – www.cfainstitute.org – Professional investment education and standards
Educational Resources
- Investopedia – www.investopedia.com – Comprehensive financial education and definitions
- Morningstar – www.morningstar.com – Investment research and analysis
- Federal Reserve Economic Data (FRED) – Economic data and trends
Additional Reading
- “Financial Statement Analysis” by Martin S. Fridson and Fernando Alvarez
- “The Intelligent Investor” by Benjamin Graham
- “Valuation: Measuring and Managing the Value of Companies” by McKinsey & Company
FAQ: EBITDA Margin
A good EBITDA margin typically ranges from 10-25% for most industries, but context matters significantly. Software and technology companies often achieve 30-50% margins due to low variable costs, while retailers might consider 8-12% strong. Always compare companies within the same industry and consider factors like company size, growth stage, and competitive positioning.
The formula for EBITDA margin is: (EBITDA ÷ Total Revenue) × 100. First, calculate EBITDA by starting with net income and adding back interest, taxes, depreciation, and amortization. Then divide EBITDA by total revenue and multiply by 100 to get the percentage. For example, if a company has $3 million EBITDA on $10 million revenue, the EBITDA margin is 30%.
EBITDA margin measures operational profitability before interest, taxes, depreciation, and amortization, while profit margin (net margin) shows the percentage of revenue that becomes actual profit after all expenses. EBITDA margin is always higher than profit margin and focuses purely on operations, whereas profit margin reflects the complete financial picture, including financing decisions and tax obligations.
Yes, EBITDA margin can be negative when a company’s operating expenses exceed its gross profit. This is common for early-stage startups, companies in turnaround situations, or businesses facing severe operational challenges. A negative EBITDA margin means the company is losing money on core operations before even accounting for interest, taxes, and non-cash charges.
Investors use EBITDA to measure operational performance because it removes the effects of financing decisions (interest), tax jurisdictions (taxes), and accounting policies (depreciation methods). This makes it easier to compare companies across different capital structures, locations, and asset ages. However, smart investors analyze both EBITDA and net income together for a complete picture.
Not necessarily. While higher EBITDA margins generally indicate better operational efficiency, they must be evaluated in context. A company sacrificing long-term growth for short-term margins, cutting essential investments, or operating in an unsustainable way might show high margins temporarily. Additionally, very high margins might attract new competitors, potentially eroding future profitability.
Software and SaaS companies typically have the highest EBITDA margins (30-50%+) due to low marginal costs and high scalability. Financial services, real estate, and technology hardware also tend to have above-average margins (20-40%). Capital-intensive industries like manufacturing and retail typically have lower margins (5-20%) due to higher operating costs and competitive pressures.
Disclaimer
This article is for educational purposes only and does not constitute financial advice. The information provided is based on general market knowledge and should not be considered personalized investment recommendations.
Investing in stocks and securities involves risk, including the potential loss of principal. Past performance does not guarantee future results. EBITDA margin is just one of many metrics used to evaluate companies and should not be the sole basis for investment decisions.
Before making any investment decisions, consider:
- Your individual financial situation
- Risk tolerance
- Investment objectives
- Time horizon
- Consulting with a qualified financial advisor
The examples used in this article are hypothetical and for illustration purposes only. Actual company performance may vary significantly.
Always conduct your own thorough research and due diligence before investing. The author and TheRichGuyMath.com assume no responsibility for investment decisions made based on this content.
About the Author
Written by Max Fonji — your go-to source for clear, data-backed investing education.
With over a decade of experience in financial analysis and investment education, Max specializes in breaking down complex financial concepts into actionable insights for everyday investors. His mission is to democratize financial knowledge and help individuals make smarter money decisions.
Max’s expertise spans fundamental analysis, valuation metrics, dividend investing, and portfolio strategy. Through TheRichGuyMath.com, he’s helped thousands of investors build confidence in their financial decision-making.
Connect with Max and explore more investing insights at TheRichGuyMath.com.