Picture this: You’re scrolling through a company’s earnings report, and suddenly you see a number that looks impressive, really impressive. The company claims profitability, but when you dig deeper into the actual net income, the story changes dramatically. What’s the secret? They’re highlighting EBITDA, a metric that’s become the darling of corporate presentations and investor pitches. But is EBITDA a window into true financial health, or just smoke and mirrors? Whether you’re evaluating high dividend stocks or analyzing your first investment opportunity, understanding EBITDA is absolutely essential. Let’s pull back the curtain on this widely, and often misunderstood financial metric.
TL;DR Summary
- EBITDA stands for Earnings Before Interest, Taxes, Depreciation, and Amortization, a measure of a company’s operating performance before accounting adjustments
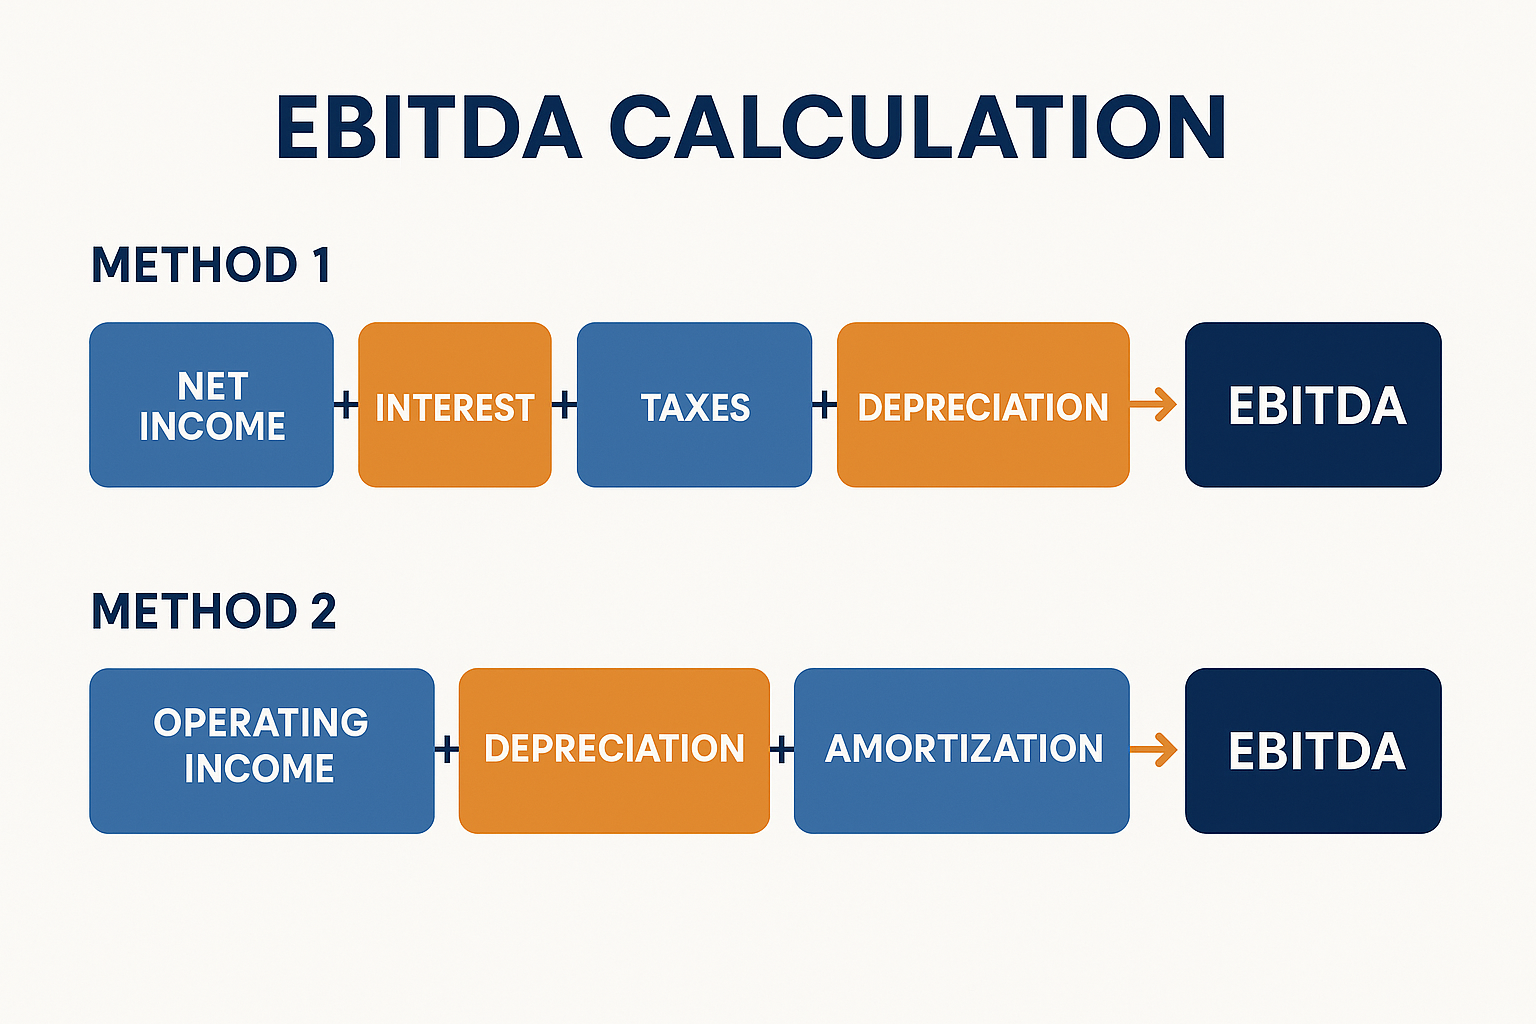
- The formula is: EBITDA = Net Income + Interest + Taxes + Depreciation + Amortization, or alternatively, EBITDA = Operating Income + Depreciation + Amortization
- EBITDA helps investors compare companies by stripping out financing decisions, tax environments, and accounting methods
- Major limitation: EBITDA ignores capital expenditures and working capital needs, which can paint an overly rosy picture of cash flow
- Use EBITDA alongside other metrics like free cash flow, net income, and debt ratios for a complete financial picture
What Is EBITDA? A Clear Definition
In simple terms, EBITDA means Earnings Before Interest, Taxes, Depreciation, and Amortization.
EBITDA is a financial metric that measures a company’s overall financial performance and profitability from core operations. By excluding interest, taxes, depreciation, and amortization from the calculation, EBITDA provides a clearer view of operational efficiency without the noise created by capital structure decisions, tax strategies, or accounting methods.
Think of EBITDA as a way to answer this question: How much money is this business generating from what it actually does, before we account for how it’s financed, taxed, or how we spread costs over time?
Why EBITDA Matters to Investors
When you’re learning about the stock market and evaluating potential investments, EBITDA serves several critical purposes:
Comparison tool: It levels the playing field when comparing companies with different capital structures, tax situations, or depreciation methods
Acquisition analysis: Private equity firms and acquirers use EBITDA to assess the value of potential targets
Operational focus: It highlights how well management runs the core business operations
Debt servicing capacity: Lenders examine EBITDA to determine whether a company can service its debt obligations
However, and this is crucial, EBITDA isn’t recognized by Generally Accepted Accounting Principles (GAAP), which means companies have some flexibility in how they calculate and present it. This flexibility can sometimes lead to creative accounting that obscures real financial issues.
The EBITDA Formula: How to Calculate It
There are two primary ways to calculate EBITDA, and both should arrive at the same number:
Method 1: Starting from Net Income
EBITDA = Net Income + Interest + Taxes + Depreciation + AmortizationThis is the most straightforward approach. You simply take the bottom-line net income and add back the four items that were subtracted to get there.
Method 2: Starting from Operating Income
EBITDA = Operating Income + Depreciation + AmortizationThis method starts with operating income (also called EBIT—Earnings Before Interest and Taxes) and adds back depreciation and amortization.
Real-World Calculation Example
Let’s walk through a practical example using a fictional company, TechGrow Inc:
| Income Statement Item | Amount |
|---|---|
| Revenue | $10,000,000 |
| Cost of Goods Sold | $4,000,000 |
| Gross Profit | $6,000,000 |
| Operating Expenses | $2,500,000 |
| Depreciation | $500,000 |
| Amortization | $200,000 |
| Operating Income (EBIT) | $2,800,000 |
| Interest Expense | $400,000 |
| Earnings Before Tax | $2,400,000 |
| Taxes (25%) | $600,000 |
| Net Income | $1,800,000 |
How to read an Income Statement
Using Method 1:
EBITDA = $1,800,000 (Net Income) + $400,000 (Interest) + $600,000 (Taxes) + $500,000 (Depreciation) + $200,000 (Amortization)
EBITDA = $3,500,000
Using Method 2:
EBITDA = $2,800,000 (Operating Income) + $500,000 (Depreciation) + $200,000 (Amortization)
EBITDA = $3,500,000
Both methods confirm that TechGrow Inc. generated $3.5 million in EBITDA, representing the earnings from core operations before accounting for financing costs, taxes, and non-cash charges.
Breaking Down Each Component of EBITDA
To truly understand EBITDA, let’s examine why each element is excluded:
Interest
Why it’s excluded: Interest expense reflects how a company finances itself (debt vs. equity), not how efficiently it operates. Two identical companies with different capital structures would show different profitability if interest were included.
What it tells you: By removing interest, you can compare a heavily leveraged company with one that’s debt-free on equal operational footing.
Taxes
Why it’s excluded: Tax rates vary dramatically by jurisdiction, corporate structure, and tax strategy. A company operating in Ireland faces different tax obligations than one in the United States.
What it tells you: Excluding taxes allows for apples-to-apples comparisons across different tax environments and focuses on pre-tax profitability.
Depreciation
Why it’s excluded: Depreciation is a non-cash accounting entry that spreads the cost of tangible assets (equipment, buildings, vehicles) over their useful life. Different companies use different depreciation methods and schedules.
What it tells you: Removing depreciation shows current operational performance without the impact of past capital investment decisions and varying accounting methods.
Amortization
Why it’s excluded: Similar to depreciation but for intangible assets (patents, trademarks, goodwill from acquisitions). This is particularly relevant for companies that have made acquisitions.
What it tells you: Excluding amortization prevents acquisition history from clouding operational performance assessment.
The Advantages of Using EBITDA
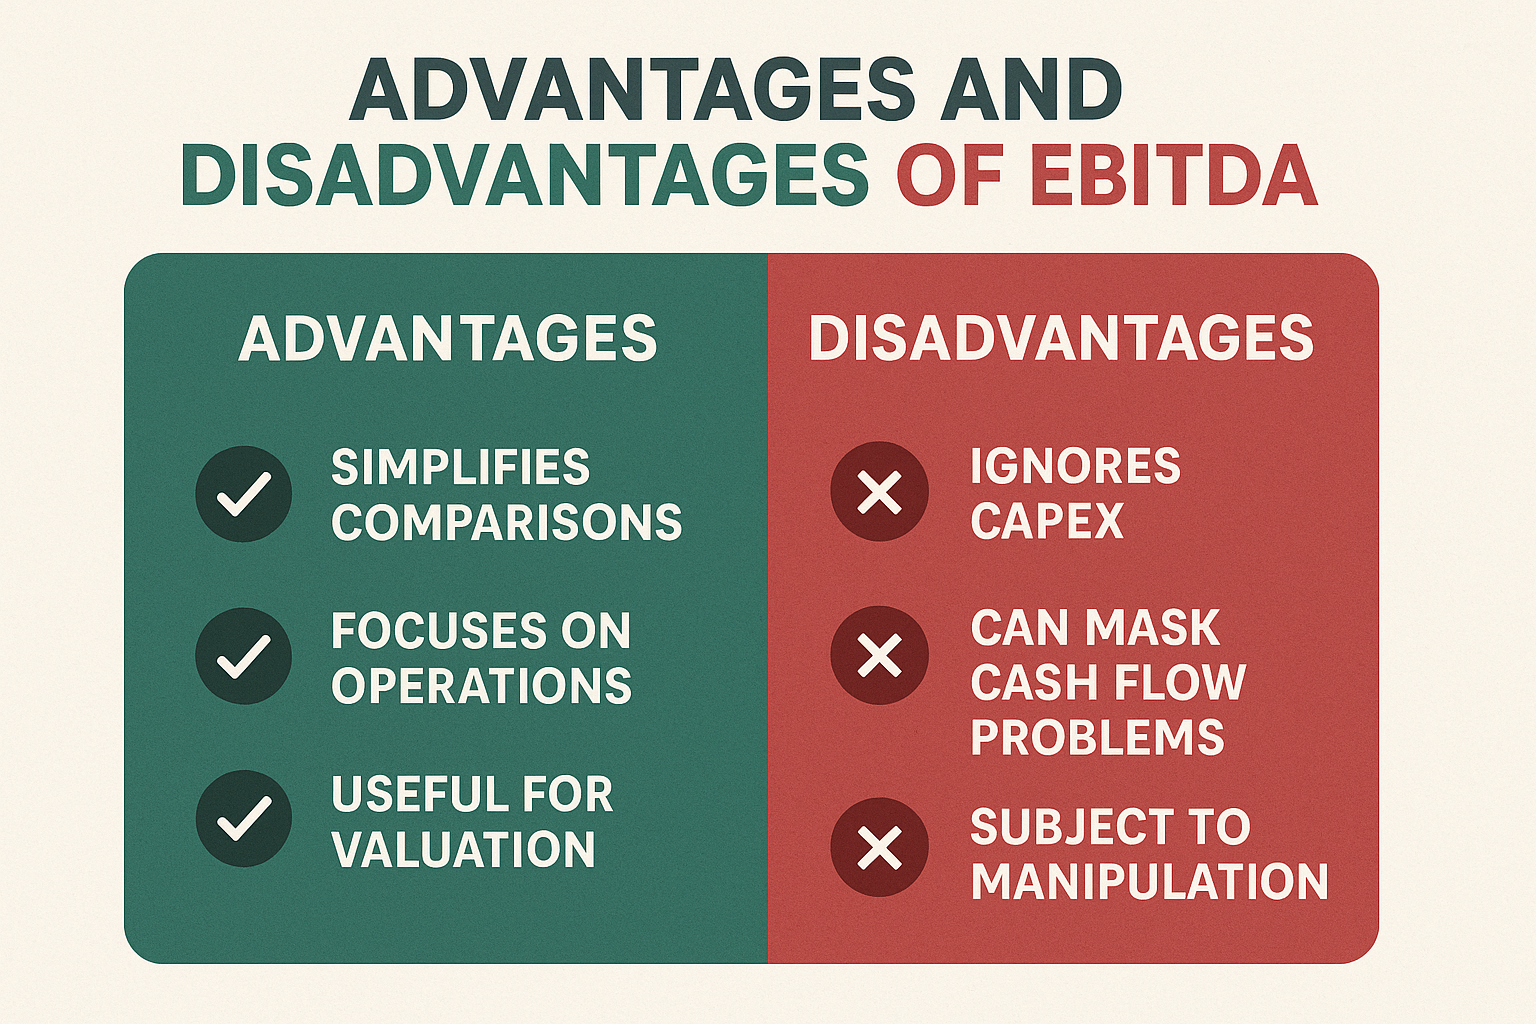
Simplifies Company Comparisons
EBITDA shines when you need to compare companies across different industries, countries, or with varying capital structures. For instance, when evaluating dividend investing opportunities, EBITDA helps you see which companies generate strong operational cash flow regardless of their financing choices.
Real-world application: A telecom company with billions in infrastructure assets and heavy depreciation can be meaningfully compared to a software company with minimal physical assets but significant amortization from acquisitions.
Focuses on Operational Performance
By stripping away financial engineering and accounting conventions, EBITDA zeroes in on what management controls directly: the ability to generate profit from operations.
Story from the field: In 2018, Tesla reported negative net income for most quarters, yet positive EBITDA showed the core automotive business was generating operational profit; the losses came from interest on debt and other non-operational factors.
Useful for Valuation Multiples
The EV/EBITDA ratio (Enterprise Value divided by EBITDA) is a popular valuation metric because it accounts for both equity and debt holders. Investors use EBITDA to measure the company’s ability to generate returns for all capital providers.
Highlights Cash Generation Potential
While not a perfect proxy for cash flow, EBITDA approximates the cash generated from operations before working capital changes and capital expenditures. This makes it valuable for assessing debt servicing capacity.
Neutralizes Accounting Method Differences
Companies can choose different depreciation methods (straight-line vs. accelerated) or amortization schedules. EBITDA eliminates these differences, creating a more standardized comparison point.
The Disadvantages and Risks of EBITDA
Ignores Capital Expenditures (CapEx)
This is EBITDA’s biggest blind spot. A company might show strong EBITDA but require massive ongoing capital investments to maintain operations. british-business
The formula for EBITDA is designed to exclude depreciation, but depreciation represents real economic wear-and-tear that requires eventual replacement spending.
Cautionary tale: During the dot-com bubble, many telecom companies boasted impressive EBITDA figures while burning through billions in capital expenditures to build networks. When capital dried up, many went bankrupt despite “strong EBITDA.”
Can Mask Serious Cash Flow Problems
EBITDA doesn’t account for:
- Changes in working capital (receivables, inventory, payables)
- Actual cash taxes paid
- Principal debt repayments
- Capital expenditures are needed to sustain the business
A higher EBITDA usually indicates stronger operational performance, but it doesn’t guarantee positive cash flow or financial health.
Subject to Manipulation
Since EBITDA isn’t a GAAP measure, companies have leeway in what they include or exclude. Some firms create “adjusted EBITDA” by removing expenses they deem “one-time” or “non-recurring”, sometimes stretching the definition beyond credibility.
Red flag example: WeWork’s infamous “Community Adjusted EBITDA” excluded marketing and general administrative expenses, costs that were clearly essential to running the business.
Ignores Debt and Interest Obligations
While removing interest helps with operational comparisons, it can hide dangerous debt loads. A company with spectacular EBITDA but crushing interest payments might be headed for bankruptcy.
Not Suitable for All Industries
EBITDA works best for capital-intensive businesses. For asset-light companies (consulting firms, software-as-a-service), traditional metrics like net income or free cash flow might be more relevant since depreciation and amortization are minimal.
EBITDA vs Other Financial Metrics: A Comparison
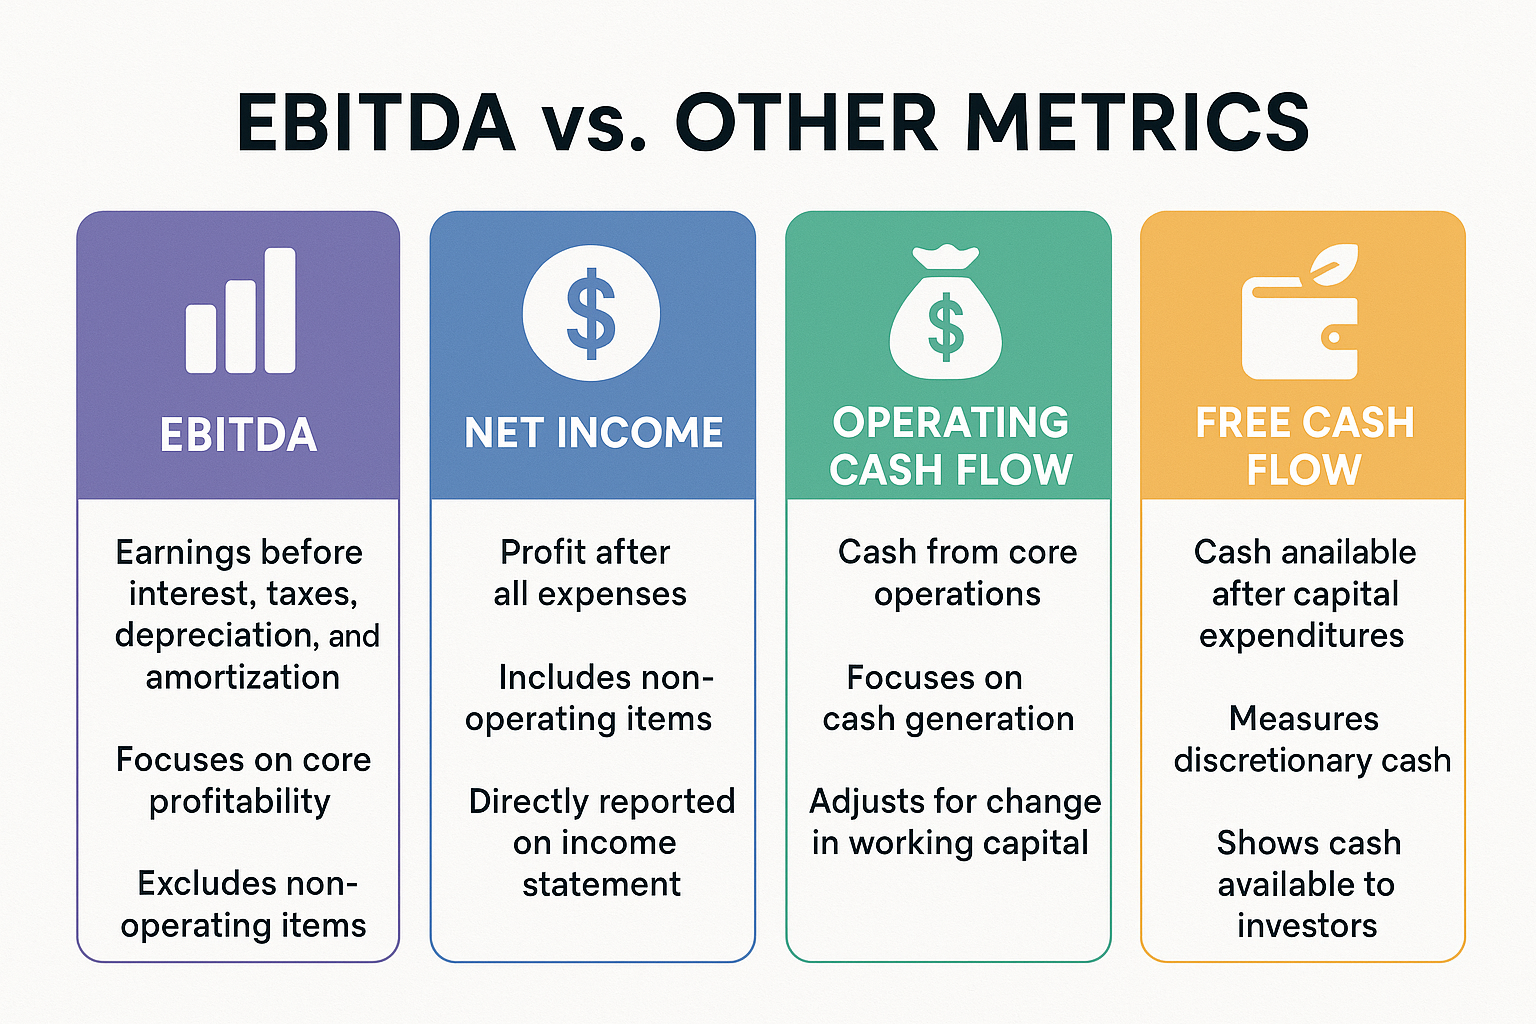
Understanding how EBITDA relates to other metrics helps you build a complete financial picture:
EBITDA vs Net Income
| Metric | What It Shows | Best Use |
|---|---|---|
| Net Income | Bottom-line profitability after all expenses | Overall profitability and earnings per share |
| EBITDA | Operational profitability before financing and accounting | Operational efficiency and company comparisons |
Key difference: Net income is the final accounting profit, while EBITDA focuses on operational performance. Net income is a GAAP measure; EBITDA is not.
EBITDA vs Operating Cash Flow
| Metric | What It Shows | Best Use |
|---|---|---|
| Operating Cash Flow | Actual cash generated from operations | True cash generation and liquidity |
| EBITDA | Proxy for cash generation (before CapEx and working capital changes) | Quick operational performance assessment |
Key difference: Operating cash flow accounts for working capital changes and is the actual cash generated. EBITDA is an approximation that’s easier to calculate but less precise. bdc.ca
EBITDA vs Free Cash Flow
Free Cash Flow (FCF) = Operating Cash Flow – Capital Expenditures
Free cash flow represents the cash available after a company has maintained or expanded its asset base, money that can be used for dividends, debt repayment, or growth initiatives.
Key difference: FCF is the gold standard for assessing financial health because it accounts for the capital needed to sustain the business. EBITDA ignores this crucial element.
EBITDA vs EBIT
EBIT (Earnings Before Interest and Taxes) is essentially EBITDA minus depreciation and amortization.
Key difference: EBIT includes depreciation and amortization, making it closer to actual accounting profit while still excluding financing and tax effects.
How to Use EBITDA in Investment Decisions
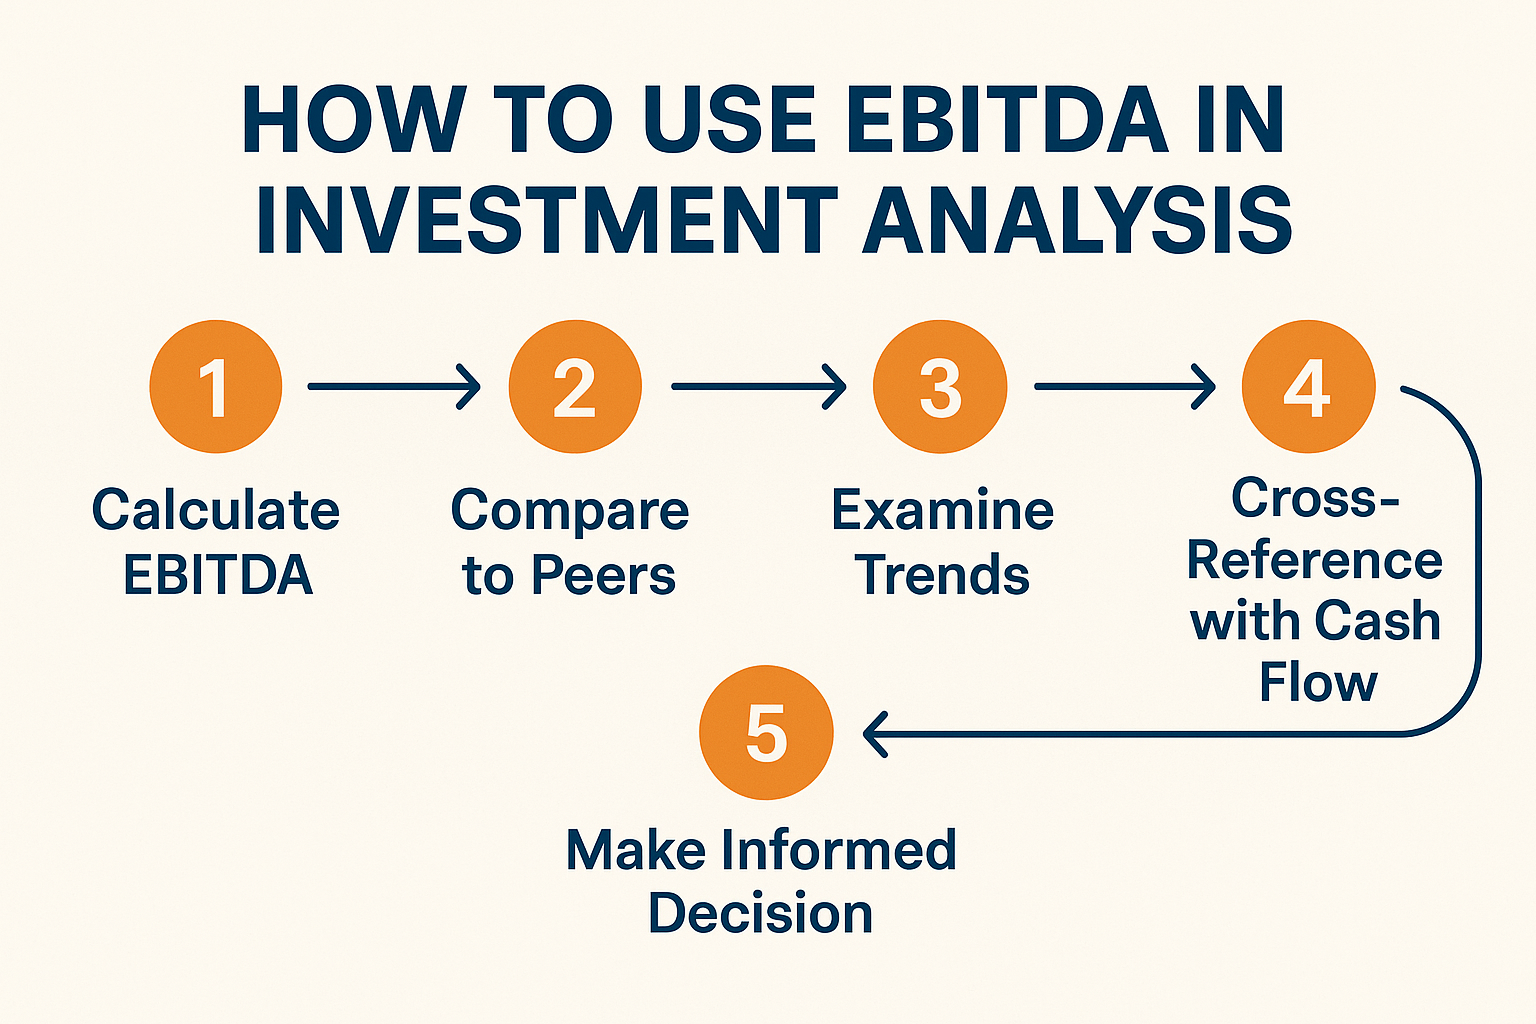
Step 1: Calculate the EBITDA Margin
EBITDA Margin = (EBITDA / Revenue) × 100
This percentage shows how much of each dollar of revenue becomes EBITDA. Higher margins generally indicate better operational efficiency.
Industry benchmarks:
- Software companies: 30-40%+
- Retail: 8-12%
- Manufacturing: 15-20%
- Telecommunications: 25-35%
Step 2: Use the EV/EBITDA Multiple
Enterprise Value (EV) = Market Cap + Total Debt – Cash
EV/EBITDA = Enterprise Value / EBITDA
This ratio shows how many years of EBITDA it would take to pay off the entire enterprise value.
What is a good EBITDA multiple?
- EV/EBITDA below 10: Potentially undervalued (but verify why)
- EV/EBITDA 10-15: Fair value for many industries
- EV/EBITDA above 15: Premium valuation (growth expectations or overvalued)
Context matters: High-growth tech companies might justify 20-30x EBITDA, while mature industrial companies might trade at 6-8x.
Step 3: Compare to Industry Peers
Never evaluate EBITDA in isolation. Compare the company’s EBITDA margin and EV/EBITDA ratio to competitors and industry averages.
Example analysis:
If Company A has an EBITDA margin of 25% while competitors average 18%, investigate why:
- Superior operational efficiency?
- Different business model?
- Accounting differences?
- Unsustainable cost-cutting?
Step 4: Examine the Trend
Look at EBITDA growth over time:
- Consistent growth: Indicates scaling operations and improving efficiency
- Declining EBITDA: Red flag requiring investigation
- Volatile EBITDA: May indicate cyclical business or operational instability
Step 5: Always Cross-Reference with Cash Flow
This is critical. Calculate the ratio:
Operating Cash Flow / EBITDA
If this ratio is consistently below 0.8, the company may be experiencing:
- Growing receivables (customers not paying)
- Inventory buildup
- Aggressive revenue recognition
- Other working capital issues
A healthy company typically shows operating cash flow equal to or greater than EBITDA over time. Investopedia
Common Mistakes When Using EBITDA
1: Treating EBITDA as Cash Flow
The problem: EBITDA doesn’t account for capital expenditures, working capital needs, or actual cash taxes paid.
The fix: Always examine the cash flow statement alongside EBITDA. Look at free cash flow for a true picture of cash generation.
2: Ignoring “Adjusted EBITDA” Red Flags
The problem: Companies sometimes add back expenses that are actually recurring operational costs, inflating the metric.
The fix: Scrutinize adjustments. Ask: “Is this truly one-time, or will similar costs recur?” Legitimate adjustments might include restructuring costs or asset impairments. Questionable adjustments include marketing, R&D, or “growth investments.”
3: Using EBITDA for Asset-Light Businesses
The problem: For companies with minimal depreciation and amortization (consulting firms, asset-light tech companies), EBITDA offers little advantage over net income or operating income.
The fix: Use EBITDA primarily for capital-intensive industries where depreciation significantly impacts reported earnings.
4: Overlooking Debt Levels
The problem: High EBITDA doesn’t help if crushing debt service consumes all the cash.
The fix: Calculate the Debt/EBITDA ratio. Ratios above 4-5x signal potential trouble. Also, examine EBITDA/Interest Expense (interest coverage)—below 3x is concerning.
5: Comparing Across Wildly Different Industries
The problem: EBITDA margins and multiples vary dramatically by sector.
The fix: Compare companies within the same industry or adjust expectations based on industry norms. A 15% EBITDA margin is excellent for grocery retail but mediocre for software.
Key Risks and Limitations Every Investor Should Know
1: The Capital Expenditure Trap
Some businesses require continuous heavy capital investment. Airlines, manufacturers, and telecom companies need to constantly replace and upgrade equipment. EBITDA ignores this reality.
Real-world impact: An airline might show $1 billion in EBITDA but require $1.2 billion annually in CapEx to maintain its fleet. The EBITDA looks great, but the business is actually destroying value.
2: Working Capital Deterioration
A company growing EBITDA while extending payment terms to customers and delaying payments to suppliers creates an illusion of health. When this reverses, cash flow collapses.
Warning signs:
- Days Sales Outstanding (DSO) is increasing
- Inventory days increasing
- Days Payable Outstanding (DPO) is increasing
- Operating cash flow is significantly below EBITDA
3: Acquisition Accounting Games
Companies that grow through acquisitions create significant amortization of intangible assets. While EBITDA excludes this, the acquisitions required real cash that must generate returns.
Critical question: Is the company generating enough cash to fund future acquisitions organically, or does it rely on raising external capital?
4: Ignoring Quality of Earnings
Not all EBITDA is created equal. Revenue recognized but not collected, aggressive capitalization of expenses, or channel stuffing can inflate EBITDA temporarily.
Due diligence checklist:
- ✓ Compare revenue growth to receivables growth
- ✓ Examine inventory turnover trends
- ✓ Review related-party transactions
- ✓ Check for frequent “one-time” adjustments
EBITDA in Different Industries: Context Matters
Manufacturing and Industrial
Why EBITDA matters: Heavy depreciation from equipment and facilities makes EBITDA essential for peer comparison.
What to watch: CapEx as a percentage of EBITDA should be sustainable. Ratios above 100% indicate the business is consuming more cash than EBITDA suggests.
Telecommunications
Why EBITDA matters: Massive infrastructure investments create enormous depreciation charges.
What to watch: Network upgrade cycles. Companies may show strong EBITDA but face looming multi-billion-dollar 5G buildouts.
Software and SaaS
Why EBITDA matters: Useful for companies with significant acquisition-related amortization.
What to watch: Customer acquisition costs and churn rates matter more than EBITDA for subscription businesses. Focus on unit economics and cash flow.
Retail
Why EBITDA matters: Helps compare companies with different store ownership models (owned vs. leased).
What to watch: Same-store sales growth and inventory management. EBITDA can mask deteriorating fundamentals.
Real Estate
Why EBITDA matters: Critical for REITs and real estate companies with substantial depreciation.
What to watch: Funds From Operations (FFO) is often more relevant than EBITDA for REITs.
Interpreting EBITDA: What the Numbers Really Mean
Strong EBITDA Indicators
EBITDA margin expanding over time → Improving operational efficiency and scaling
Operating cash flow consistently equals or exceeds EBITDA → Strong cash conversion
EBITDA growth outpacing revenue growth → Operating leverage kicking in
Debt/EBITDA ratio below 3x → Manageable leverage
EV/EBITDA multiple below industry average → Potential value opportunity
Warning Signs
EBITDA positive but net income deeply negative → Investigate interest expense and non-cash charges
Operating cash flow significantly below EBITDA → Working capital issues or accounting concerns
Frequent “adjusted EBITDA” with growing adjustments → Possible earnings manipulation
CapEx exceeding EBITDA → Unsustainable business model
EBITDA margin declining while revenue grows → Losing operational efficiency
Real-World Case Study: EBITDA in Action
Case Study: Two Restaurant Chains
Let’s compare two fictional restaurant chains to illustrate EBITDA’s utility and limitations:
ChainCo A:
- Revenue: $500M
- EBITDA: $75M (15% margin)
- Net Income: $25M
- Operating Cash Flow: $70M
- CapEx: $30M
- Debt: $100M
ChainCo B:
- Revenue: $500M
- EBITDA: $75M (15% margin)
- Net Income: $10M
- Operating Cash Flow: $50M
- CapEx: $60M
- Debt: $300M
At first glance, both companies have identical EBITDA and margins. But look deeper:
ChainCo A Analysis:
- Free Cash Flow: $70M – $30M = $40M
- Debt/EBITDA: 100/75 = 1.3x (healthy)
- Operating CF/EBITDA: 70/75 = 93% (excellent conversion)
- Conclusion: Strong, sustainable business
ChainCo B Analysis:
- Free Cash Flow: $50M – $60M = -$10M (burning cash!)
- Debt/EBITDA: 300/75 = 4x (concerning leverage)
- Operating CF/EBITDA: 50/75 = 67% (working capital issues)
- Conclusion: Despite identical EBITDA, this company faces serious problems
This example perfectly illustrates why understanding why people lose money in the stock market often comes down to focusing on the wrong metrics. EBITDA alone would have made these companies look identical, but a comprehensive analysis reveals vastly different financial health.
Advanced EBITDA Concepts for Serious Investors
EBITDA-to-Interest Coverage Ratio
Formula: EBITDA / Interest Expense
This ratio shows how many times a company can cover its interest obligations with operational earnings.
Benchmarks:
- Below 2x: Danger zone—company struggles to service debt
- 2-3x: Acceptable but tight
- Above 4x: Comfortable cushion
Adjusted EBITDA: When It’s Legitimate
Not all adjusted EBITDA is manipulation. Legitimate adjustments might include:
✓ One-time restructuring costs (facility closures, severance)
✓ Litigation settlements (truly non-recurring)
✓ Asset impairments (write-downs of goodwill or assets)
✓ Natural disaster impacts (hurricane damage, pandemic closures)
The key test: Will this expense truly never recur, or is it just being relabeled?
EBITDA in Leveraged Buyouts
Private equity firms love EBITDA because it shows how much cash flow is available to service the debt they’ll use to acquire a company.
LBO formula: Purchase Price = EBITDA × Multiple
Then they assess: Can EBITDA service the debt required at that purchase price?
Example: A PE firm considers buying a company with $50M EBITDA at 8x multiple = $400M purchase price. If they use 60% debt ($240M) at 6% interest, annual interest = $14.4M. EBITDA covers interest 3.5x—workable but tight.
How EBITDA Fits Into Your Investment Strategy
When you’re building smart ways to make passive income through investing, EBITDA should be one tool in your analytical toolkit—not the only one.
The Balanced Approach
Step 1: Use EBITDA to quickly assess and compare operational performance across companies
Step 2: Examine EBITDA trends over 3-5 years to identify improving or deteriorating businesses
Step 3: Cross-reference with cash flow metrics to validate the quality of earnings
Step 4: Consider the EV/EBITDA multiple relative to growth prospects and industry peers
Step 5: Investigate any significant divergence between EBITDA and net income or cash flow
EBITDA in Your Investment Checklist
When evaluating potential investments, ask:
- Is EBITDA growing consistently? Look for 5-10%+ annual growth
- How does the EBITDA margin compare to competitors? Top-quartile margins suggest competitive advantages
- Is operating cash flow keeping pace with EBITDA? Ratio should be 80%+ consistently
- What’s the CapEx requirement? CapEx should be less than EBITDA for sustainable businesses
- Is debt manageable relative to EBITDA? Debt/EBITDA below 3x for most industries
- Are there frequent “adjustments” to EBITDA? Red flag if adjustments are large and recurring
Combining EBITDA with Other Metrics
The most successful investors use EBITDA alongside complementary metrics:
Free Cash Flow: The ultimate measure of value creation
Return on Invested Capital (ROIC): Shows how efficiently capital is deployed
Price-to-Earnings (P/E): Traditional valuation metric
Debt ratios: Assess financial risk
Revenue growth: Indicates market position and demand
Understanding why the stock market goes up over time requires recognizing that companies creating real value, measured by cash flow, not just EBITDA, ultimately drive returns.
FAQ
A good EBITDA for a small business depends heavily on the industry, but generally: An EBITDA margin of 10-20% is solid for most small businesses
Service businesses should target 15-25% margins
Retail operations might achieve 5-15% margins
Manufacturing typically sees 12-20% margins
The absolute dollar amount matters less than the margin and trend. A small business with $500K EBITDA growing 20% annually is healthier than one with $1M EBITDA declining 10% yearly.
You cannot calculate EBITDA from a balance sheet alone. EBITDA requires income statement data. The balance sheet shows assets, liabilities, and equity at a point in time, while EBITDA measures earnings over a period (quarter or year).
To calculate EBITDA, you need:
Income statement: Net income, interest, taxes, depreciation, amortization
Sometimes cash flow statement: For verification and comparison
m-line profitability after all expenses.
Key differences:
Net profit includes interest, taxes, depreciation, and amortization
EBITDA excludes these items to focus on operational performance
Net profit is a GAAP measure; EBITDA is not
Net profit can be distributed to shareholders; EBITDA cannot (it’s not actual cash)
Think of it this way: EBITDA shows how profitable the core business is, while net profit shows what’s left for owners after all obligations.
ot necessarily. While higher EBITDA generally indicates stronger operational performance, context matters:
Higher EBITDA is better when:
It’s growing sustainably over time
Operating cash flow keeps pace
CapEx requirements are manageable
The business model is proven
Higher EBITDA might be misleading when:
It’s achieved through aggressive accounting
CapEx needs are massive and growing
Working capital is deteriorating
Debt levels are unsustainable
“Adjustments” are large and questionable
Always examine EBITDA in the context of cash flow, debt, capital requirements, and industry norms.
Yes, EBITDA can be negative, and it’s a serious red flag. Negative EBITDA means the company is losing money at the operational level, before even accounting for interest, taxes, depreciation, and amortization.
Negative EBITDA might be acceptable for:
Early-stage startups investing heavily in growth
Companies undergoing major restructuring
Businesses in temporary cyclical downturns
Negative EBITDA is alarming for:
Mature companies that should be profitable
Companies with persistent negative EBITDA (multiple years)
Businesses with negative EBITDA and high debt
If a company can’t generate positive EBITDA, it will struggle to survive without continuous capital infusions.
EBITDA is central to company valuations, particularly in mergers, acquisitions, and private equity deals.
Primary valuation method:
Enterprise Value = EBITDA × Industry Multiple
Example: A manufacturing company with $20M EBITDA in an industry where companies trade at 7x EBITDA would have an enterprise value of approximately $140M.
Valuation multiples vary by:
Industry: Tech companies might trade at 15-20x; retailers at 6-8x
Growth rate: Faster-growing companies command higher multiples
Profitability: Higher margins justify premium multiples
Market conditions: Bull markets expand multiples; bear markets compress them
Acquirers also use EBITDA to assess debt capacity and return on investment for leveraged buyouts.
Capital-intensive industries rely most heavily on EBITDA because depreciation and amortization significantly impact reported earnings:
Manufacturing: Heavy equipment depreciation makes EBITDA essential
Telecommunications: Massive infrastructure investments create large depreciation charges
Airlines: Fleet depreciation distorts net income
Healthcare facilities: Equipment and building depreciation is substantial
Utilities: Long-lived infrastructure assets generate significant depreciation
Real Estate: Property depreciation (though FFO is more common for REITs)
Media and entertainment: Content amortization affects reported earnings
Asset-light industries like consulting, software-as-a-service, and professional services use EBITDA less frequently since depreciation and amortization are minimal.
The Bottom Line: Using EBITDA Wisely
EBITDA is a powerful analytical tool when used correctly—and a dangerous distraction when misapplied. In simple terms, EBITDA means operational earnings before the effects of financing, taxes, and accounting methods, making it invaluable for comparing companies and assessing core business performance.
However, EBITDA’s limitations are real and significant. It ignores capital expenditures, working capital needs, and debt obligations—all critical factors in determining a company’s true financial health and investment potential.
The Smart Investor’s EBITDA Framework
Use EBITDA to compare operational efficiency across companies and industries
Examine EBITDA trends over time to identify improving or deteriorating businesses
Always cross-reference EBITDA with free cash flow and operating cash flow
Calculate key ratios like EBITDA margin, EV/EBITDA, and Debt/EBITDA
Scrutinize adjustments to EBITDA—question whether they’re truly one-time
Never use EBITDA alone as the basis for investment decisions
Don’t ignore capital expenditure requirements and working capital needs
Don’t assume higher EBITDA automatically means a better investment
Your Next Steps
As you continue your investing education and work toward building wealth, remember that understanding financial metrics like EBITDA is just one piece of the puzzle. The cycle of market emotions will test your discipline, and smart financial moves require balancing quantitative analysis with qualitative judgment.
Action items for this week:
- Pull the financial statements of three companies you’re interested in
- Calculate their EBITDA using both methods to verify your understanding
- Compare EBITDA margins to industry averages
- Examine the relationship between EBITDA and operating cash flow
- Calculate key ratios like EV/EBITDA and Debt/EBITDA
- Read the footnotes in the 10-K to understand any EBITDA adjustments
The companies that create lasting wealth aren’t necessarily those with the highest EBITDA—they’re the ones that efficiently convert operational earnings into sustainable cash flow while managing capital wisely. By understanding EBITDA’s strengths and limitations, you’ll make more informed investment decisions and avoid the costly mistakes that trip up less-informed investors.
Whether you’re building a portfolio for dividend income or planning to make your kid a millionaire through smart investing, mastering financial metrics like EBITDA gives you the analytical edge needed to identify truly great investments.
Remember: EBITDA is a tool, not a destination. Use it wisely, verify it thoroughly, and always, always, look at the complete financial picture.
📊 EBITDA Calculator
Calculate EBITDA using either method and analyze your company’s operational performance
Disclaimer
This article is for educational purposes only and does not constitute financial advice. The information provided about EBITDA and financial analysis is intended to help readers understand these concepts, but should not be the sole basis for investment decisions. Every investment carries risk, and past performance does not guarantee future results.
Before making any investment decisions, consult with a qualified financial advisor who understands your personal financial situation, goals, and risk tolerance. The examples and case studies presented are fictional or simplified for illustrative purposes and may not reflect real-world complexity.
EBITDA is just one of many financial metrics, and no single metric should be used in isolation. Always conduct thorough due diligence, examine multiple financial indicators, and consider qualitative factors before investing.
About the Author
Written by Max Fonji — With over a decade of experience in financial analysis and investment education, Max is your go-to source for clear, data-backed investing education. At TheRichGuyMath.com, Max breaks down complex financial concepts into actionable insights that empower everyday investors to build wealth intelligently.
Max's mission is simple: demystify finance, eliminate jargon, and provide the practical knowledge you need to make confident investment decisions. Whether you're just starting your investment journey or looking to sharpen your analytical skills, Max delivers the clarity and credibility you deserve.
Connect with Max and explore more investing insights at TheRichGuyMath.com.


